

1. Introduction
The development of low cost and simple experimental devices to analyze complex gas mixtures related to indoor air quality (IAQ) monitoring and food storage has attracted increasing interest.1,2,3) Metal oxide semiconductor (MOS) gas sensors, which are the most commercially suitable gas sensors, can meet these requirements with the advantage of low cost, short response times, and highly sensitive to harmful gases.4) For this reason, noxious gas monitoring studies have been performed using different approaches, such as amperometric sensors for the determination of amines,5) platinum electrodes to detect hydrogen peroxide,6) enzyme reactor-based systems,7) and electrochemical,8) polymer-coated quartz crystal microbalance (QCM),9) or metal oxide sensors based electronic noses.10,11)
MOS gas sensor-based thin and thick-film technologies are well established in the field of coating transducers with gas sensitive materials.12,13,14) Physical/chemical vapor deposition (PVD/CVD), thermal vacuum deposition, screen-printing and drop coating are some of the most widely used deposition techniques. In the specific case of resistive metal oxide gas sensors, the use of micro-hotplates as a substrate makes this technology suitable for markets where low-power consumption, low cost, rapid response and reliable devices are needed, such as in the production of portable instruments.
Gas identification based on pattern recognition techniques with an electronic nose concept has attracted considerable attention for more than thirty years.15) The ability to monitor and precisely measure the leakage of combustible and explosive gases is crucial for preventing the occurrence of accidental explosions. Buratti et al.16) predicted the sensory description of different brands of Italian wine using the method based on an electronic nose with a spectrophotometer. Zhao et al.17) assessed the quality of apples using a self-developed electronic nose system. Using an E-nose system, Yu and Wang18) achieved good results on the quality detection of agricultural products, such as Longjing tea, citrus, peaches, and tomatoes. On the other hand, there are few reports on monitoring systems based on pattern recognition techniques for IAQ monitoring and the detection of noxious gases from vehicles.
In this study, gas identification with a pattern recognition technique were developed using four micro-electronic gas sensors for noxious gases from automotive vehicles: two exhaust gases - carbon monoxide (CO) and nitrogen oxides (NOx), and two odor gases - ammonia (NH3) and formaldehyde (HCHO).19,20,21) The gas sensing properties to their target gases and the binary gas mixtures were characterized. For practical applications, a dataset of gas sensitivities was investigated using the pattern recognition technique of the principal component analysis (PCA) method. The discrimination characteristics of the data patterns among the six gas mixture systems were investigated.
2. Experimental Procedure
Gas sensing materials for the detection of their target gases, i.e., SnO2 for CO, In2O3 for NOX, WO3 for NH3, and SnO2-ZnO for HCHO, were synthesized using a sol-gel based method.19,20,21) Each sol with the sensing material was dropped and dispensed on the electrode part of the sensor platform, and the sensor chips were then heat-treated to their sintering temperatures.22) The fabricated four sensors were designated as SN (Pd-SnO2), IN (In2O3), WO (Ru-WO3), and SZ (Pd+SnO2-ZnO) sensors, respectively. The main features of all sensing materials were represented in Table 1. As shown in the table, the average particle size of 1 % Ru-WO3 is larger than those of other sensing elements; 1 % Pd-SnO2, In2O3 and 1 % Pd+SnO2-ZnO. It is commonly known that the precipitation of WO3 ‧ nH2O from a tungsten sol using concentrated tungstic acid and hydrogen peroxide occurs rapidly, often yielding the large micrometer-sized WO3 particles.23)
Table 1.
Main features of each sensing material.
| Sensor symbols | Sensing elements | Average particle size | Operating temperature (°C) |
| SN | 1 % Pd-SnO2 | 40 nm | 267 |
| IN | In2O3 | 70 nm | 267 |
| WO | 1 % Ru-WO3 | 1.0 µm | 334 |
| SZ | 1 % Pd+SnO2-ZnO | 20 nm | 367 |
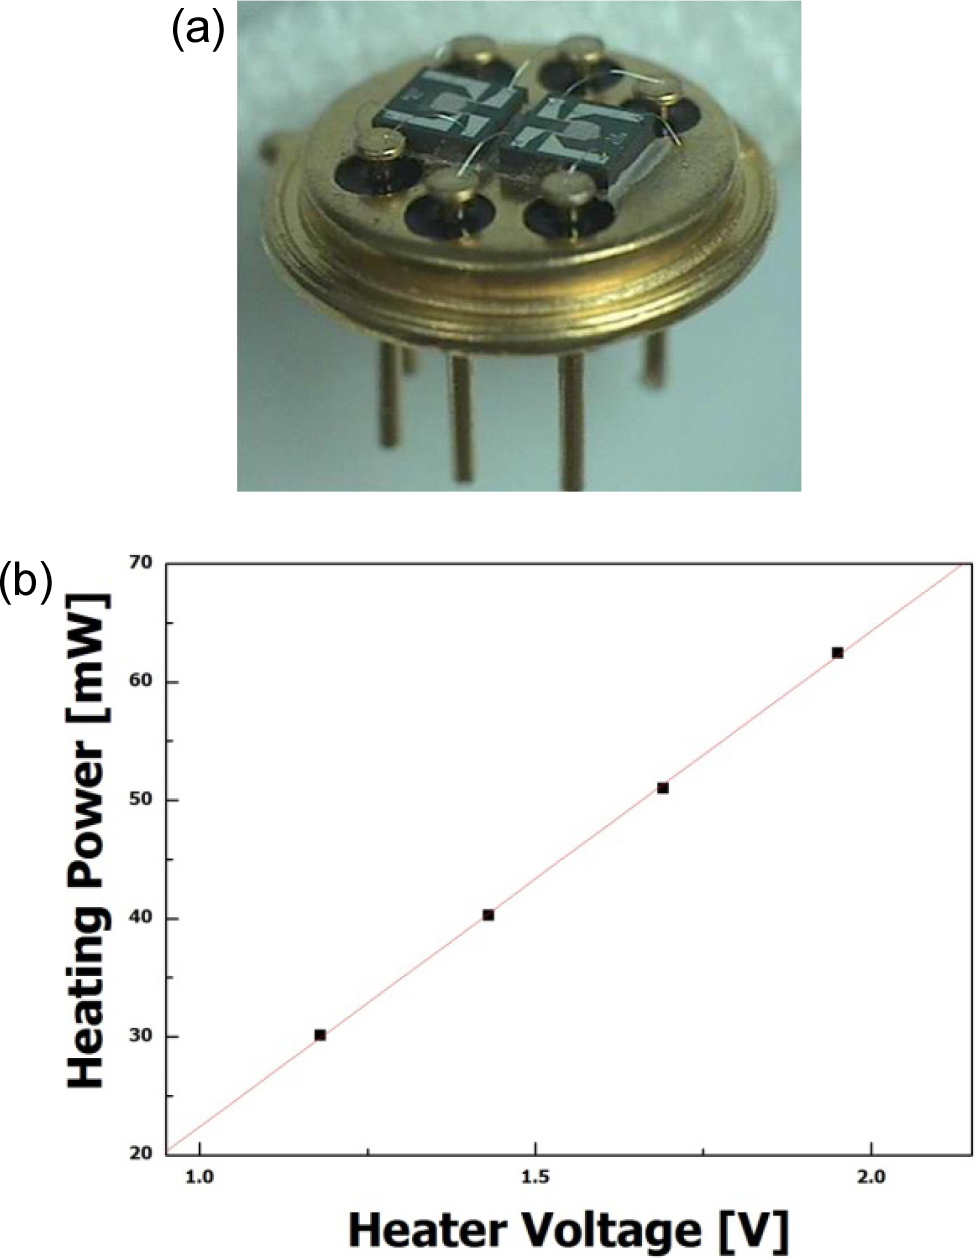
Fig. 1(a) shows the array type TO (transistor outline)-39 packages for sensor devices. The fabricated MEMS gas sensors showed low power dissipation, and the power consumption increased linearly with increasing operation temperature, as shown in Fig. 1(b). The power consumption of the micro platform was 41 mW at an operating temperature of 250 °C. The optimized operating temperatures of the sensor devices were 225 °C for the SN and IN sensors, and 360 °C for the WO and SZ sensors, and their power consumption was 35.26 mW and 64.37 mW, respectively.
The four gas sensors were evaluated in gas mixtures using a continuous gas system, and four sensors were placed in the test chamber. The test chamber was connected to a computer-supervised continuous flow system that produced the desired concentrations of the different gases and gas mixtures in a highly reproducible manner. The test gases (CO, NOx, NH3,and HCHO) diluted with nitrogen gas were carried with dry air at a constant flow rate. The total gas flow rate was set to 500 mL/min. The concentration in each test gas was 0~60 ppm for CO, 0~0.6 ppm for NO2, 0~10.0 ppm for NH3, and 0~5.0 ppm for HCHO. Six types of gas mixture (CO-NO2, CO-NH3, CO-HCHO, NO2-NH3, NO2-HCHO and NH3-HCHO) were used along with their mixing conditions.
3. Result and Discussion
Before performing the response test to the gas mixtures, the four sensors were characterized for their target gases. Table 2 lists the results of the gas sensitivity evaluation of each sensor to the target gases. The SN sensor was quite sensitive to its target gas (CO), and slightly sensitive to NO2, NH3 and HCHO gases. The IN sensor had perfect gas selectivity for NO2 gas but did not have any sensitivity to the other gases. The WO sensor had similar responses to all gases. The SZ sensor was quite sensitive to HCHO gas, and slightly sensitive to CO, NO2 and NH3 gases.
Table 2.
Gas sensitivity evaluation of each sensor to all gases; ◎: very sensitive, ○: sensitive, △: moderately sensitive, ×: non-sensitive.
| Sensors | CO | NO2 | NH3 | HCHO |
| SN | ◎ | ○ | △ | ○ |
| IN | × | ○ | × | × |
| WO | △ | ○ | ○ | ○ |
| SZ | ○ | ○ | △ | ◎ |
Table 3 lists the gas species showing higher sensitivity for each sensor to the six binary gas mixtures. The gas sensing behaviors to the mixed gas systems showed that the specific adsorption and selective activation of adsorption sites might occur in gas mixtures and offer priority for the adsorption of a specific gas. The NO2 gas responses were stronger than those of the CO and HCHO gases, whereas the NH3 gas responses were quite weak. In particular, the IN sensor was only sensitive to NO2 gas in all gas mixtures tested, and the SZ sensor was highly sensitive to its target gas (HCHO) even in NO2-HCHO mixtures.
Table 3.
Gas species showing higher sensitivity for each sensor in the gas mixture systems.
| Sensors | Gas mixtures | |||||
| CO+NO2 | CO+NH3 | CO+HCHO | NO2+NH3 | NO2+HCHO | NH3+HCHO | |
| SN | NO2 | CO | - | NO2 | NO2 | HCHO |
| IN | NO2 | × | × | NO2 | NO2 | × |
| WO | NO2 | CO | - | NO2 | NO2 | HCHO |
| SZ | NO2 | CO | HCHO | NO2 | HCHO | HCHO |
To quantify the sensor responses for both the oxidizing and reducing gases as well as their mixtures, the gas sensitivity (S) was defined as S = log{Rg/Ra}, where Ra is the sensor resistance in air and Rg is the sensor resistance after injecting the test gas. The magnitude of the gas sensitivity appeared to be negative (S < 0) for reducing gases, and positive (S > 0) for oxidizing gases. Fig. 2 shows the gas sensitivity dataset of the four sensors to CO and NO2 gases and their mixtures. In the CO-NO2 gas mixtures, the gas sensitivity was measured to be S < 0 in the case of the prevailing CO responses, where S > 0 in the case of the stronger NO2 responses. The dataset and the features coming from the sensor array measured in the different samples were extracted and treated using pattern recognition techniques. The PCA method was used to classify and discriminate the four noxious gases. The sensitivities (S) were selected as input parameters, and the S values were arranged in a specific matrix to gain clear insight into the applicability of the sensor array in this application.
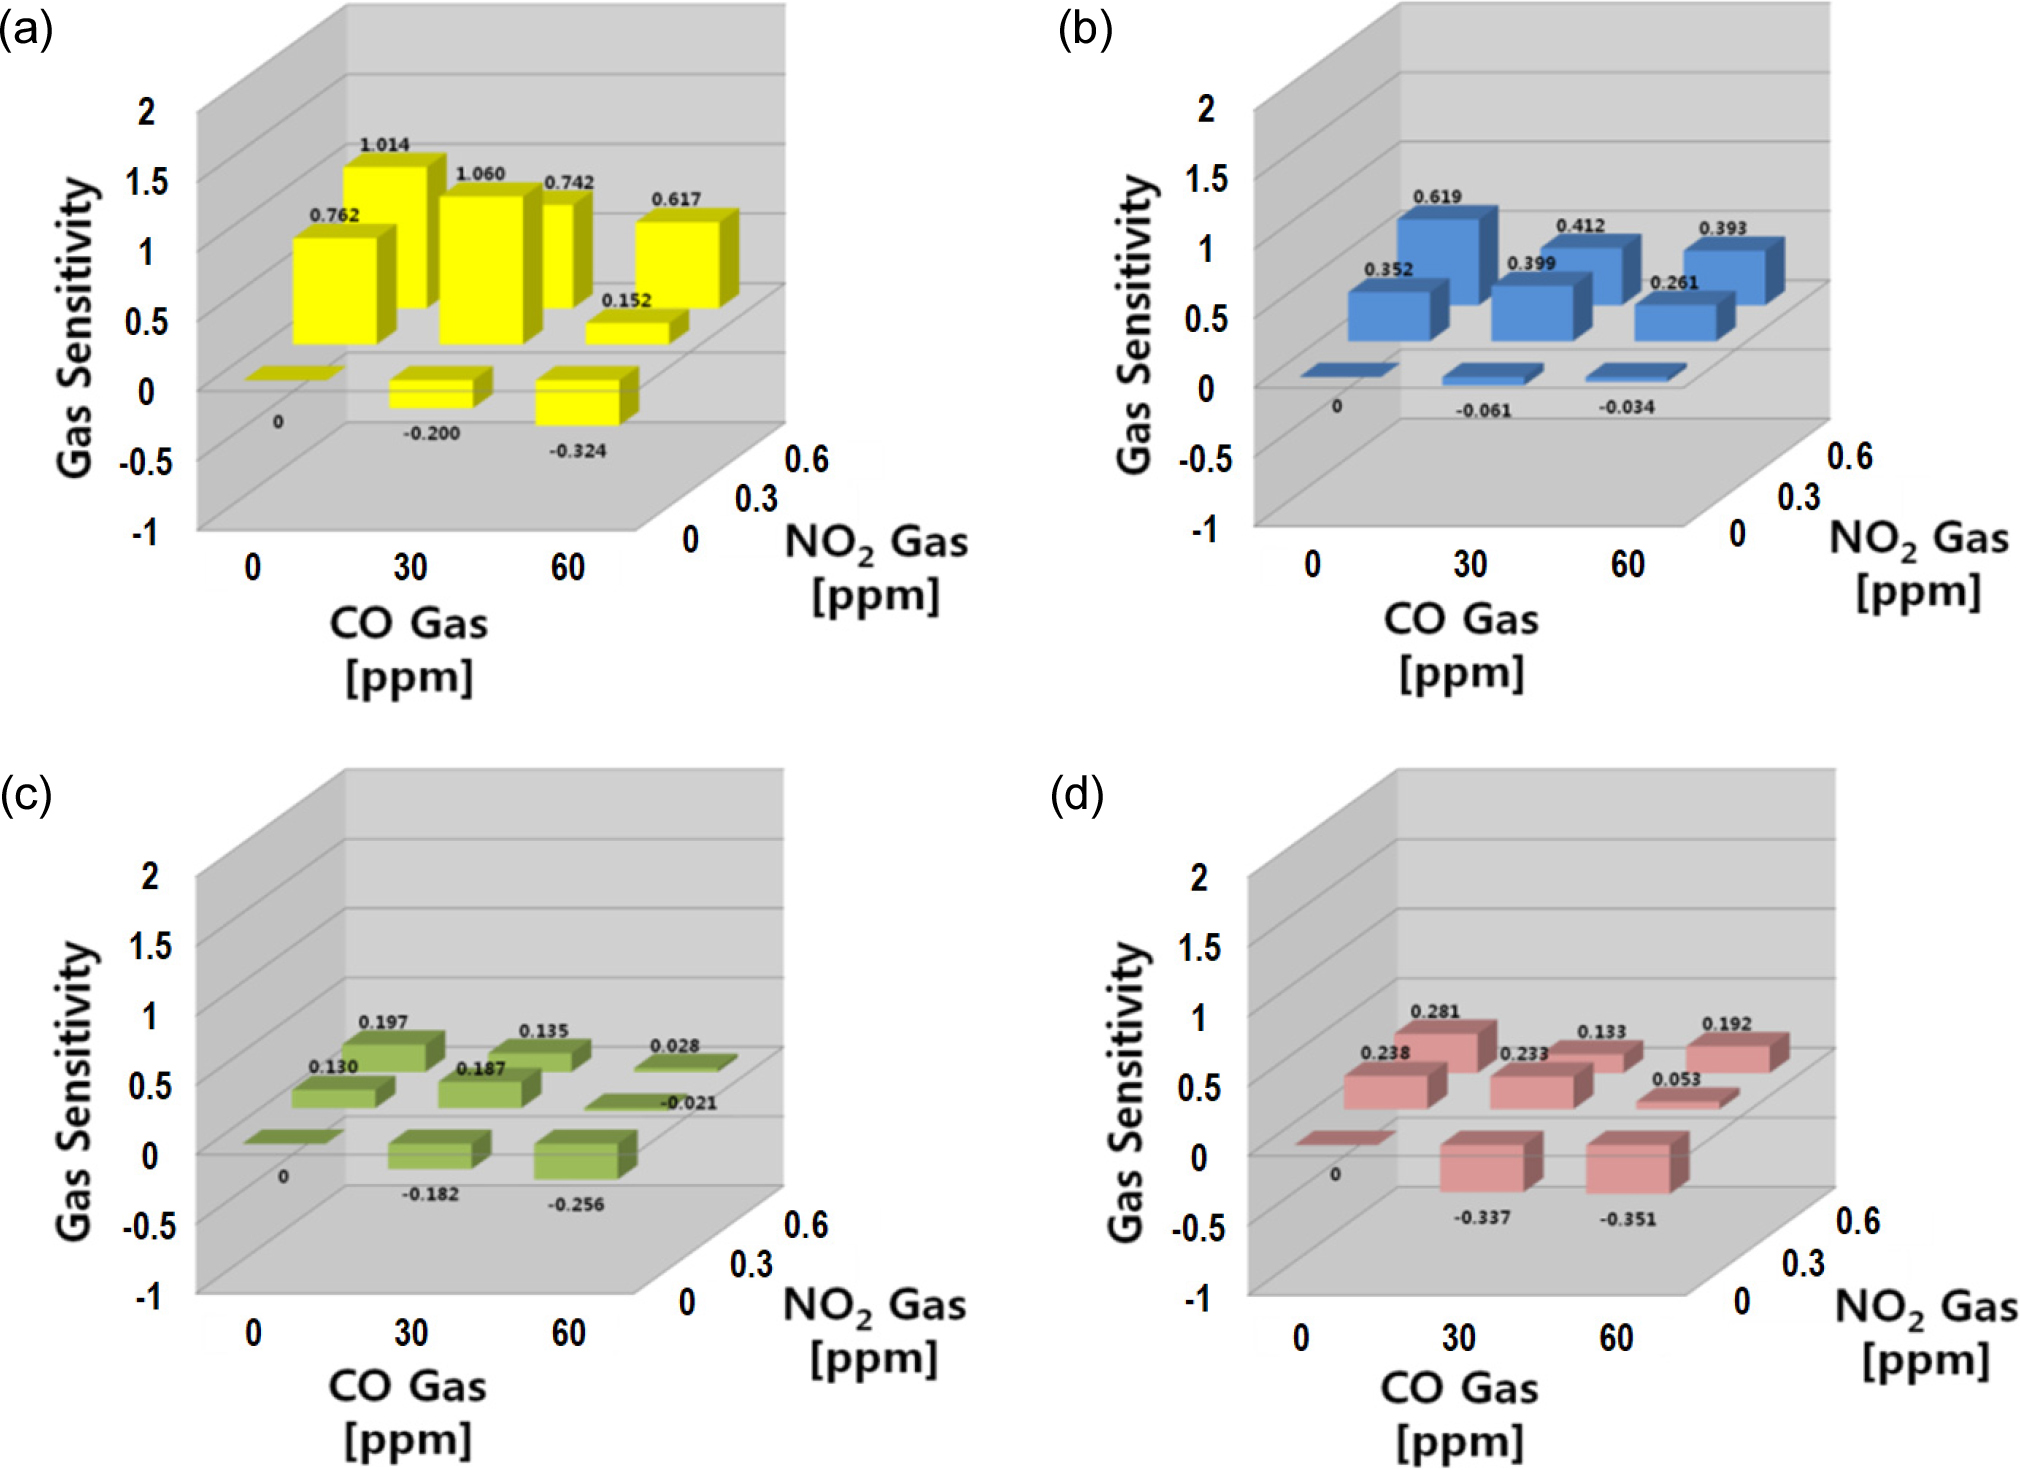
In the CO-NO2 system, all the sensor responses toward NO2 gas were stronger than those of the CO gases. The SN sensor showed a strong response to both gases and their mixtures, whereas the IN sensor responded only to NO2. The WO and SZ sensors showed similar behaviors to the SN sensor, but their sensitivities to NO2 gas were slightly lower. As shown in Fig. 3, the PCA plot of this mix gas system showed good separation and discrimination for those 8 data points. The PV plot results in this system suggested that the data points could be well discriminated despite the partial influence of NO2 gas, and the existence of NO2 gas appeared to be the dominant parameter for the decision of data point locations in the NO2-CO system.

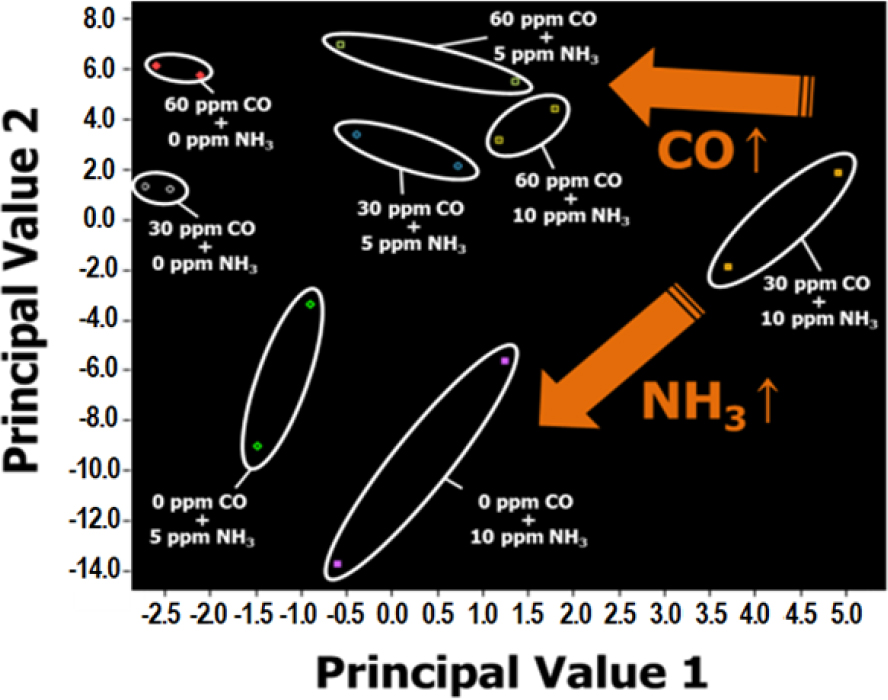
In the second set (CO-NH3 system), all the sensor responses for CO gas were stronger than those of NH3 gas in the CO-NH3 system. In the PCA plot of CO-NH3, the data points were inclined toward the left-upper side as the CO gas concentration increased, whereas they leaned toward the left-lower side for a higher NH3 concentration (Fig. 4). The data points leaned slightly to the upper side and these phenomena might be caused by the higher sensitivity to CO gas for all four sensors.
In the CO-HCHO system, the responses of the SN and WO sensors were similar for both gases, but the SZ sensor toward HCHO were stronger than CO gas. The IN sensor showed no responses to both gases. From these results, all the data points in the PCA plot (Fig. 5) for the eight gas mixtures were well discriminated and separated. The data points were inclined toward the upper side for a higher HCHO gas and toward the right-lower side for a higher CO concentration.

All four sensor responses were larger for NO2 gas than NH3 in the NO2-NH3 system. Fig. 6 shows PCA plots of the NO2-NH3 gas mixtures. The data points segregated into eight distinct, non-overlapping groups for the individual gas set. As the NO2 gas concentration increased, the data points were inclined toward the upper-right side locations. On the other hand, the influence of NH3 was less than that of NO2 gas, but NH3 gas reduced the principal value 2 (PV2). The results suggest that the gas mixture tests could be well classified and discriminated in NO2, NH3 gases and their mixtures.

The sensor responses to NO2 gas were stronger than those of HCHO gas in the NO2-HCHO system. The SN, IN, and WO sensors exhibited higher sensitivity to NO2 gas, but the SZ sensor was more sensitive to its target gas. Fig. 7 shows the PCA plots for the NO2-HCHO system. The principal value 1 was reduced by the existence of NO2 gas, and the data points were inclined toward the left-lower side as the NO2 gas concentration increased. Some overlapping groups appeared in the sole NO2 gases (0.3 ppm and 0.6 ppm) and two gas mixtures (0.3 ppm NO2 + 5.0 ppm HCHO and 0.6 ppm NO2 + 5.0 ppm HCHO). These phenomena might be caused by the difference in sensitivity between SZ and the other sensors. On the other hand, these results suggest that the gas mixture tests could be well classified and discriminated in NO2, HCHO gases and their mixtures.

In the final gas mixture system (NH3-HCHO), the sensor responses to HCHO gas were stronger than those to NH3 gases. In the PCA plot of CO-NH3, the data points were inclined toward the right-upper side as the HCHO gas concentration increased and toward the lower side with increasing NH3 concentration (Fig. 8). The data points leaned slightly to the upper side and these phenomena might be caused by the higher sensitivity to HCHO gas. This suggests that the sole existence of NH3 gas was the dominant parameter for determining the data point locations in the NH3-HCHO system.

The data patterns within the six categories of the gas mixture systems could be classified clearly using the above-mentioned validation approach based on the PCA results. This suggests that the response signals of the recognized data patterns can be used to identify and discriminate harmful gas mixtures. Furthermore, the outcome of this work confirms that the pattern recognition system based on the MOS sensor array may be utilized in practical fields such as gas identification and concentration analysis in various gas mixtures.
4. Conclusion
Gas identification techniques with pattern recognition methods based on micro-electronic gas sensors were developed using four micro-electronic gas sensors for noxious gas mixture analysis. The target gases for the air quality monitoring inside vehicles were two exhaust gases, carbon monoxide (CO) and nitrogen oxides (NO2), and two odor gases, ammonia (NH3) and formaldehyde (HCHO). In six binary mixed gas systems with oxidizing and reducing gases, the gas sensing behaviors and sensor responses were examined for the discrimination of gas species. The gas sensing behaviors in the mixed gas systems suggested that the specific adsorption and selective activation of the adsorption sites might offer priority for the adsorption of specific gases in gas mixtures. The gas sensitivity data was extracted and their patterns were recognized using principal component analysis (PCA) techniques. The PCA plot showed good separation among the mixed gas systems, which suggests that the gas mixture tests could be well classified and discriminated in the noxious gases and their mixtures. The data patterns within the six categories of gas mixture systems could be classified clearly using the practical approach based on the PCA results.
