

1. Introduction
2. Experimental Procedure
2.1. Materials
2.2. Preparation of SO4/SiO2 catalysts
2.3. Catalyst acidity test by ammonia vapor-gravimetric method
2.4. Optimization of nitrobenzene synthesis yield using 3-variables CCD-RSM experimental design
2.5. Nitrobenzene synthesis catalyzed by SO4/SiO2
3. Results and Discussion
3.1. Experimental design
3.2. Fourier transform infrared (FTIR) characterization of the catalysts
3.3. Crystallinity study of the catalysts
3.4. Acidity test of the catalysts
3.5. Textural properties analysis
3.6. Characterization by field emission scanning electron microscope (FESEM)
3.7. RSM analysis
3.6. Benzene nitration reaction study over SO4/SiO2 catalyst
4. Conclusion
1. Introduction
Nitrobenzene is one of the essential nitroaromatic compounds used as a solvent and intermediate for producing various organic compounds, such as paracetamol. Paracetamol is one of the widely used analgesic-antipyretic drugs because it has an activity that can suppress the function of the central nervous system selectively and is relatively safe with the use of therapeutic doses.1) As self-medication, paracetamol is recognized as the safest pain reliever.2) Indonesians have long recognized paracetamol as a febrifuge and painkiller. Paracetamol can be a safer alternative medicine and is recommended for early-stage and hospital management in patients with COVID-19.3)
The benzene nitration process generally involves a concentrated mixture of nitric and sulfuric acid. This exothermic reaction can be carried out using batch or continuous reactors.4) Benzene nitration is an exothermic reaction (ΔH = -117 kJ/mol). Therefore, the reaction heat during vapor phase nitration needs to be removed to maintain the reaction temperature of no more than 150 °C. The primary purpose of sulfuric acid is to protonate nitric acid to form nitronium ions as electrophiles, which are nitrating agents.5) The nitration reaction proceeds by electrophilic substitution of the nitronium ion on the aromatic ring.
Researchers, especially green industry players, continue to work on synthesizing nitrobenzene without the homogeneous catalyst of sulfuric acid because this catalyst is toxic to the environment and detrimental to industrial equipment.6,7) One of the interesting solid catalysts used for the nitration process of benzene is oxide catalysts such as silica. Silica-based catalysts have the advantages of having a large surface area, good chemical and thermal stability, and large porosity and pore size that facilitates substrate diffusion.8) Silica modification can be done easily using a sulfuric acid solution to increase the silica matrix’s acidity instead of impregnating a transition metal onto the silica matrix.
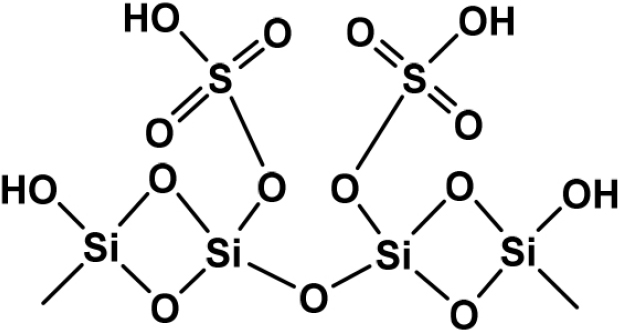
In recent years, SO4/SiO2 has shown great potential as an efficient and easily recoverable solid acid catalyst in promoting various important organic reactions under solvent-free conditions. The structure of sulfated silica can be seen in Fig. 1. According to,9) the presence of sulfate groups on the silica surface increases the total acidity of silica with the presence of more dominant Brønsted acid sites. Previous research by10) has reported that 33 % w/w SO4/SiO2 has good selectivity and catalytic performance in converting benzene to nitrobenzene with a yield of 40.33 % and shows its stability to be reused in 3 reaction cycles.
Several parameters will affect the yield of nitrobenzene, including sulfuric acid concentration on the catalyst, stirring time, and reaction temperature. The nitrobenzene yield estimation process can be analyzed using response surface methodology (RSM). RSM is a collection of mathematical and statistical techniques useful for modeling and analyzing problems where the desired response is affected by several variables. The goal is to optimize this response.12) RSM is the most suitable method in the optimization process for predicting the optimum parameters; it can save time and minimize experimental costs.13) The RSM design of the specified parameters can determine certain conditions, and the yield of the synthesis results will be maximized.14)
In this work, to optimize the product of benzene nitration catalyzed by SO4/SiO2, we used a second-order RSM-based experimental design, central composite design (CCD) with three independent variables. This research uses this method because it only requires a certain amount of data to perform evaluation, analysis, and optimization. Therefore, experiments can run more effectively as possible actions can be reduced.15) The number of experiments conducted with this method can be reduced because the replication focuses on the center point so that the study results are more accurate. The novelty of our research is the preparation of SO4/SiO2 catalyst using the top-down method with commercial silica gel precursor. Then, in synthesizing nitrobenzene, we used a batch microwave reactor, where the benzene nitration process does not involve conventional heating but uses the help of microwave irradiation, so it is expected that the homogeneity of the heat generated can also lead to an extensive product yield.
2. Experimental Procedure
2.1. Materials
The materials used in this research were silica gel, ethyl acetate, 98 % sulfuric acid (H2SO4, E Merck), 65 % nitric acid (HNO3, E Merck), benzene (C6H6, Smart Lab), and sodium sulfate (Na2SO4, E Merck).
2.2. Preparation of SO4/SiO2 catalysts
Silica gel granules were pulverized and then sieved using a 200-mesh sieve. A total of 29.5 g of sieved silica was then dissolved with 60 mL of ethyl acetate after dissolving 0.8 mL of sulfuric acid was added according to the concentration variation in the surface response method 93 %, 90 %, 85 %, 80 %, 76 %, and the mixture was stirred with a magnetic stirrer for 30 min at room temperature. Then ethyl acetate was removed under reduced pressure using a rotary evaporator. The residue was removed in an oven for 72 h at 100 °C.
2.3. Catalyst acidity test by ammonia vapor-gravimetric method
An empty porcelain dish was prepared and dried at 100 °C for 2 h, then weighed as W0. A total of 0.05 g of SiO2, 98 %, 90 %, 85 %, 80 %, and 76 % SO4/SiO2 catalyst samples were put into a porcelain dish and dried again at 100 °C for 2 h, then weighed as W1. The porcelain dish containing the catalyst was put into an acid test desiccator in a closed state. Ammonia vapor was directed to the desiccator for 30 min, then, the sample was allowed to stand for 24 h in the acid test desiccator. After 24 h, the porcelain dish was taken out and weighed as W2. The following Eq. (1) can calculate the acidity of the catalyst produced from this gravimetric method.
2.4. Optimization of nitrobenzene synthesis yield using 3-variables CCD-RSM experimental design
This experimental design uses CCD with three independent variables, which are sulfuric acid concentration on the silica (X1), stirring time (X2), and reaction temperature (X3). Then each is determined to be the minimum, middle, and maximum points. Fixed variables were 20 mL of nitric acid and 15 mL of benzene. The axial points of X1 were 76.60, 80, 85, 90, and 93.40 %, the axial points of X2 were 39.55, 60, 90, 120, and 140 min, and the axial points of X3 were 46.59, 50, 55, 60 and 63.41 °C as presented in Table 1. Based on the results of CCD coding for three variables, the experimental design was obtained, as shown in Table 2, with a total sample of 20.
Table 1.
CCD encoding results.
Table 2.
Second-order CCD matrix coded value and measured responses of the three variables.
2.5. Nitrobenzene synthesis catalyzed by SO4/SiO2
The CCD experimental design will be carried out on the synthesis of nitrobenzene. This synthesis uses a batch microwave reactor by adding 15 mL of benzene, 20 mL of 65 % HNO3, and 1 g SO4/SiO2 catalysts. According to the CCD experimental design, nitrobenzene synthesis will occur in as many as 20 experiments with variations in sulfuric acid concentration on the silica, stirring time, and reaction temperature. After obtaining the product, the catalyst is separated by filtration, and Na2SO4 is added to bind water to get a pure nitrobenzene product, which GC-MS will analyze. The catalyst selectivity can be determined using Eq. (2).
3. Results and Discussion
3.1. Experimental design
The experiment was designed so that the data generated could be processed using the response surface method. Optimization of nitrobenzene synthesis with sulfated silica catalyst was designed using the response surface method through Minitab 16 program in CCD. Before optimization, factors and levels were determined. The variables used in this study are sulfuric acid concentration on the silica (%), stirring time (min), and reaction temperature (°C). The levels used were low level (coded -1), medium level (coded 0), and high level (coded +1) plus axial points or starting points coded (-ἀ) and (+ἀ). The number of factors used is three, or the number of levels used is five, so the rotatibility = (23)1/4 = 1.682. Therefore, ±1.682 is used in coding the experimental design. Based on the calculation results, the coding values for variables X1, X2, and X3 are presented in Table 1. After coding is complete, an experimental design of 20 experiments consisting of 8 factorial points, 6 center points, and 6 axial points is obtained as shown in Table 2. The data is processed using Minitab 16 to determine the linear quadratic model formula.
Validation of the prediction model is done through graphical and numerical methods. The graphical method used is the residual test to determine the difference in observed and predicted values and to show that the model is normally distributed. In this experimental design, five variations of sulfuric acid concentration on the silica are 93 %, 90 %, 85 %, 80 %, and 76 %. Therefore, before applying the catalyst in the synthesis of nitrobenzene, the appropriate concentration variation was prepared in advance in the experimental design treatment. Furthermore, the treatment will produce response variables taken from nitrobenzene synthesis data.
3.2. Fourier transform infrared (FTIR) characterization of the catalysts
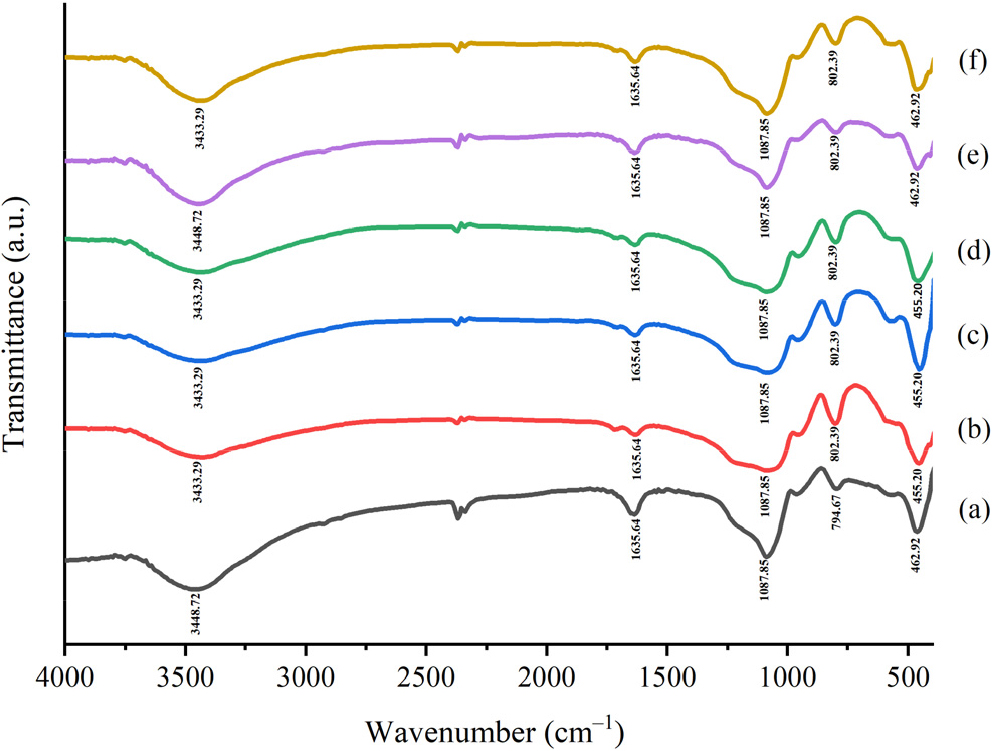
Fig. 2 shows the FTIR spectra of SiO2 and SO4/SiO2 with varying concentrations of H2SO4. The peak widens at wavenumbers between 3,300 cm-1 and 3,500 cm-1, indicating the absorption of O-H stretching vibrations on Si-OH. The peak is supported by wavenumbers around 1,640 cm-1, showing H-O-H deformation that interacts through hydrogen bonds with silanol groups.16) At a wavenumber around 1,087 cm-1, a peak broadening indicates the absorption of asymmetric Si-O stretching vibrations from Si-O-Si. The addition of sulfuric acid to SiO2 does not give rise to new peaks in the FTIR spectrum. At the peak of Si-O-Si asymmetric stretching vibrations, S-OH stretching vibrations of HSO4- are also shown, which are sulfated silica ions that will overlap fully or partially.17) This result is to the research conducted by Zarei et al.11) that there is an overlap between the asymmetric stretching vibration of Si-O-Si and the symmetric and asymmetric stretching vibration of O = S = O of HSO4-, with a wavenumber ranging from 1,000 to 1,300 cm-1. A wavenumber around 799 cm-1 shows symmetrical stretching vibrations of the Si-O group. Then, at a peak around 460 cm-1, it shows the bending vibrational absorption of Si-O.9) The peak intensity in sulfated silica decreased due to lower water desorption.18) Based on this interpretation, the sulfation process on the silica matrix has been successfully carried out.
3.3. Crystallinity study of the catalysts
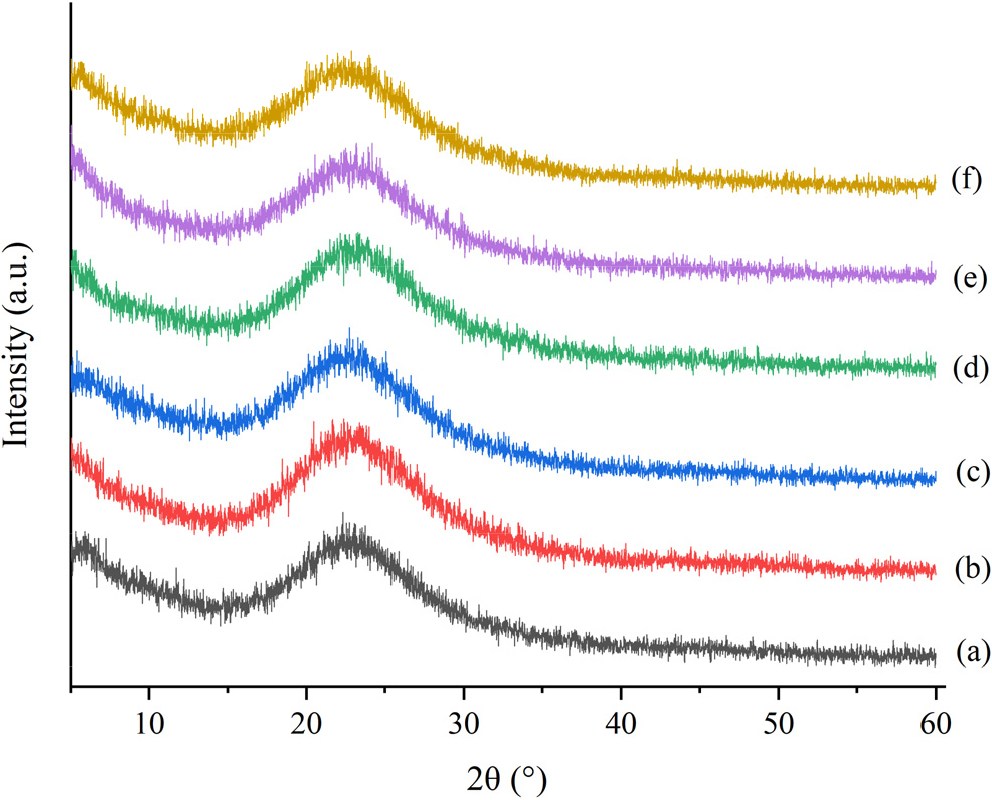
Diffraction patterns formed on each SiO2 catalyst, SS 76 %, SS 80 %, SS 85 %, SS 90 %, and SS 93 %, on a broad peak that appears at 2θ around 22°, which indicates that each catalyst has an amorphous silica catalyst structure. Based on the diffractogram does not produce a sharp peak, it is amorphous.19)Fig. 3 shows that adding variations in sulfuric acid concentration to activate silica does not cause changes in the crystal structure of silica.20) The successfully formed silica catalyst is characterized by the peak produced by the amorphous silica catalyst data contained in International Centre for Diffraction Data (ICDD) 075649.
3.4. Acidity test of the catalysts
The acidity of the catalyst significantly affects the catalytic activity in the benzene nitration reaction. This is because catalysts such as SO4/SiO2 have many acid sites, so the catalytic activity of benzene nitration increases.21) The acidity of the catalyst in this study is based on the gravimetric method’s adsorption of ammonia gas (NH3). Ammonia is a more substantial base than pyridine, so in interacting with acidic sites on the catalyst, ammonia adsorbs more strongly. Ammonia with a smaller molecular size can enter the catalyst pore and adsorb on the acid site of the catalyst.
Table 3 shows that the sulfation process of silica with sulfuric acid can increase the acidity of the SiO2 catalyst to SS 90 %. However, the SS 93 % catalyst experienced a decrease in acidity, according to Ahmed et al.,22) due to the distribution and amount of sulfate that has reached the maximum point, so the adsorbed base will decrease. SS 90 % catalyst has the highest acidity value of 3.1707 mmol/g. Therefore, the catalyst with the highest acidity will affect the catalytic activity of benzene nitration.
Table 3.
The results of the catalyst acidity test.
| Catalyst | Acidity (mmol/g) |
| SiO2 | 1.4092 |
| SS 76 % | 1.7615 |
| SS 80 % | 1.9964 |
| SS 85 % | 2.3487 |
| SS 90 % | 3.1707 |
| SS 93 % | 2.7010 |
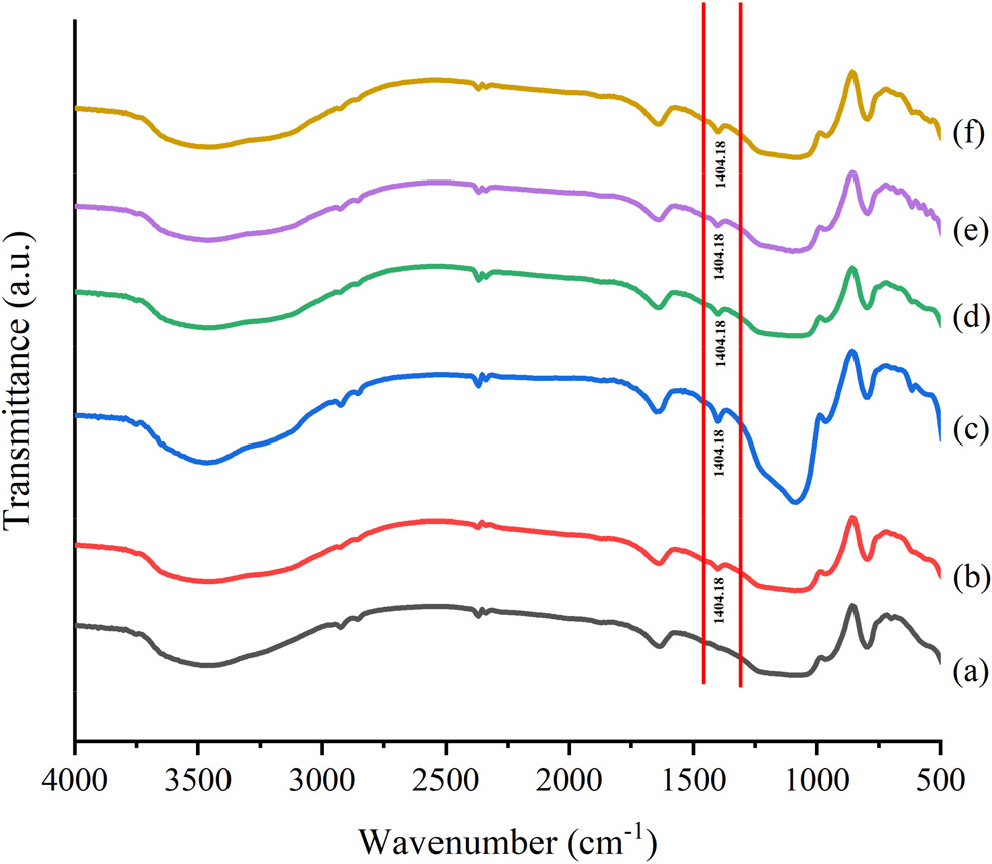
Qualitative analysis was carried out with an FTIR instrument to confirm the presence of Brønsted and Lewis acid sites on the catalyst. The FTIR spectra for the catalyst samples after being flooded with ammonia vapor are presented in Fig. 4.
Fig. 4 presents the FTIR spectrum after ammonia adsorption. Vibration around 1,404 cm-1 confirms the presence of ammonia in conjugated acid form based on the interaction with hydrogen from Brønsted acid sites.23) The Brønsted acid site appears in the 1,600 cm-1 area due to N-H vibrations from NH4+ which can act as a proton donor. At the same time, the Lewis acid site occurs in the 1,450 cm-1 area due to the N-H vibrations of NH3-Si, which can result in the exchange of electron pairs. Brønsted and Lewis acid sites on the surface are proton donors and electron pair acceptors, respectively.8)
3.5. Textural properties analysis
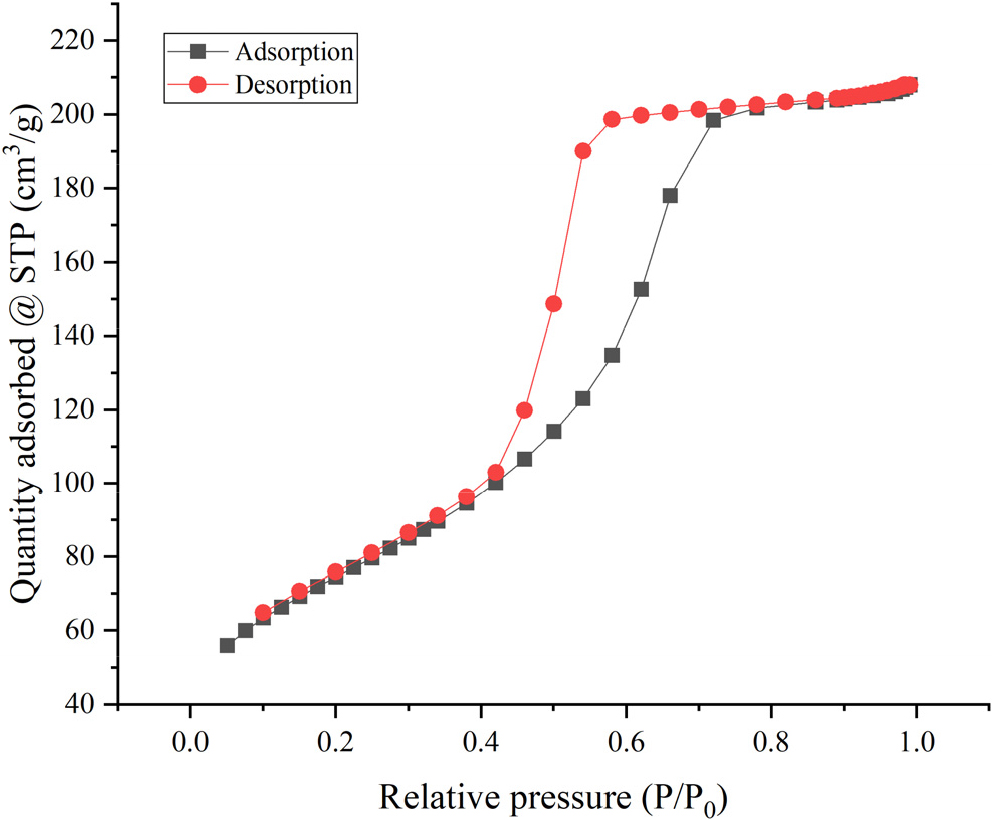
Textural properties of the 90 % SS catalyst presented in Table 4 sulfated silica is a mesoporous material (2 < d < 50 nm) with a large surface area and pore volume. These results indicate that this material has good potential in catalyzing benzene nitration. From Fig. 5, it was found that according to International Union of Pure and Applied Chemistry (IUPAC), the SS 90 % catalyst has a type IV N2 adsorption-desorption curve with an H2-type hysteresis loop, indicating that the catalyst material is mesoporous, revealing that the pores’ size and shape were uneven, which may potentially indicate the existence of pore blockage.
Table 4.
Textural properties of the SS 90 % catalyst.
| Textural properties | Results |
| Specific surface area | 262.288 m2/g |
| Total pore volume | 0.321 cm3/g |
| Average pore diameter | 2.814 nm |
3.6. Characterization by field emission scanning electron microscope (FESEM)
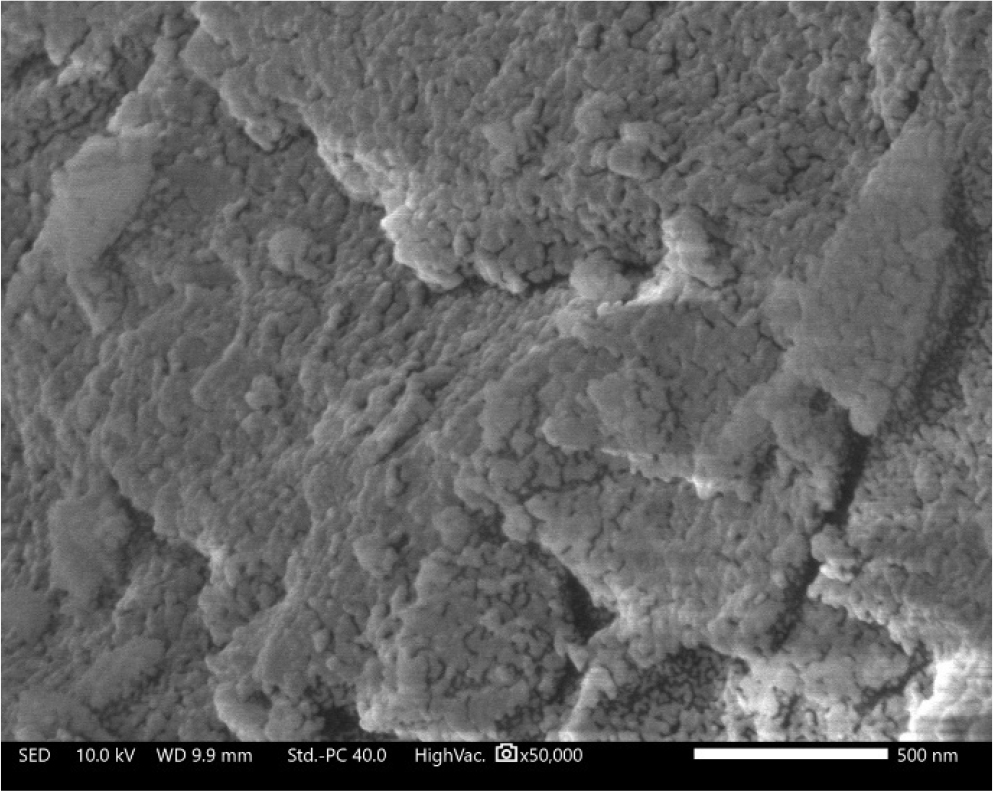
FESEM image of the SS 90 % catalyst can be seen in Fig. 6. The morphology of the catalyst material is in the form of small chunks aggregated with each other with a smooth surface. The image can strengthen the results of surface area analyzer (SAA) analysis by showing that the material has a large surface area, which is a favorable property because it can make it easier for reactants to diffuse and access the catalyst’s active sites. The contribution of sulfate ions, which are highly charged ions on the silica surface, makes the image of the silica surface look bright after being shot with electrons.
3.7. RSM analysis
Table 5 shows the response variable, which is the amount of benzene that is nitrated to nitrobenzene from the treatment of the three independent variables for data processing using Minitab 16. The data processing will determine the optimum point to be analyzed in contour and response surface plots.
Table 5.
Nitrobenzene yields results with a three-variable CCD response surface methodology.
Furthermore, the significance test was carried out using analysis of variance (ANOVA), which aims to obtain the effect of the response interaction (nitrobenzene yield) on the three independent variables. The data generated will be able to know the significant effect of the p-value less than 0.050 or 95 % confidence level, which means the effect is substantial. The hypothesis (H0) used is that the independent variable does not affect the response variable, while the hypothesis (H1) used is that the independent variable has an effect. The results of the significance test on ANOVA testing of nitrobenzene synthesis are presented in Table 6.
Table 6.
ANOVA test results with second-order model.
Table 6 shows the p-value is less than 0.05, which states that variables X1, X2, and X3 significantly affect the response variable of nitrobenzene yield produced. The p-value for variable X1 (sulfuric acid concentration on the silica) is 0.001; X2 (stirring time) is 0.004; and X3 (reaction temperature) is 0.015. The p-value for the lack-of-fit test is 0.395 or greater than the degree of significance ∝ = 0.050, so there is no reason to reject H0. This means the regression model fits.24) An insignificant lack of fit value is a requirement for a good model because it indicates the suitability of the response data with the model.25)
In the ANOVA test results, there is a coefficient of determination (R2) value of 0.8588, indicating that the influence of the independent variables that have been modeled affects the response value of the amount of nitrobenzene by 86 %. In comparison, the remaining 14 % is likely to be influenced by variables outside the independent variables that are not studied or outside the regression equation. The adjusted R2 value of 0.7317 or 73 % shows the relationship between the independent variables of sulfuric acid concentration in the catalyst (X1), stirring time (X2), and reaction temperature (X3).
The resulting model in Table 6 is a regression model that shows the relationship of the three independent variables to the response. The equation of the model is presented in the following Eq. (3).
where, Y is nitrobenzene yield (%), X1 is sulfuric acid concentration on the silica (%), X2 is stirring time (min), X3 is reaction temperature (°C).
The correlation test can be used to determine the relationship between variables through the approach. This study determined the relationship of the three variables (X) to the amount of nitrobenzene produced (Y). The value of the correlation coefficient (r) has a value range of -1 to +1. The results of the correlation test of the independent variables on the amount of nitrobenzene are presented in Table 7.
Table 7.
Correlation of three variables to the response.
| Variable | Correlation coefficient (r) |
| Sulfuric acid concentration on the silica (%) | 0.579 |
| Stirring time (min) | 0.440 |
| Reaction time (°C) | 0.349 |
Four levels express the strength of the correlation value, i.e. no correlation (0~0.090), weak (0.1~0.250), strong (0.260~0.490), and very strong (0.500~1). Thus, Table 6 shows that the concentration variable has a strong correlation level, while the stirring time and reaction temperature correlate very strongly.
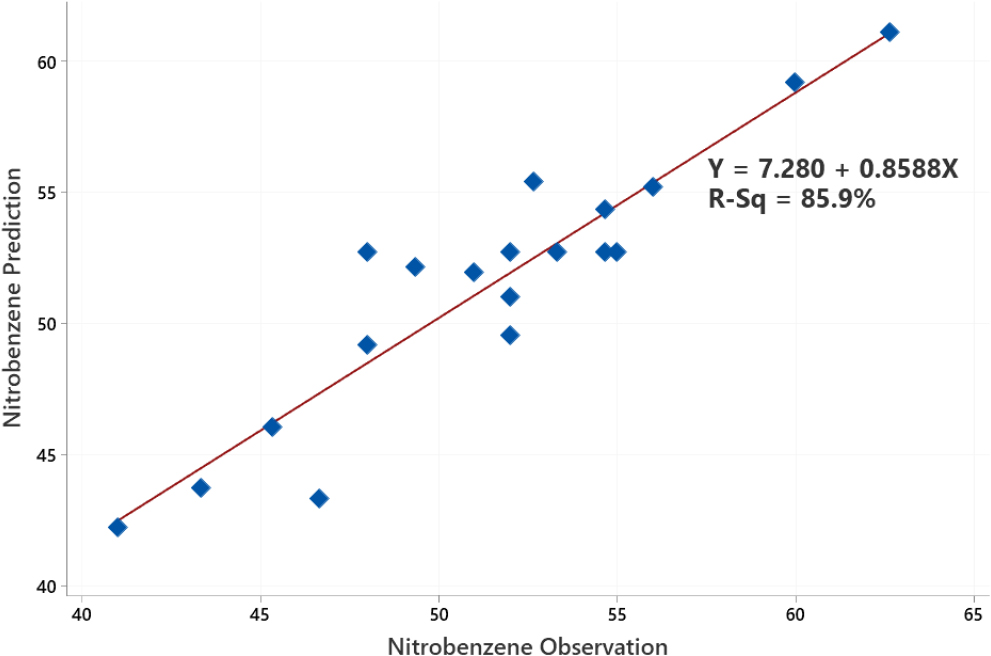
In Fig. 7, the coefficient of determination is 0.8588, which shows that the confidence level of the observation data on the prediction data is 85.9 %. The positive sign on the coefficient of determination indicates a linear relationship between the variable and the response variable. There is a data error of 14.1 % caused by factors that are not considered in this study.
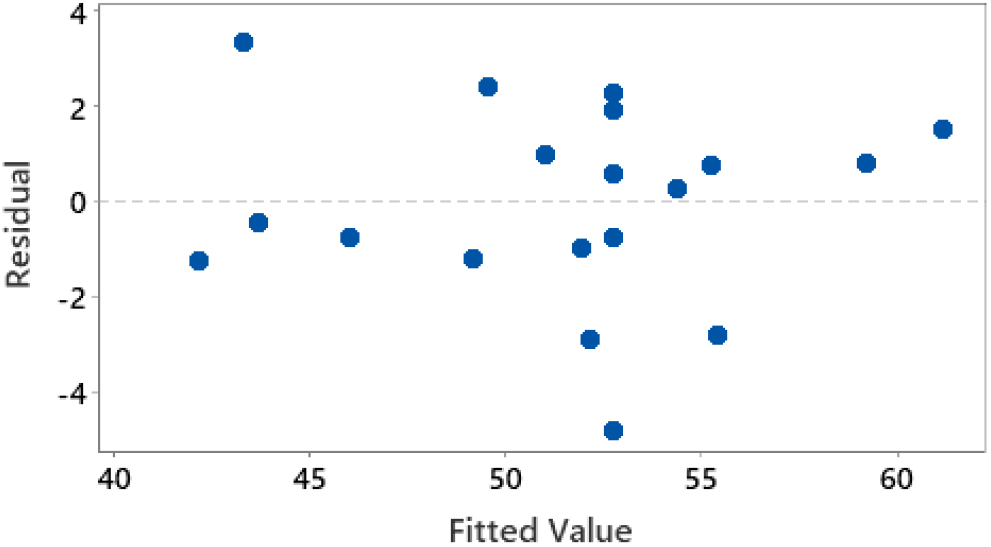
In Fig. 8, it can be observed that the distribution of residue to the amount of nitrobenzene is randomly distributed. The random scheme is shown by the relationship between the residual value and the amount of nitrobenzene in Fig. 8, which does not form a specific pattern. The more random the distribution pattern that occurs, the more the assumption of identical residuals is fulfilled, so it can be said that the assumption of identical residuals is fulfilled.
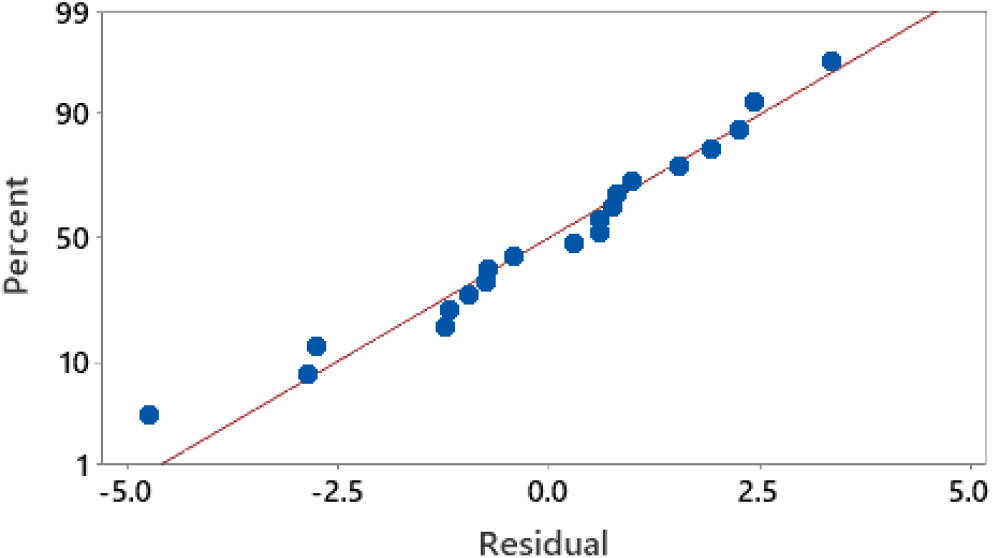
The normal distribution test is carried out to determine the deviation of the model obtained in Eq. (3). In Fig. 9, it can be observed that the residual points formed are close to the linearity line. The more the residual issues approach the straight line of linearity, the more normally distributed the residuals formed. This shows that the residual normality test has followed a normal distribution. Normally distributed means that there is no deviation from the resulting analysis results.
Surface response characteristics analysis was conducted to determine the interaction of sulfuric acid concentration on the silica (X1), stirring time (X2), and reaction temperature (X3) to produce the optimum amount of nitrobenzene. The optimal condition for the three variables is at the central point coordinate, where the maximum slope is close to zero. The data processing results for the surface response program of variables X1 and X3 resulted in contour graphs and surface plots, as presented in Fig. 10.
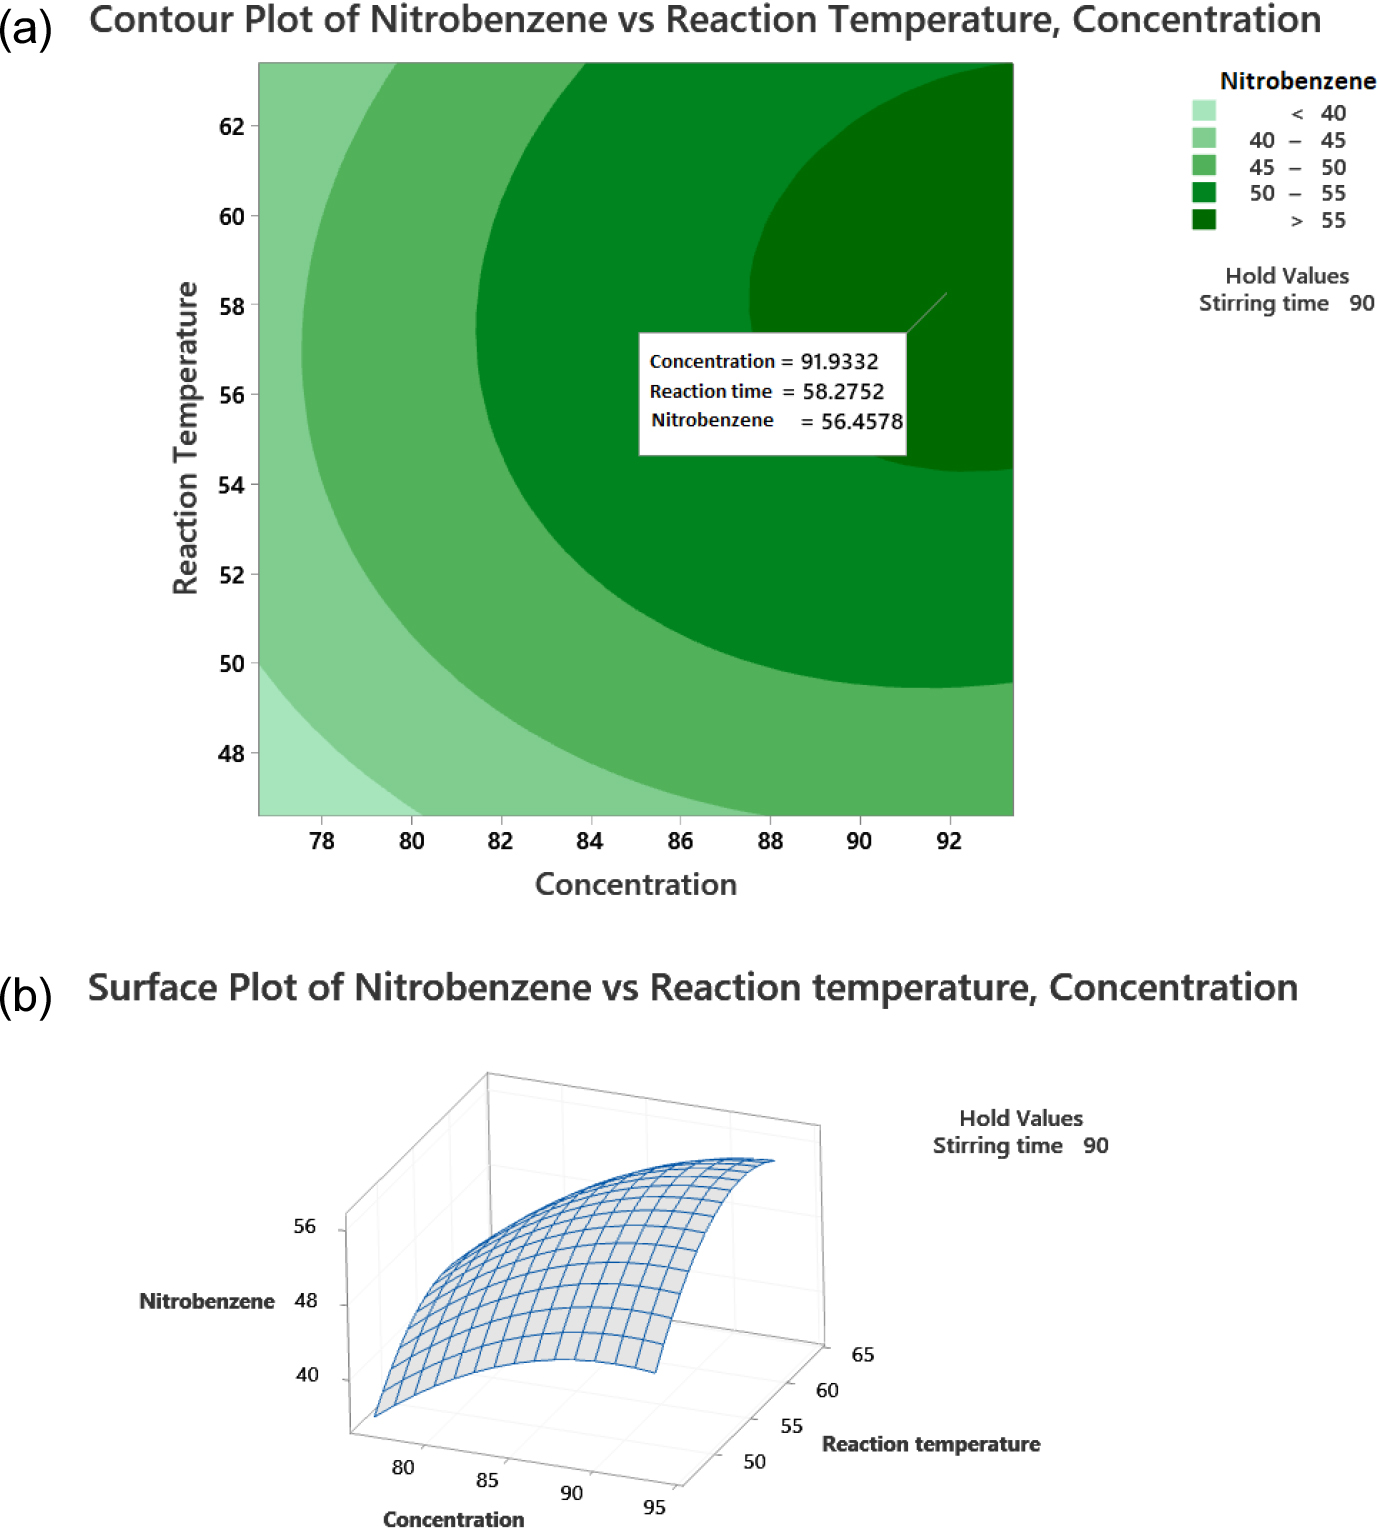
Fig. 10 shows the effect of reaction temperature (X3) and sulfuric acid concentration on the silica (X1) on the amount of nitrobenzene. In the contour plot shown in Fig. 10(a), color variations that described nitrobenzene yield for combining the two variables were generated. The optimum nitrobenzene yield response was indicated by the dark green region. The highest response value of the amount of nitrobenzene will be obtained with a sulfuric acid concentration on the silica of 91.93 % and a reaction temperature of 58.27 °C. The optimal value is shown in the surface plot in Fig. 10(b), a three-dimensional curve. Variable reaction temperature (X3) and sulfuric acid concentration on the silica (X1) affect the amount of nitrobenzene produced with an optimum response value of 56.46 %.
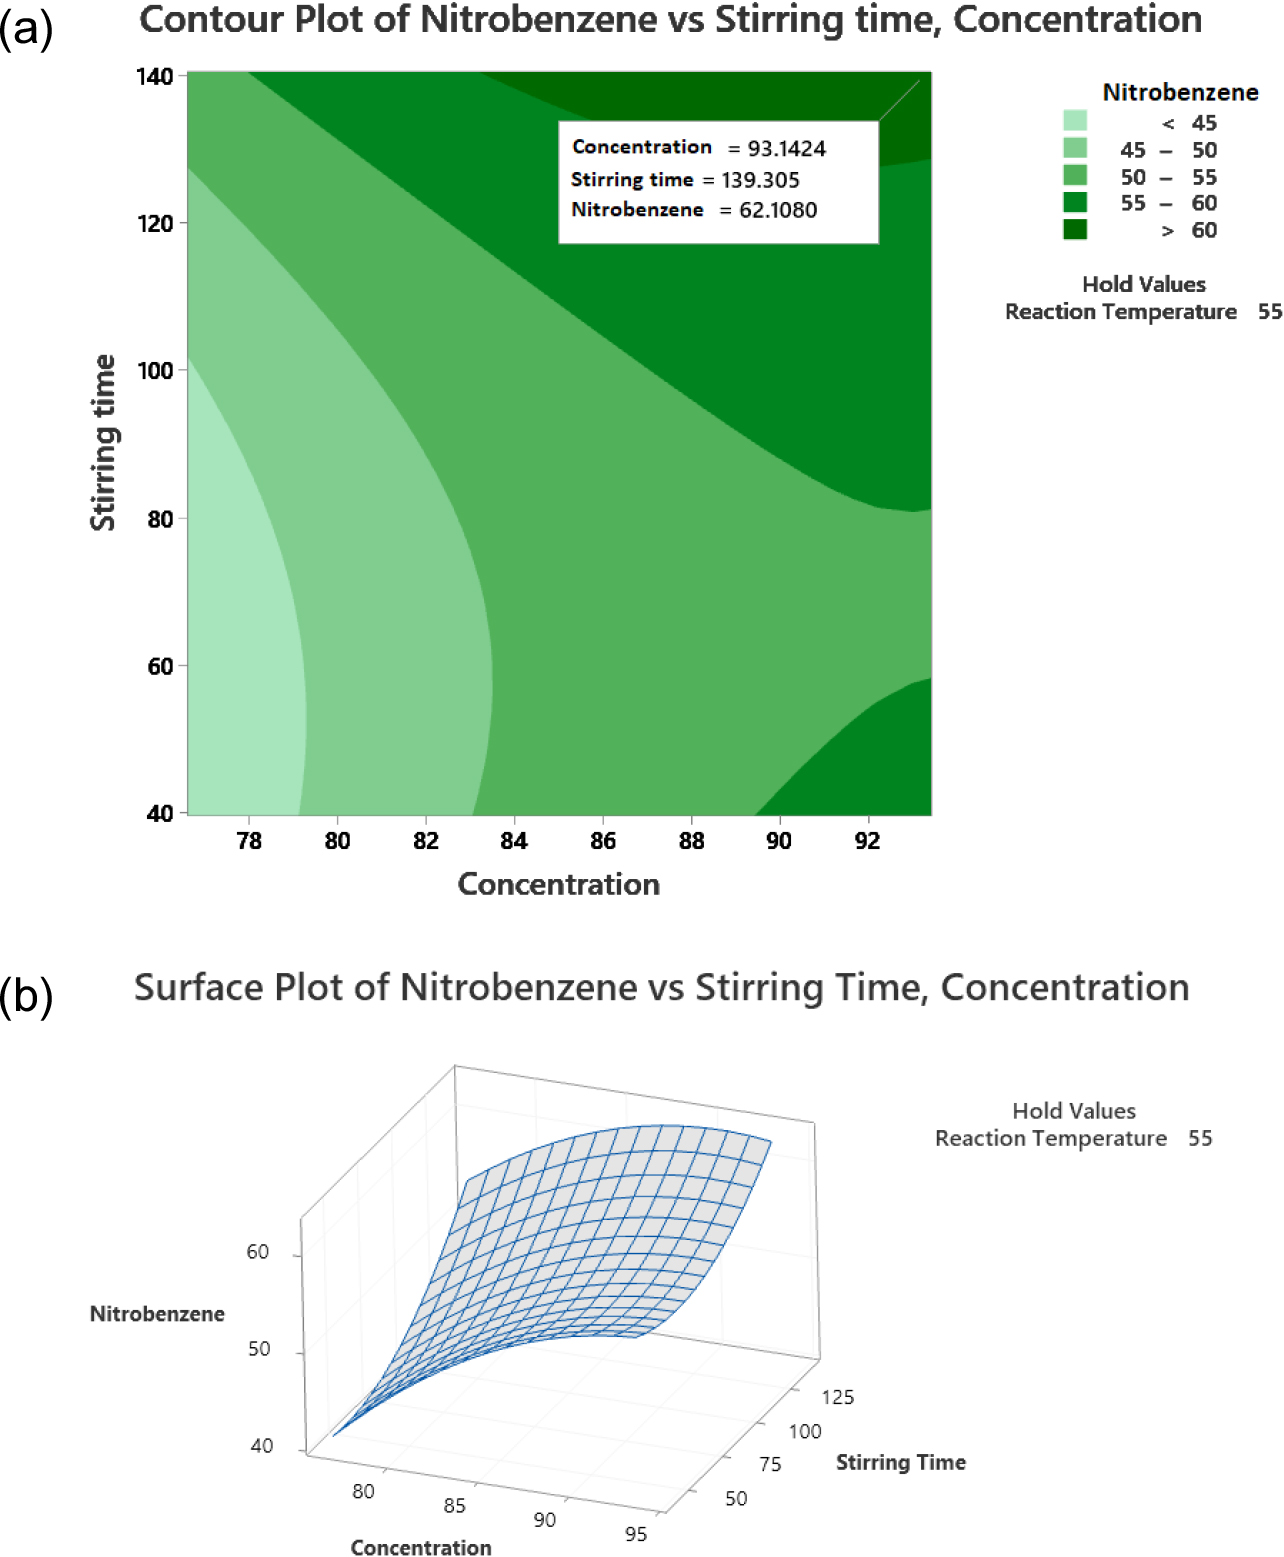
The data processing results for the surface response program of variables X1 and X2 resulted in contour graphs and surface plots, as presented in Fig. 11. The optimum nitrobenzene amount response is in dark green with an area >60 %. Based on Fig. 11, at a sulfuric acid concentration on the silica of 93.14 % and a stirring time of 139.30 min, the highest nitrobenzene amount response value of 62.11 % will be obtained.
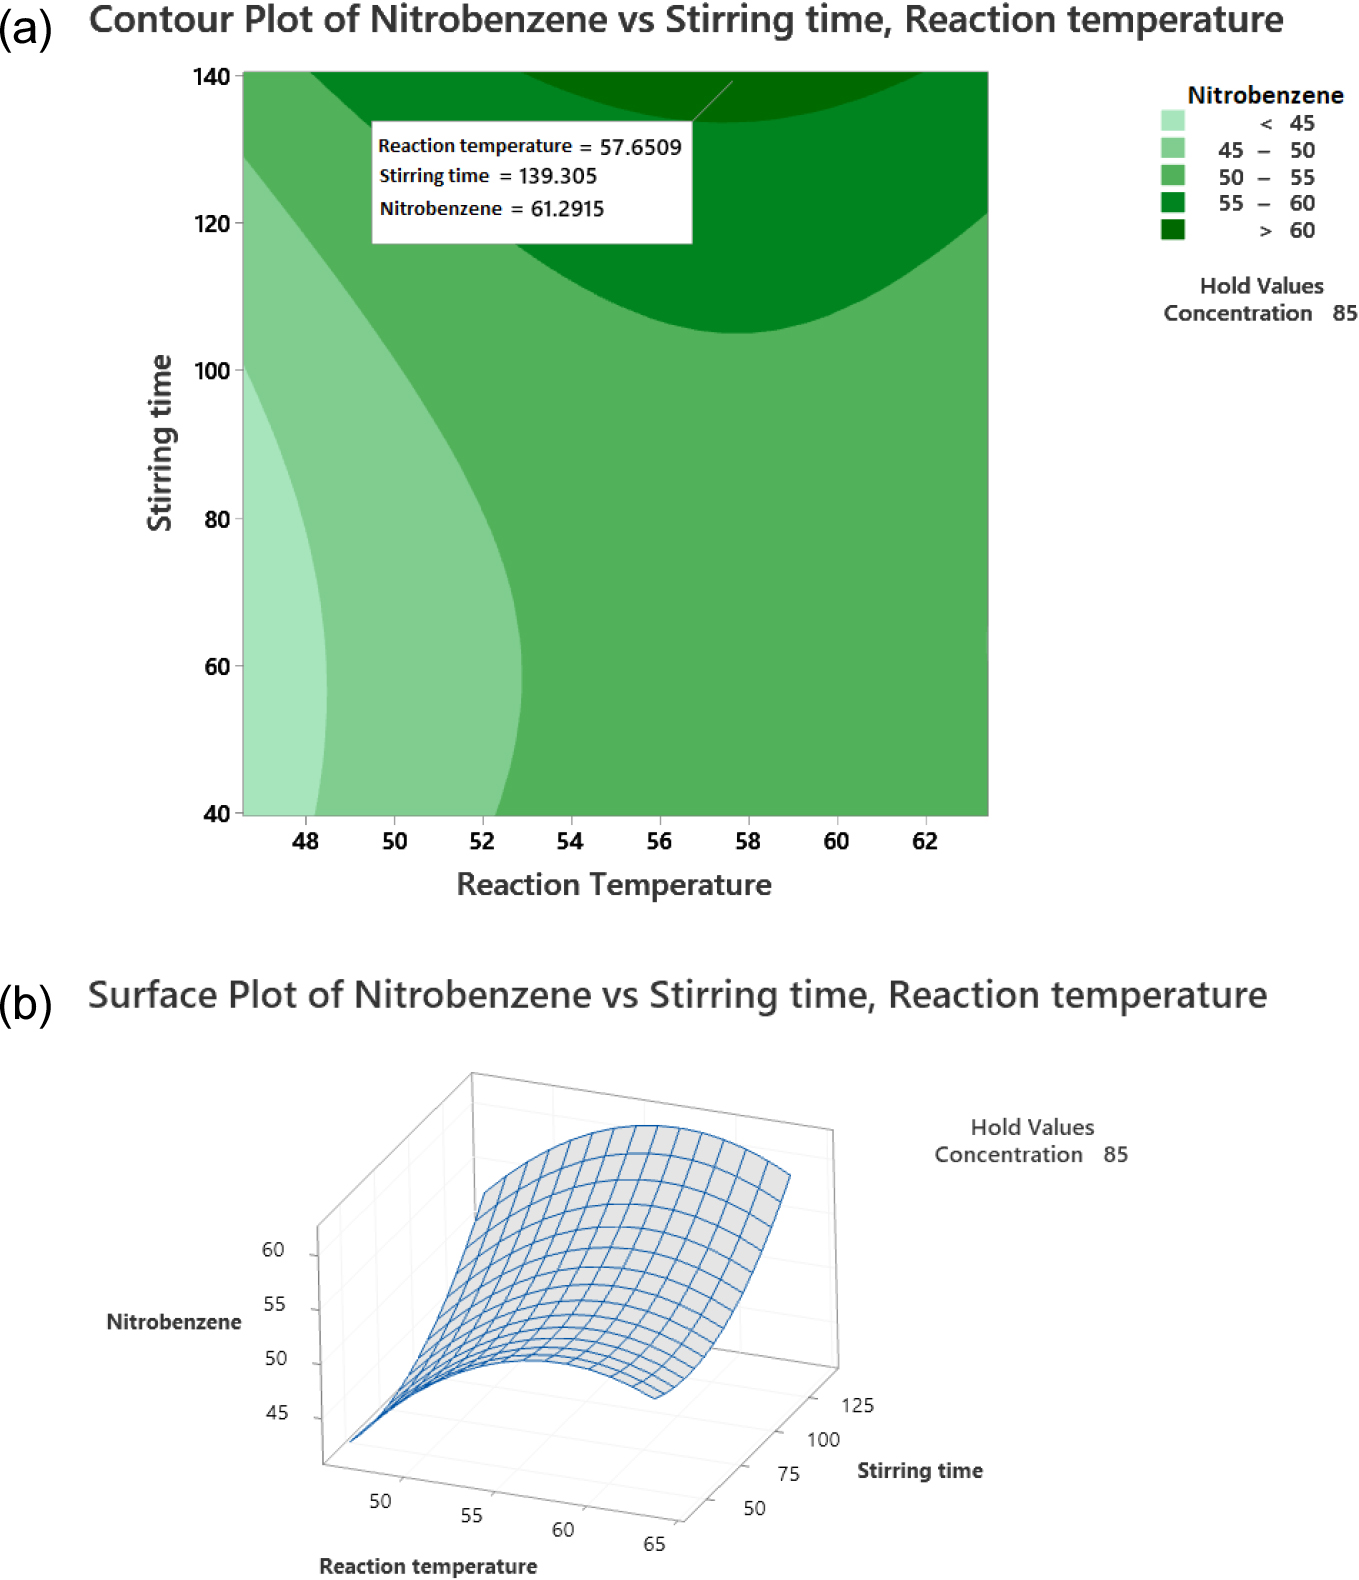
In Fig. 12, it can be observed that there is an influence between the variables of stirring time (X2) and reaction temperature (X3) on nitrobenzene yield. The highest nitrobenzene yield of 61.29 % will be obtained in the benzene nitration reaction with a stirring time of 139.30 min and a reaction temperature of 57.65 °C. Furthermore, the responses of the three images of the optimum contour plot and surface plot were optimized with the optimum plot determined using Minitab 16, the results of which are shown in Fig. 13.
The optimization plot in Fig. 13 shows that the nitrobenzene yield will be optimum at 63.38 %. From this value, the optimum condition for variable X1 is 91.20 %, variable X2 is 140.45 min, and variable X3 is 58.14 °C. The optimization plot also shows the value of the desirability function (d) obtained on a scale of 1.00. A scale of 1.00~0.80 indicates a very good number which means that the experimental data for the response variable of this study is accepted.26)
3.6. Benzene nitration reaction study over SO4/SiO2 catalyst
In the benzene nitration process, nitric acid is made more than the benzene ratio in benzene nitration.27) This is to keep the availability of nitronium cations as active electrophile sites that will carry out their duties in the electrophilic substitution reaction to benzene. The presence of hydrogen in the silanol group on the SO4/SiO2 catalyst as a Bronsted acid site can replace the role of sulfuric acid in assisting the formation of nitronium cations. The existence of sulfate groups on the silica polymer chain causes a more significant number of Bronsted acid sites, directly increasing the number of nitronium cations formed.28) The formation of nitronium cations assisted by SO4/SiO2 catalyst is schematically shown in Fig. 14.
In this study, the synthesis of nitrobenzene was carried out in a batch microwave reactor. This microwave aims to shorten the time and set the right temperature when the reaction occurs. The use of microwave activation in organic synthesis has become a standard tool for organic chemists due to increased reaction rates, higher yields, and increased selectivity.29,30,31) The most crucial advantage of microwave-enhanced chemistry is the reduction in reaction time. Reactions that require hours or days under conventional heating can often be achieved in a few minutes under microwave heating. In addition, responses are faster, proceed with higher purity, and obtain higher yields.32) Microwave-assisted nitration will provide lower activation energy and higher reaction rates than conventional processes.33) Microwave-assisted reactions are further considered clean and safe.
Besides producing nitrobenzene, nitrobenzene synthesis can also form other organic compounds by-products, such as m-dinitrobenzene, p-dinitrobenzene, and nitrophenol. The selectivity of the SO4/SiO2 catalyst used in the reaction can be known from the results of GC-MS analysis of nitrobenzene products produced. From the results of GC-MS analysis, all nitrobenzene products from 20 experiments produced one chromatogram peak at a retention time of about 13 min, which indicated that only one 100 % pure nitrobenzene product was formed without any mixture of other organic compounds. Thus, it can be concluded that sulfated silica catalyst is selective in converting benzene to nitrobenzene. The development of this catalyst can be used as an alternative solution to reduce the use of sulfuric acid catalysts in the industry to achieve a more green and environmentally friendly nitrobenzene industry and its downstream products.
4. Conclusion
Applying RSM with 3 CCD variables determined the optimum conditions for synthesizing nitrobenzene in a batch microwave reactor with the presence of a selective-sulfated silica catalyst (SO4/SiO2). The nitrobenzene yield response variable has an optimum value of 63.38 %. Based on the results, the optimum yield can be obtained using sulfated silica catalyst synthesized using H2SO4 with a concentration (X1) of 91.20 %, stirring time (X2) of 140.46 min, and reaction temperature (X3) of 58.14 °C. With these optimum conditions, nitrobenzene, an essential ingredient of paracetamol, can be synthesized in green chemistry by replacing the role of a homogeneous sulfuric acid catalyst without conventional heating.
