

1. Introduction
Over the past 20 years, LED phosphors have been dramatically developed, and mainly shifted from earlystage phosphors of YAG:Ce3+ (Y3Al5O12)-based oxidebased phosphors1) to later-stage phosphors of nitridebased phosphors such as beta-SAIALON (Sr6-xAlxOxN8-x: Eu2+)2) and CASN(CaAlSiN3:Eu2+)3) phosphors. Recently, phosphors of various compositions, including fluoridebased materials called KSF or PSK (K2SiF6),4,5) have been developed and commercialized. There is a precedent that a large number of novel phosphors have been developed, and attracted the attention of academia and industry, in addition to the above-mentioned commercially available phosphors, which are currently in the spotlight.6-24) For example, advanced phosphors have been developing, including not only SLA (SrLiAl3N4:Eu2+) nitride phosphors25) of the Schnick Group at University of Munich, Germany, but also LCSON (La4-xCaxSi12O3+xN18-x: Eu2+) oxynitride phosphors26) developed by Park et al., in South Korea.8,10-12,14,26-34) In this context, another oxynitride phosphor, PS-SALON (Y6+x/3Si11−yAlyN20+x−yO1−x+y), recently developed by Park et al.,32) is attracting attention. Schnick et al. recently reported a paper in which PSSALON was re-examined, and based on this report, we tried to study in depth how the existing PS-SALON phosphor evolves by doping (or substitution) with a third element in this paper.
For this goal, a Ca element was first designated to allow a Y element to be substituted, and the resulting structural and optical behaviors were investigated. Generally, most oxynitrides are generously allowed for substitution of heterogeneous elements with different oxidation numbers. It has been reported that this is possible because the fractions of oxygen and nitrogen, which are anions with different oxidation numbers, change organically according to the substitution of cations.8,10-12,14,26-34) A Y6-xCa1.5xSi11N20O:Ce3+phosphor does not have a structure in which the structural safety is ensured by the ratio of such anions, but has an interesting structure in which a partially vacant site is originally present and balance is achieved by entering of a bivalent Ca2+ element to occupy the 2c site. As such, the performance adjustment by element substitution in phosphors has already been made very extensively in various phosphor systems, and as a familiar example, it should be noted that orthosilicate-based phosphors, which have the limelight in the past and in which a wide range of alkaline earth metal ions have been substituted, have been commercialized, and also noted that TAG (Tb3Al5O12) and LuAG (Lu3Al5O12), etc. which have been widely used in recent years, are also substituted products derived from the existing YAG phosphor.
Therefore, in this paper, we observed changes in luminescence and excitation energy as well as changes in crystal structure by systematically substituting Ca elements based on the PS-SALON phosphors in which existing Al element is excluded, and furthermore the ab initio calculation was used to provide a theoretical background, and detailed observation of a structure by Rietveld refinement was also conducted. In addition, comparative evaluation of the luminescence intensity compared with that of the conventional YAG (P-46) phosphor was carried out to highly reliably evaluate the actual luminescence performance. Meanwhile, to improve the performance, a solid phase synthesis method was optimized first, and subsequent high-quality-grade analysis was conducted to aid the understanding of the PS-SALON phosphor substituted with Ca.
2. Experimental Procedure
Using raw materials YN (Materion, 99.9 %), Ca3N2 (Sigma Aldrich, 95 %), α-Si3N4 (Sigma Aldrich, unreported), and CeO2 (High Purity, 99.99 %), five samples were quantified according to the stoichiometry in a Glove box (O2 < 1 ppm, H2O < 1 ppm) without air exposure to satisfy the specified formula, Y6-xCa1.5xSi11N20O:Ce3+ (x = 0, 0.5, 1.5, 2 and 2.5). After quantification, mixing and pulverization were performed, and 0.75 g of each sample was put into different holes of a BN container which was self-designed and made (18 holes of 8 cm wide, 4 cm long, 2 cm high, and 1 cm in diameter). Thereafter, the BN container was moved to a tube heat treatment system without being exposed to air as much as possible, and fired at 1,750 °C for 4 h at a heating rate of 5 °C per minute in a mixed gas atmosphere of 5% H2 and 95% N2. Each of the fired sample was pulverized and then subjected to X-ray diffraction (XRD) and photoluminescence (PL) analysis. The emission wavelengths were measured at an excitation wavelength of 400 nm using a continuouswave (CW) PL system equipped with a self-made xenon lamp. For XRD, Cu-Kα radiation was used, and a Rigaku Miniflex 600 equipped with a 1D silicon strip detector for high-speed and high-resolution scanning operating at 600 watts (X-ray) was used.
3. Results and Discussion
According to the experimental method, six phosphor samples were synthesized to satisfy the specified formula, Y6-xCa1.5xSi11N20O:Ce3+ (x = 0, 0.5, 1, 1.5, 2, and 2.5), and six additional samples (x = 3, 3.5, 4, 4.5, 5, and 5.5) were synthesized to observe structural changes according to the substitution ratio of Ca elements. XRD were measured for structural analysis of the synthesized samples, and the measured XRD patterns were analyzed.
Fig. 1 shows XRD patterns according to Ca substitution and impurity XRD patterns in a Y6-xCa1.5xSi11N20O:Ce3+ (x = 0-5.5) structure. In Fig. 1, it was observed from the XRD patterns that an Y2Si3O3N4 impurity was generated when x indicating the Ca element ratio was 1 or less, and the amount of Y2Si3O3N4 impurity decreased as the amount of Ca increased. It was believed that why such Y2Si3O3N4 impurity was generated was because the sample was exposed to air for a short period of time before entering a heating furnace, although the raw material reagents were quantified in the glove box in which there was no air contact. However, experimentally, the Y2Si3O3N4 impurity was disappeared as the amount of Ca element which is susceptible to nitrification in a N2 atmosphere was increased. In contrast, a Ca2Si5N8 structure, which is well known as a red phosphor, started being generated when x was 3, where the Ca ratio is high. Afterwards, we measured PL for the case when x, which is the Ca ratio, was 2.5 or less, and experiment on the Ce3+ concentration was performed at the Ca ratio with the strongest luminescence intensity.
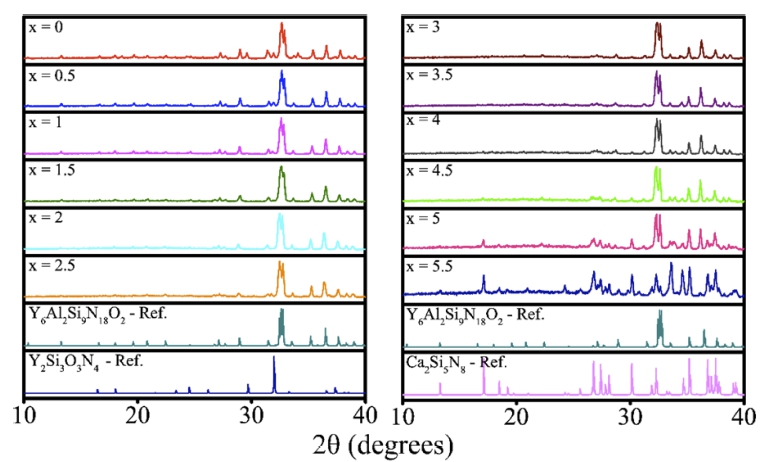
Fig. 1
XRD patterns according to Ca substitution and impurity XRD patterns in Y6-xCa1.5xSi11N20O:Ce3+ (x = 0 ~ 5.5) structure.
Fig. 2 shows excitation and emission PL measured according to x, which represents the Ca element ratio in formula Y6-xCa1.5xSi11N20O:Ce3+ (x = 0, 0.5, 1, 1.5, 2, and 2.5). In [Fig. 2(a)] showing the excitation PL of Y6 -xCa1.5xSi11N20O:Ce3+ (x = 0, 0.5, 1, 1.5, 2, and 2.5), two PLs are observed at 400 nm and 470 nm. This is because the 5d1 band of a Ce3+ activator is separated into Eg and T2g by a crystal field, and the 400 nm and 470 nm in [Fig. 2(a)] respectively correspond to the excitation bands Eg and T2g of the Ce3+ activator. In addition, the emission wavelength at 400-nm excitation was measured, and the excitation was measured based on the center wavelength, as shown in [Fig. 2(b)]. When x, which indicates the Ca element ratio, was 0, 0.5, 1, 1.5, 2, and 2.5, the center wavelengths thereof were 562, 560, 567, 571, 570, and 565 nm, respectively. Furthermore, it was confirmed that as the amount of Ca elements increased, the PL intensity increased, and it was also confirmed that the luminescence intensity was 1.8 times higher than that of PL having the lowest luminescence intensity. This can be seen in [Fig. 2(b)]. As shown in [Fig. 2(c)], observing the wavelength changes through normalized PL demonstrated that the center wavelength shifted slightly to a short-wavelength side as the Ca element ratio increased. However, when the Ca element ratio was 1 or less, the analysis of changes in the center wavelength is meaningless due to light emission by the Y2Si3O3N4 impurity. It was assumed that why the center wavelength shifted to the shortwavelength side is because the site where the Ce3+ activator was substituted was changed. The structure in which the larger Ca (VI = 1 Å) element was substituted in the Y (VI = 0.9 Å) element site can be more easily substituted with the Ce3+ activator than the conventional structure so that the crystal field effect was reduced, and thus the center wavelength shifted more to a short-wavelength side than that of the conventional structure. It was confirmed that the PL emitted by the Y2Si3O3N4 impurity was disappeared as the amount of the Ca element increased, which was consistent with the XRD pattern analysis. As such, we confirmed that the optimal Ca element was when x was 2.5 through the experiment, and five samples were synthesized according to the Ce3+ concentration (0.5, 1, 2, 4, and 8 %) in Y6-xCa1.5xSi11N20O: Ce3+(x = 2.5) composition which had the optimal Ca ratio.
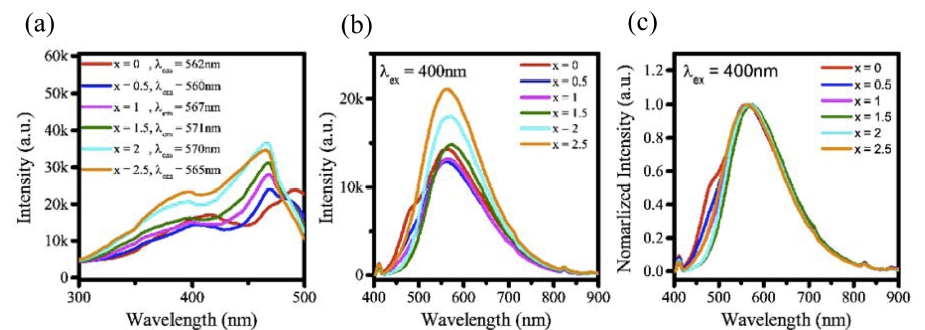
Fig. 2
(a) Analysis results of an excitation photoluminescence. (b) emission photoluminescence, and (c) normalized emission photoluminescence according to Ca substitution in Y6-xCa1.5xSi11N20O:Ce3+ (x=0~ 2.5) structure.
Fig. 3 shows emission PL according to Ce3+ concentration (0.5, 1, 2, 4, and 8 %) in Y6-xCa1.5xSi11N20O:Ce3+ (x = 2.5) composition. As shown in [Fig. 3(b)] (small box), a Y6-xCa1.5xSi11N20O:Ce3+ phosphor exhibited a broader emission wavelength than a YAG:Ce3+ phosphor at 400 nm excitation, indicating that the Y6-xCa1.5xSi11N20O:Ce3+ phosphor is more advantageous than the YAG:Ce3+ phosphor in implementing white light for a 1pc-LED. As shown in [Fig. 3(a)], the Ce3+ activator concentration experiment showed that luminescence intensity increased up to 1 % concentration, and the strongest luminescence intensity was shown at 1 % concentration. Concentration quenching was observed with a concentration of 1 % or more. Referring to the concentration quenching according to Ce3+ activator concentration in [Fig. 3(a)] (small box), it was believed that the optimal Ce3+ activator concentration for Y6-xCa1.5xSi11N20O:Ce3+ (x = 2.5) composition would be existed at a concentration of 1 to 2 %. In addition, normalized PL was shown as in [Fig. 3(b)] to see the change of PL according to the Ce3+ activator concentration, and analyzed. As the Ce3+ activator concentration increased, a distinct red shift was observed. This can be seen in [Fig. 3(b)]. Although the Y element and the Ca element partially share and occupy the site in Y6-xCa1.5xSi11N20O structure, the they are smaller than a Ce3+ activator on average, and thus the doping of the large-sized Ce3+ activator caused distortion of the surrounding lattice and increased intensity of the crystal field. Rietveld refinement was performed on Y6-xCa1.5xSi11N20O:Ce3+(x = 2.5) optimal composition to aid the understanding of the lattice distortion.
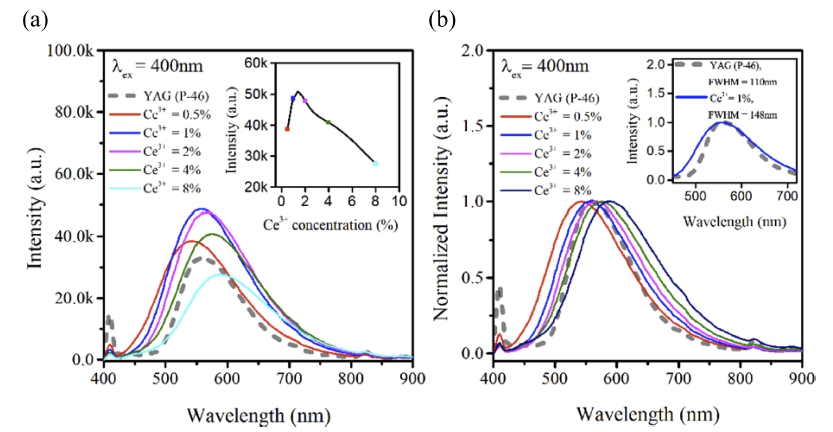
Fig. 3
(a) Emission PL, and (b) Normalized emission PL according to Ce3+ concentration (0.5, 1, 2, 4, and 8%) in Y6-xCa1.5xSi11N20O:Ce3+ (x = 2.5) composition.
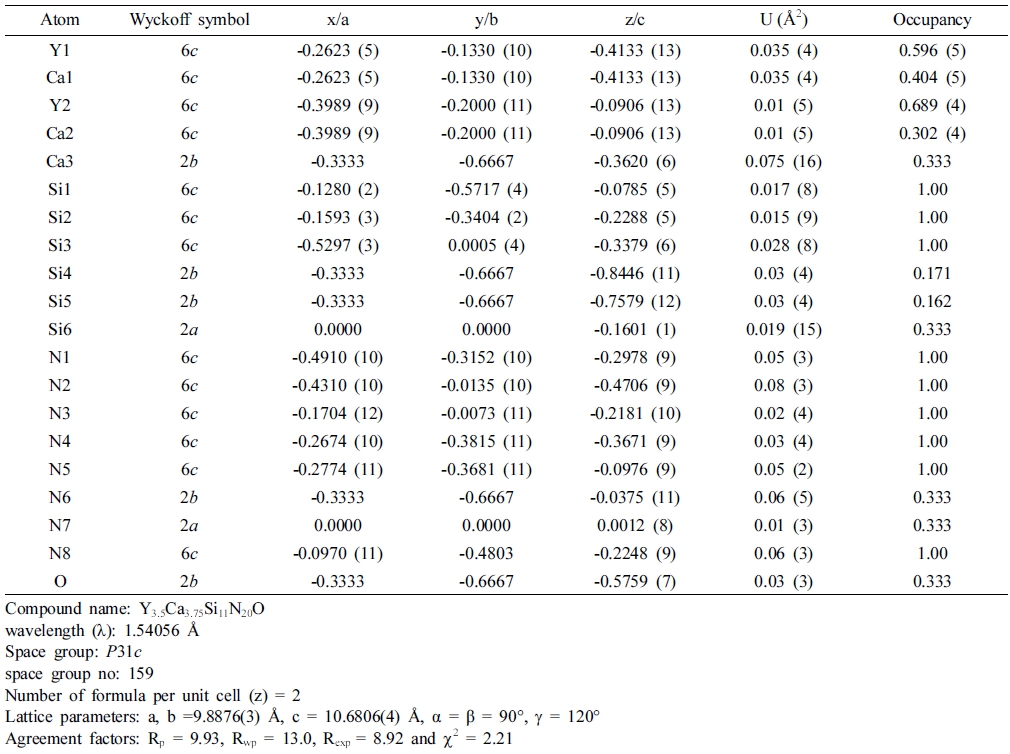
Fig. 4(a) shows the results of Rietveld refinement on the XRD patterns for the optimal composition of Y6-xCa1.5xSi11N20O:Ce3+ (x = 2.5) having a trigonal crystal system that has a P31c (no.159) space group. We performed Rietveld refinement by selecting the optimal composition of Y6-xCa1.5xSi11N20O:Ce3+ (x = 2.5) among a series with various x values. This was selected because Y6-xCa1.5xSi11N20O:Ce3+ (x = 2.5) composition exhibited the strongest luminescence intensity, and no impurities were found in the XRD pattern analysis. Rietveld refinement results are shown in Table 1. The lattice parameters according to Rietveld refinement were a = 9.8876(3) Å, c = 10.6806(4) Å, α = β = 90°, and γ = 120°. In addition, agreement factor values which represent Rietveld refinement result are Rp = 9.93, Rwp = 13.0, Rexp = 8.92, and χ 2 = 2.21. This analysis result showed that lattice parameters were slight larger than those of the conventional PSSAION, which was caused by the substitution of the large-sized Ca (VI = 1 Å) element in the site of Y (VI = 0.9 Å). This results were consistent with the emission PL results, and density function theory (DFT) calculation was additionally performed to verify these crystallographic analysis results.
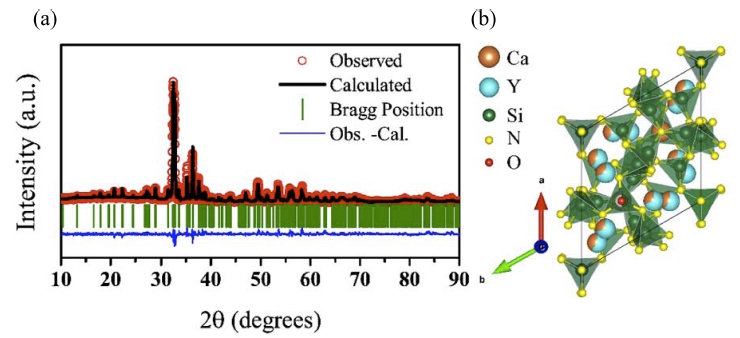
Fig. 4
(a) Rietveld analysis on Y6-xCa1.5xSi11N20O:Ce3+(x=2.5) composition. (b) Crystal structure of on Y6-xCa1.5xSi11N20O:Ce3+ (x = 2.5).
Table 1
Atomic Coordinates, Thermal Factors, Occupancy, and Fitting Quality Factors Obtained after the Rietveld Refinement.
 |
An input model structure for the DFT calculation constructed by using the crystal structure information obtained from the Rietveld results. For the DFT calculation, Perdew, Burke and Ernzerhof (PBE)35) revised GGA in Vienna ab initio simulation package (VASP 5.4)36-39) was applied as exchange-correlation functional term, and MonkhorstPack method was used for k-mesh sampling. In addition, in all calculations, cut-off energy was 500 eV and total energy convergence was 10−5 eV, and the force applied to individual atoms was minimized to 0.02 or less eV/Å. In consideration of the lattice parameters, 2 × 2 × 2 k-mesh was used for the K-mesh to approximate the cubic shape.40) Furthermore, the most commonly used projector augmented wave (PAW) pseudopotential was employed for each element.41,42) Structural relaxation caused all values for atomic coordinates, lattice parameters, and symmetry to change. After completing the structural relaxation, a band structure and a density of state (DOS) was calculated to determine a band gap value.39) In addition, to compare the band gap values resulting from the DFT calculation, a sample without Ce activator in the optimal composition of Y6-xCa1.5xSi11N20O:Ce3+(x=2.5) was prepared to measure diffuse reflectance spectrum.
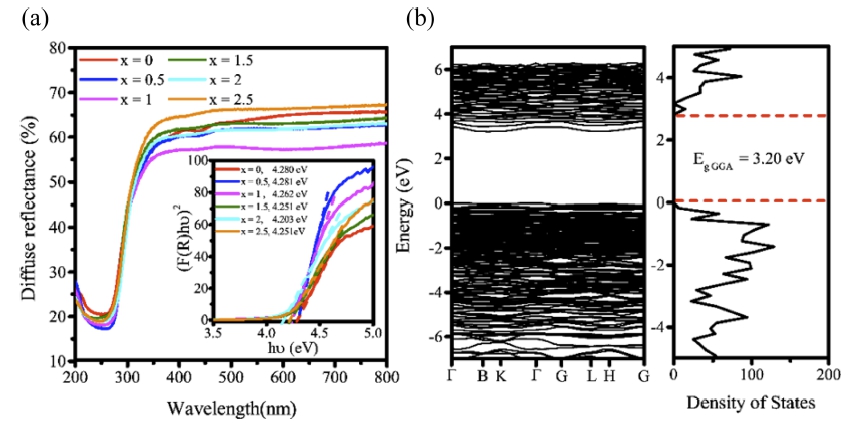
[Fig. 5(a)] is a diffuse reflectance spectrum representing the optical band gap energy in various compositions of Y6-xCa1.5xSi11N20O:Ce3+ (x = 0 - 2.5), and 5b is a band structure and density of state (DOS), which exhibits the calculated band gap energy in the optimal composition of Y6-xCa1.5xSi11N20O:Ce3+ (x = 2.5). The optical band gap energy values were calculated using the measured diffuse reflectance spectrum, and the result value for the optimal composition of Y6-xCa1.5xSi11N20O:Ce3+ (x = 2.5) was 4.25 eV. In addition, the calculated band gap energy value obtained through the DFT calculation was 3.20 eV. These experimental values and calculated values are different because there is a problem in the DFT calculation. In general, the band gap energy calculated using GGA-PBE is lower than the experimental value, and corrected through several methods. Among them, a HSE06 calculation is representative. However, the HSE06 calculation has the disadvantage of taking a long time. Instead of directly executing this HSE06 calculation, we substituted our calculation result values into the research result of Lee et al.43) and confirmed that the band gap energy value was 4.13 eV. It was confirmed that these results were slightly lower than the optical band gap energy value obtained through the experiment. Therefore, it was confirmed that there was no abnormality in DFT calculation result performed to verify the structure in this study.
4. Conclusion
This study is an experimental result of systematic substitution of Ca elements based on the PS-SALON phosphors in which existing Al element is excluded. Changes in luminescence and excitation energy caused by this substitution of Ca element were analyzed, and the optimal composition of Y6-xCa1.5xSi11N20O:Ce3+ (x = 2.5) was examined. In addition, we confirmed that the optimal Ce3+ activator concentration was 1% through the doping experiment according to the Ce3+ activator concentration, and the red shift was observed as the concentration increased. Rietveld refinement was performed on the optimal composition of Y6-xCa1.5xSi11N20O:Ce3+ (x = 2.5) to analyze the red shift due to the crystal field effect, and the DFT calculation was performed to confirm the structural analysis, and the result was consistent with the experimental values. In conclusion, Y6-xCa1.5xSi11N20O: Ce3+ (x = 2.5) phosphor has a broad emission band due to Ce3+ as an activator with the center wavelength of 565 nm. It was also confirmed this phosphor has a broader emission band than YAG:Ce3+ phosphor, which is a representative LED phosphor. Accordingly, the possibility of 1pc-LED with an improved color rendering index due to the broader emission band.
