

1. Introduction
2. Experimental Procedure
2.1. Materials
2.2. Catechin extraction
2.3. HPLC analysis of extracted catechin
2.4. Patch fabrication
2.5. Release of catechin
2.6. Measurement of contact angle
2.7. Cell responses
3. Results and Discussion
3.1. Confirmation of extracted catechins
3.2. Fabrication of chitosan patches
3.3. Measurement of contact angle
3.4. Behavior of catechin release
3.5. Cell responses
4. Conclusions
1. Introduction
Wound healing is an essential and complex process. In cases of severe damage, recovery can be challenging, and the regeneration of normal skin structure is often difficult, even after healing has occurred.1,2,3) Consequently, there are ongoing efforts to develop artificial skin and drug delivery patches using polymers to overcome these challenges. Notably, research on bio-patches for functional wound healing and drug delivery, utilizing chitosan (CHT) as a key component, is quite active.4)
Chitosan (CHT) is a naturally derived polymer produced by deacetylating chitin, a polymer composed of glucosamine and N-acetylglucosamine units. It possesses excellent characteristics, such as elasticity and biocompatibility, along with functions like hemostasis, antimicrobial activity, and tissue repair, making it advantageous for wound healing. Its non-toxicity and ease of use in solution due to amino groups also contribute to its widespread use in wound healing.5,6)
Collagen, on the other hand, is a crucial protein component found abundantly in the extracellular matrix of the skin. Therefore, in the wound healing process, the expression and accumulation of collagen play a vital role and should be considered in the development of therapeutic formulations. Chitosan promotes the directed accumulation of collagen through the oligomers generated during its degradation. Additionally, the positive charge of chitosan facilitates the effective induction of necessary supplementary proteins during the healing process.7)
Catechins are a type of polyphenol found in green tea and exist in various forms, including gallate catechin (GC), epigallocatechin (EGC), catechin (C), epicatechin (EC), epigallocatechin gallate (EGCG), gallocatechin gallate (GCG), epicatechin gallate (ECG), and catechingallate (CG). These compounds offer a range of health benefits, including prevention and inhibition of conditions such as atherosclerosis, high blood pressure, thrombosis, viruses, obesity, diabetes, cavities, and cancer. Moreover, they contribute to cardiovascular protection and antioxidant effects by scavenging free radicals. Catechins can inhibit inflammatory responses at the genetic level, thus preventing chronic inflammation and promoting keratinocyte proliferation and differentiation, which can maximize the effects of wound healing when used in conjunction with chitosan.8)
Controlling the release profile in drug delivery systems is crucial. Drug formulations can be tailored to meet specific needs, with choices between sustained-release or immediate-release, depending on the intended application and target area. In these formulations, it is crucial to carefully consider both the total amount of drug loaded into the delivery system and how it is gradually released over time. Ensuring the safety of a drug begins with a quantitative assessment of its relative safety profile. This involves evaluating the balance between the therapeutic amount that elicits the desired effect and the potentially toxic dose. The therapeutic window, often called the safety window, defines the optimal dose range that maximizes efficacy while minimizing the risk of undesirable side effects or toxicity.9) The release of a drug is typically visualized as a plot of drug concentration against time. In this context, two critical concentration levels come into play: the minimum effective concentration, below which the drug lacks effectiveness, and the toxic concentration, beyond which adverse side effects manifest. Maintaining drug concentrations within this range, at any given time, is essential for both safety and therapeutic efficacy. To control the release of a drug, it is vital to understand drug release kinetics. Zero-order kinetics, for instance, describe a situation where a constant amount of drug is liberated per unit of time, and this rate remains unaffected by the drug’s concentration. Zero-order drug delivery systems offer a promising solution to address challenges faced by immediate-release and first-order systems. By steadily releasing the drug at a consistent rate, they can maintain drug concentrations within the therapeutic window over an extended period.10) In the case of chitosan, the concentration used during patch production can influence the drug’s release characteristics.11,12) Therefore, this study aims to confirm the impact of catechin loading and chitosan concentration in the patches on the release pattern and its effects on cell proliferation and morphological changes.
2. Experimental Procedure
2.1. Materials
Green tea leaves for catechin extraction were purchased from local variety from Boseong, Korea. Chloroform and ethyl acetate (purity ≥ 95 %) purchased from DUKAN (Korea) and 75~85 % deacetylated chitosan (448877, medium molecular weight) purchased from Sigma.
2.2. Catechin extraction
Catechin extraction was conducted according to previously reported methods.13) Briefly, green tea leaves were pulverized, and tea powder with a diameter of less than 1 mm was used for extraction. The tea powder (20 g) was mixed with distilled water (400 mL) and steeped at 80 °C for 30 minutes under constant stirring at 300 rpm. The extracted tea infusion was then subjected to centrifugation at 1,700 rpm for 20 minutes to remove insoluble components. To remove impurities such as caffeine present in the tea infusion, 95 % chloroform was added in equal volumes, and the mixture was sonicated for 10 minutes. This step was repeated three times. The upper layer of the extract, which was free from impurities, was further processed to obtain pure catechin powder. This was achieved by adding 99.5 % ethyl acetate in equal volumes and sonicating for 40 minutes. The resulting mixture was then dried for 24 h at 45 °C to obtain catechin powder.
2.3. HPLC analysis of extracted catechin
To confirm the presence of catechin in the extracts, high-performance liquid chromatography (HPLC) was performed using a C18 column (5 µm, 4.6 × 150 mm, Waters, USA). The mobile phase consisted of water (A) and methanol (B), with varying proportions over time (0 min: 20 % B, 35 min: 35 % B, 36 min: 20 % B, 46 min: 20 % B). The sample injection volume was 20 µL.
2.4. Patch fabrication
Chitosan was dissolved in acetic acid at concentrations of 1 %, 1.5 %, and 2 % (w/v) to which 1 % (w/v) glycerol was added to maintain the patch’s shape. Catechin was added to achieve a final content of 1 mg/cm2, 1.5 mg/cm2, and 2 mg/cm2, respectively. The mixture was cast onto a rectangular glass plate and dried at 40 °C for 24 h to obtain film-type patches.
2.5. Release of catechin
Catechin-loaded chitosan patches (24 × 60 × 0.2 mm3) were placed in 200 mL of Dulbecco’s phosphate-buffered saline (DPBS) and incubated at 37°C. Samples were collected at 2, 4, 8, 12, and 24-h intervals, and the absorbance at 280 nm was measured using UV/Vis spectrophotometry to monitor the release pattern.
2.6. Measurement of contact angle
To analyze the surface characteristics of chitosan patches with varying catechin content and chitosan concentration, water contact angle measurements were performed using the Phoenix-300 Water Contact Angle Analyzer (Surface Electro Optics Co., Ltd., Korea). Contact angles were measured after applying 10 µL of water droplets (n = 3).
2.7. Cell responses
To assess the cellular response, NIH3t3 fibroblasts (ATCC) were seeded at a density of 5 × 10³ cells per dish. The cells were cultured in Petri dishes, and their morphology and condition were examined under a microscope after 3 and 5 days. During cell culture, Dulbecco’s Modified Eagle’s Medium (DMEM) supplemented with 10 % fetal bovine serum (FBS, Gibco) and 1 % antibiotic antimycotic (Gibco) was used. The culture medium was refreshed every 2 days to ensure the cells had access to fresh nutrients and maintain optimal growth conditions.
3. Results and Discussion
3.1. Confirmation of extracted catechins
As shown in Fig. 1, catechins extracted from green tea leaves using a solvent/ultrasonication method and incorporated to chitosan patches. In this study, the most efficient 40-minute ultrasonication condition was utilized for catechin extraction, and the amount of catechins extracted over time was confirmed. The amount of extracted catechins increased with extraction time up to 40 minutes but showed a decreasing trend at 60 minutes. This is believed to be due to the impact of continuous ultrasonication on the chemical structure of catechins.14) In Fig. 2, the spectrum shows prominent peaks around 3,400~3,200 cm-1, which correspond to O-H characteristics, a peak near 1,600 cm-1, representing the C=C characteristic peak in the major skeleton of the catechin structure, and peaks at 823 cm-1 and 1,035~1,075 cm-1 related to C-O-C characteristics. All these peaks are similar to the FT-IR peaks reported in previous studies on catechins.15,16)Fig. 3 displays catechins confirmed through HPLC chromatograms, showing the presence of catechins, GC, EGC, C, EC, EGCG, GCG, ECG, and CG. These results are in agreement with reported findings using a C18 column (4 µm, 4.6 mm × 250 mm) and a mobile phase consisting of 0.1 % phosphoric acid, acetonitrile, and tetrahydrofuran.13) Therefore, it can be confirmed that the catechins extracted for patch production were successfully obtained without significant structural alteration through the use of chloroform, ethyl acetate, and ultrasonication. According to reports, EGCG in green tea is known to inhibit the transcription of nuclear factor-κB (NF-κB), which can play a crucial role in suppressing the expression of many inflammation-related genes.17) It also has a remarkable effect on stimulating differentiation in keratinocytes during the growth process, particularly in relation to p57/KIP2, and enhances the activity of mitochondria in aging keratinocytes, increasing succinate dehydrogenase synthesis and activity by up to 37 times.8,18)
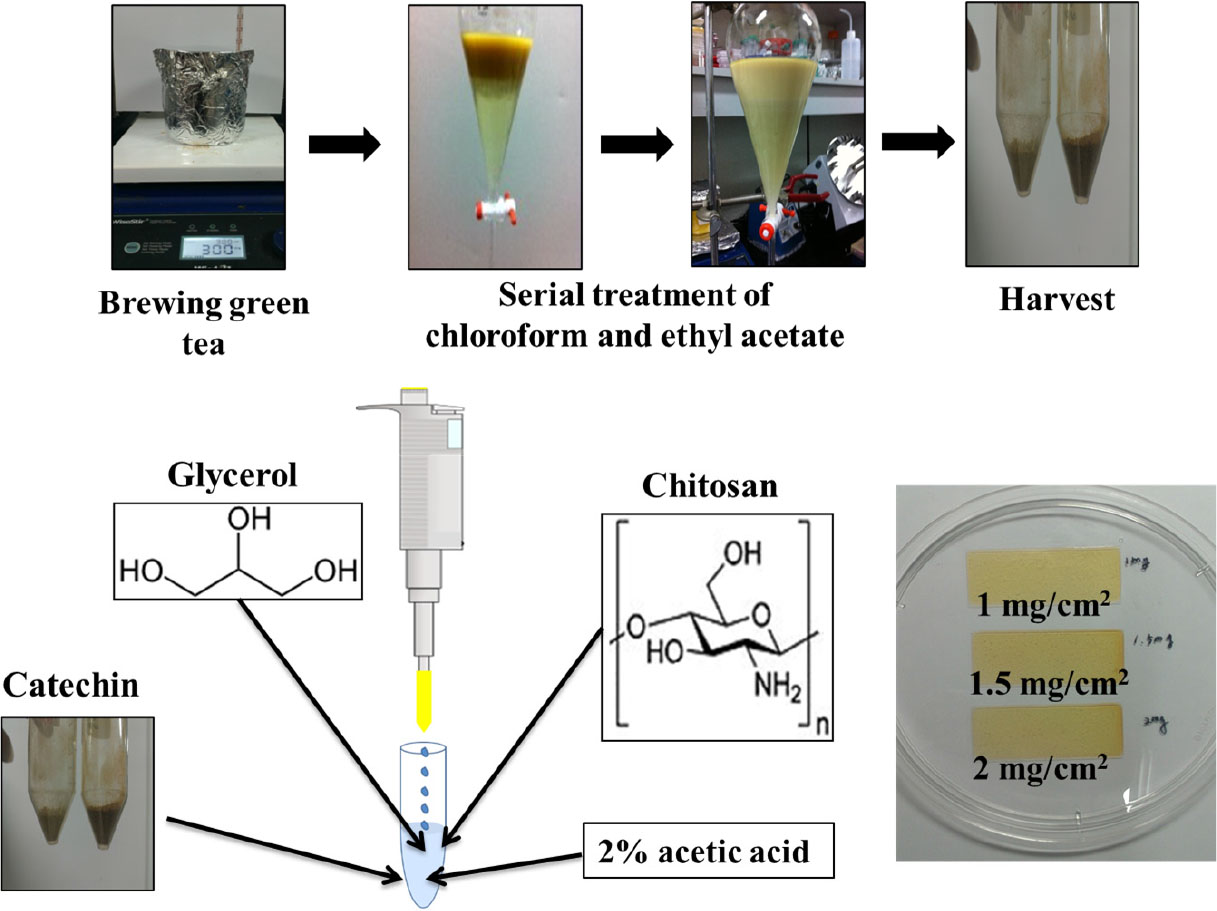
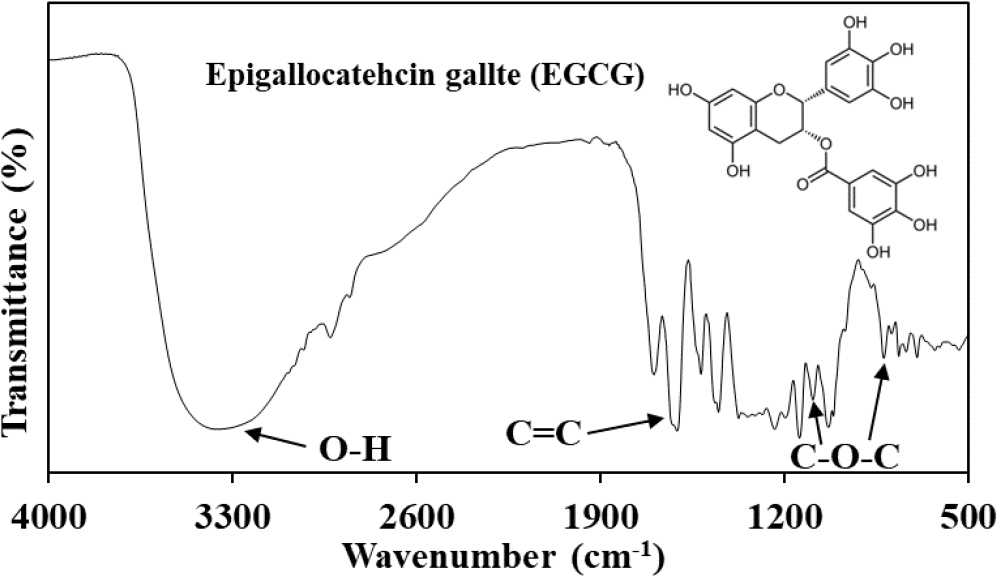
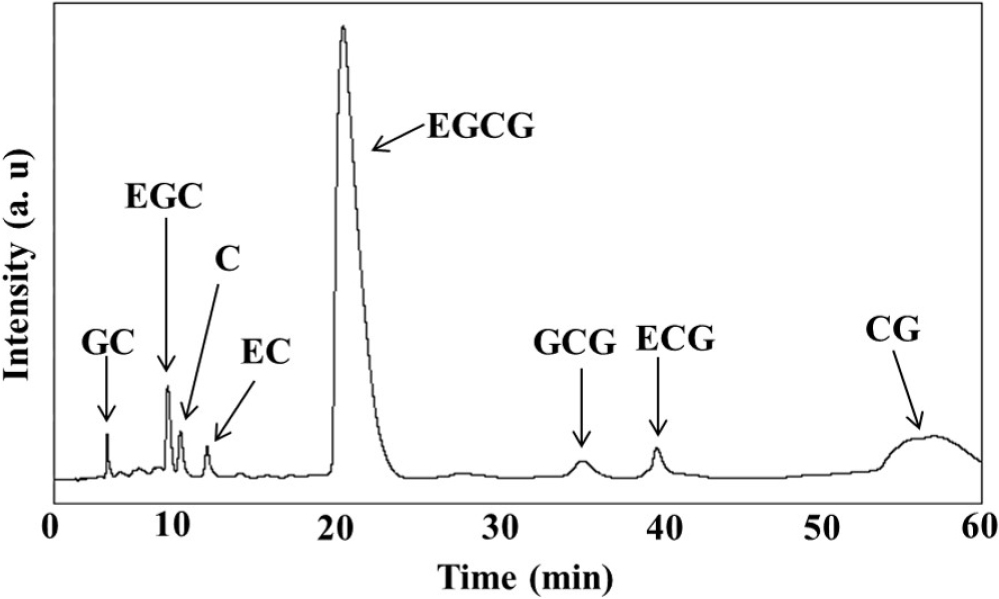
Fig. 3.
HPLC chromatogram of extracted catechin from green tea. The analysis conducted at 1 mL/min flow rate of mobile phase (A: deionized water, B: methanol) with C18 reverse phase column in room temperature. The ratio of mobile phase A and B was 0 min: 20 % B, 35 min: 35 %, 45 min: 20 % B. 280 nm wavelength was used for detection of catechin and injection volume was 20 µL. GC: gallate catechin, EGC: epigallocatehcin, C: catehcin, EC: epicatehcin, EGCG: epigallocatechin gallate, GCG: gallocatechin gallate, ECG: epicatehcin gallate, CG: catehcin gallate.
Furthermore, exposure to UVB radiation, a type of ultraviolet radiation, can be fatal, especially since it is a major factor for skin cancer.19) When EGCG was applied to living skin equivalent, it was reported to inhibit the expression of oxidative stress-related factors induced by UVB, such as c-Jun NH2 terminal kinase and p38 mitogen-activated protein kinase, and increase the thickness of the epithelium.20)
3.2. Fabrication of chitosan patches
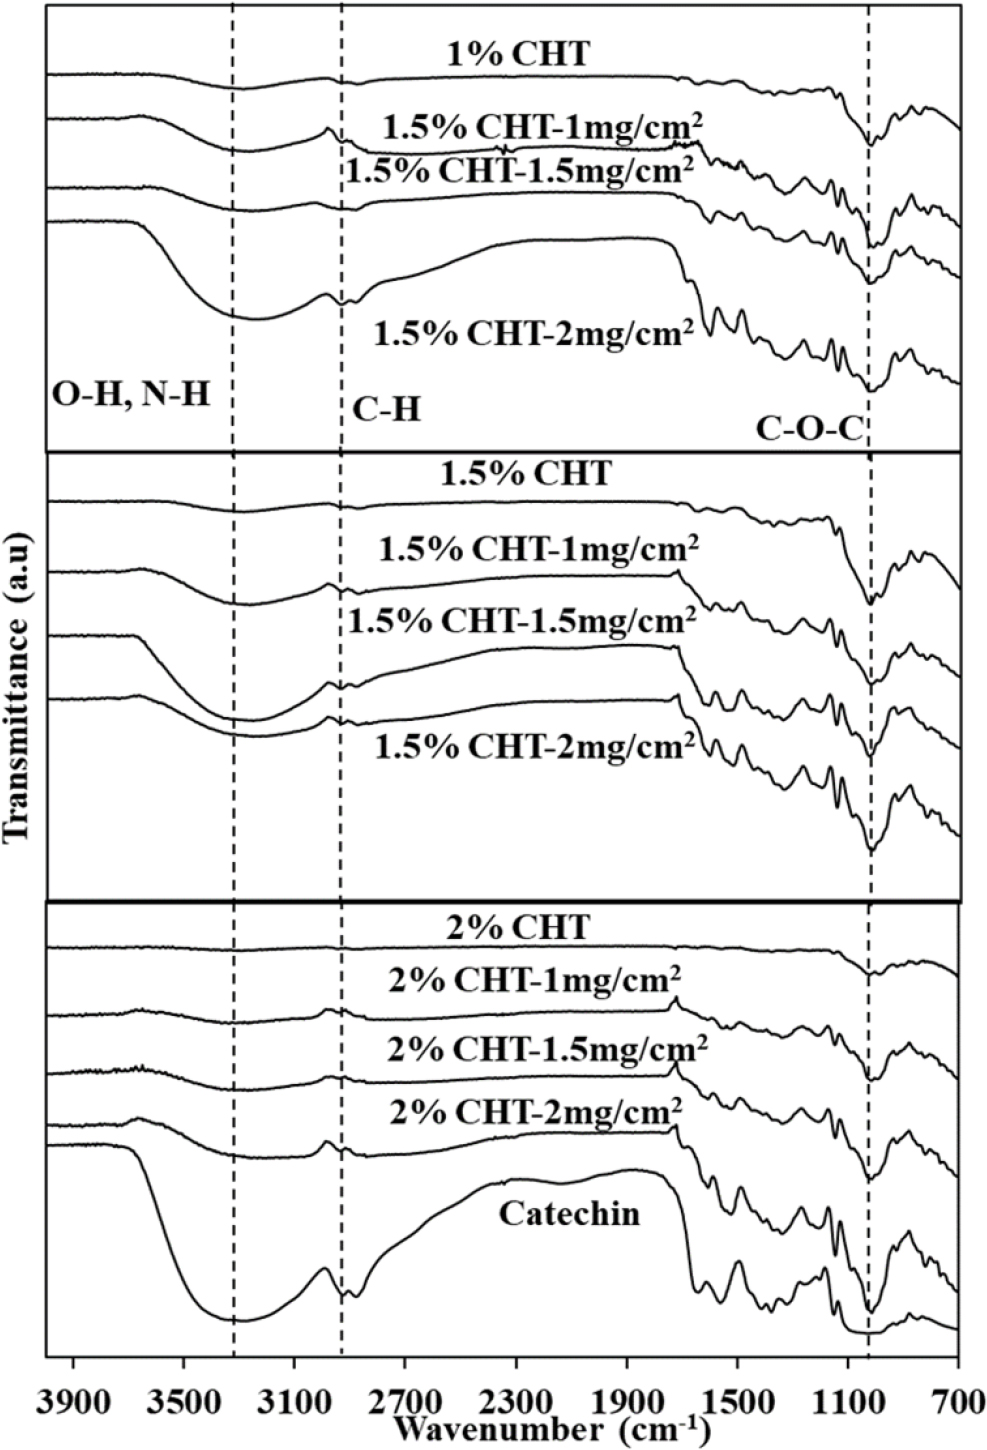
FT-IR spectra confirming catechin-loaded patches were presented in Fig. 4. These spectra depict patches manufactured with 1 %, 1.5 %, and 2 % chitosan with 1, 1.5, and 2 mg/cm2 catechin, respectively. The mixed chitosan and catechin in the patches made using the solvent casting method did not form unnecessary chemical bonds, and catechin was uniformly distributed throughout the entire patch. When a drug is incorporated without strong binding, diffusion and release can occur easily, thereby increasing the initial release amount of catechin for sufficient delivery to the patch application site. The solvent casting method is one of the methods used for patch and film manufacturing due to its simplicity. Kaur successfully increased the bioavailability of a chitosan/pectin oral mucosal adhesive patch for delivering carvedilol hydrochloride, a treatment for congestive heart failure, using the solvent casting method.21) Additionally, micro-needle chitosan patches produced using a polydimethylsiloxane (PDMS) mold were reported to efficiently deliver bovine serum albumin (BSA, MW = 66.5 KDa) into the skin.22)
3.3. Measurement of contact angle
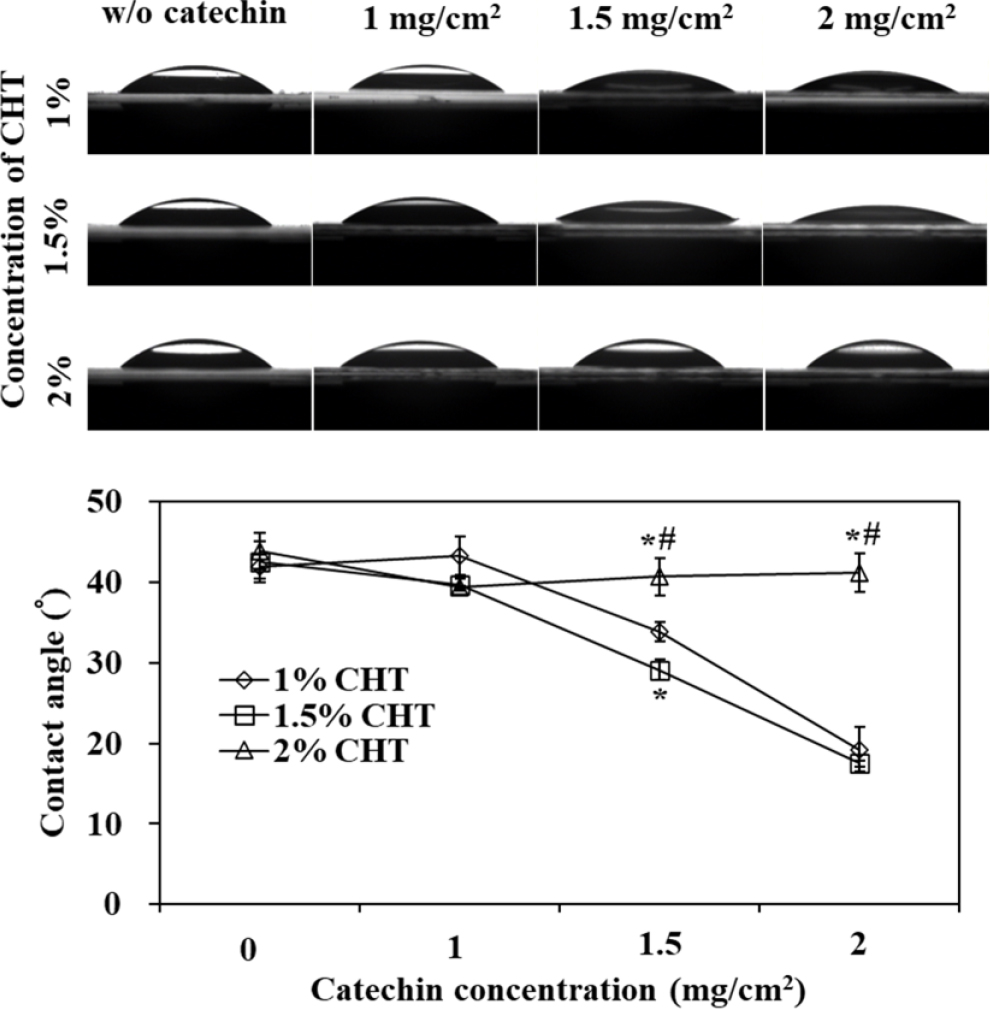
Changes in contact angles based on the concentration of chitosan and the amount of catechin were measured and presented in Fig. 5. For 1 % and 1.5 % chitosan, it was observed that as the hydrophilic catechin content increased, the contact angle decreased. However, in the case of 2 % chitosan, the contact angle showed a slight decrease compared to when catechin was not incorporated, and it remained relatively constant, regardless of the amount of catechin incorporated. This suggests that the surface of the 2 % chitosan patch was less affected by catechin incorporation, and the dense chitosan matrix structure covered catechin, hindering its exposure. Therefore, the structural density of the chitosan patch is believed to influence the catechin release pattern. The initial 24-h release of 2 % chitosan was slower and exhibited a release pattern with little variation with respect to catechin content, consistent with the contact angle measurements, thus supporting this hypothesis.
3.4. Behavior of catechin release
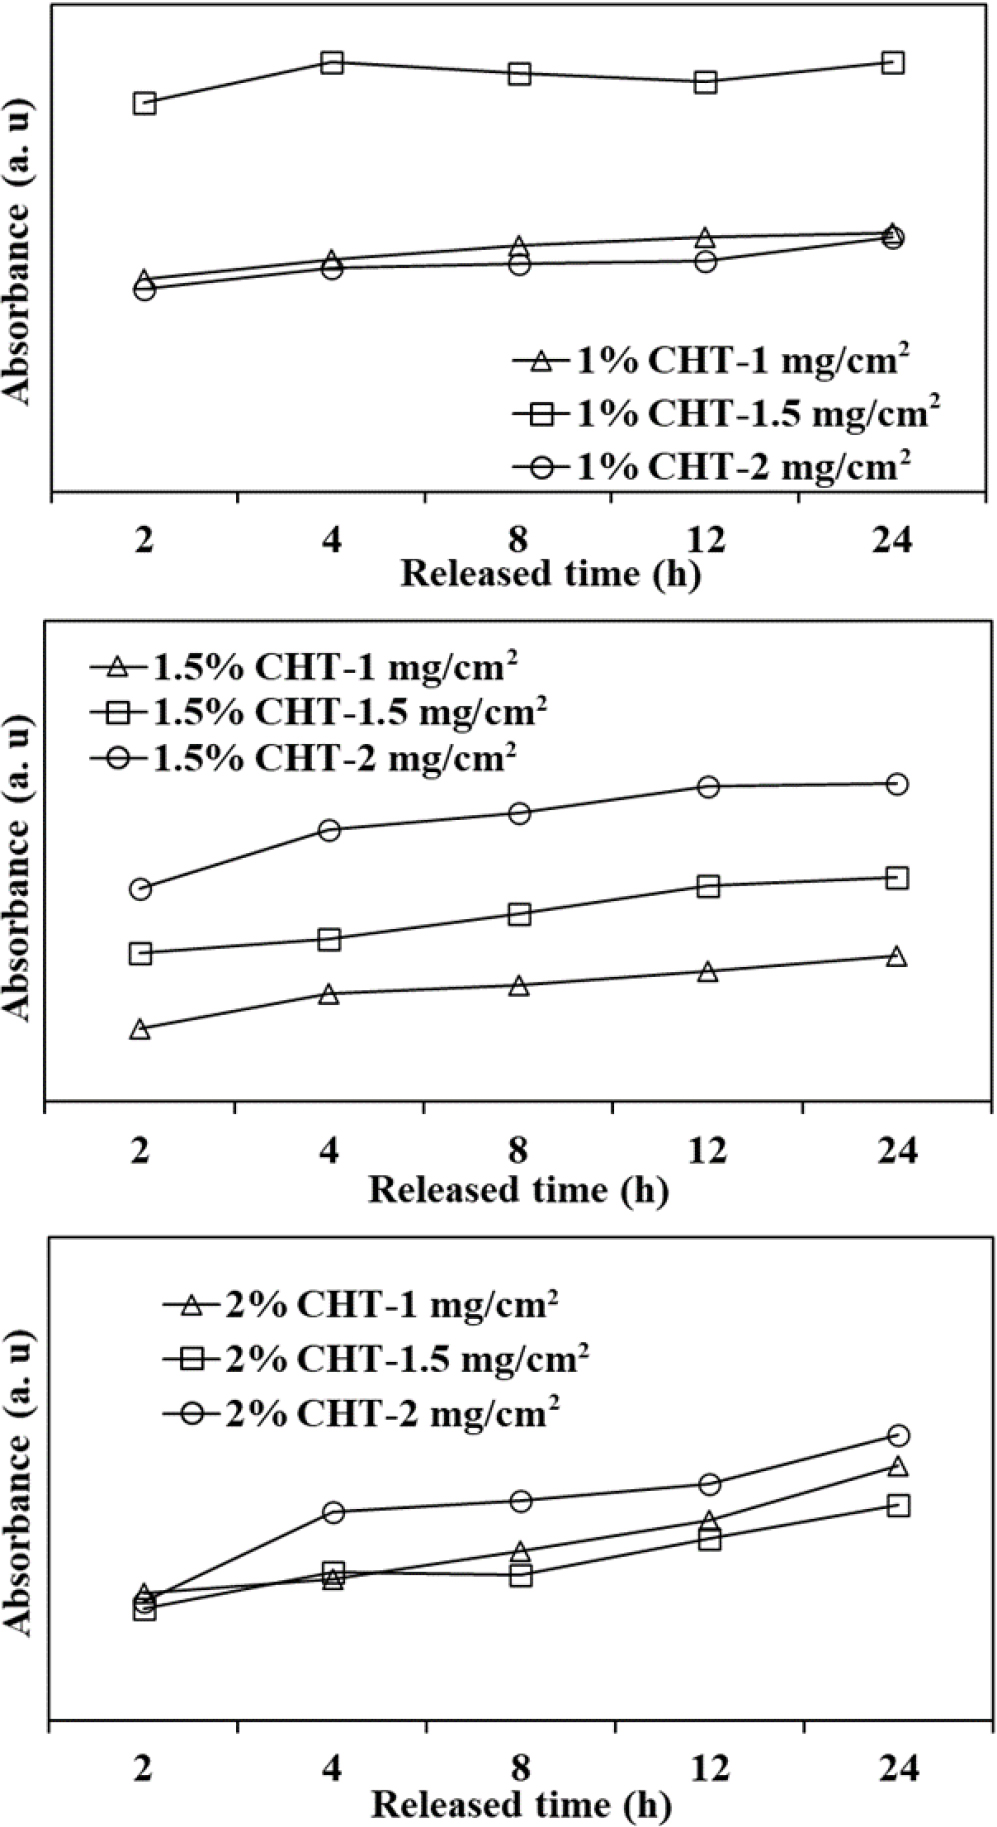
The release behavior over 24 h, based on chitosan concentration and the amount of incorporated catechin, was presented in Fig. 6. It indicates that as the chitosan concentration increased, the initial release amount decreased. Notably, for 1 % chitosan, the initial catechin release was exceptionally high. Additionally, when catechin was incorporated into polyethylene glycol 400 at different concentrations (1.35, 1.03, 0.68, and 0.32 mg/cm2), the released amount increased with the amount incorporated,23) which is similar to that of chitosan. It is believed that as the chitosan concentration increased, the free space on the patch decreased, leading to a denser structural arrangement, causing this phenomenon.24) Catechin’s oral administration is problematic as it can lose its activity or be degraded during metabolism in the stomach or liver. Chen addressed this issue by manufacturing mPEG-PCL-graft-2-hydroxycellulose patches for the delivery of catechins into the bloodstream, achieving and maintaining the desired concentration. The delivery efficiency of catechins through the skin was improved, with up to 0.84 mg/mL of catechin delivered when it was incorporated at a concentration of 1.5 mg/cm2.25) In this study, for the 1 % chitosan with 1.5 mg/cm2 catechin, the high initial release amount (17.53 mg) over 24 h indicates that a sufficient amount of catechin can be delivered to the application site for effective wound healing. The reports of enhanced proliferation and differentiation of primary epidermal keratinocytes, as well as increased DNA synthesis and energy production in aged keratinocytes when treated with EGCG at a concentration of 200 µM (18.34 mg), support this assumption.8) Additionally, the release rates of catechin from the chitosan patches are crucial factors that depend on the total concentration of catechin. To elaborate, the extracted catechin exhibited two distinct release patterns, characterized as burst and sustained release. In the case of 1 % CHT, particularly at a dosage of 1 mg/cm2, it displayed a rapid initial release with a rate of 0.0275 mg ‧ mL-1 hr-1. This indicates that approximately 76 % of the total incorporated catechin was released within the first 2 h. Conversely, higher chitosan concentrations yielded a relatively sustained release pattern. Specifically, the application of 2 % CHT at 1 mg/cm2 resulted in a slower catechin release, with a rate of 0.0225 mg ‧ mL-1 hr-1 over 2 h. Similarly, 2 % CHT at 2 mg/cm2 exhibited a rate of 0.0215 mg ‧ mL-1 hr-1, resembling the lower catechin release rate, irrespective of the catechin content. This suggests that the 2 % chitosan configuration forms a more compact structure, making it challenging for catechin to diffuse through and traverse the chitosan barrier.
3.5. Cell responses
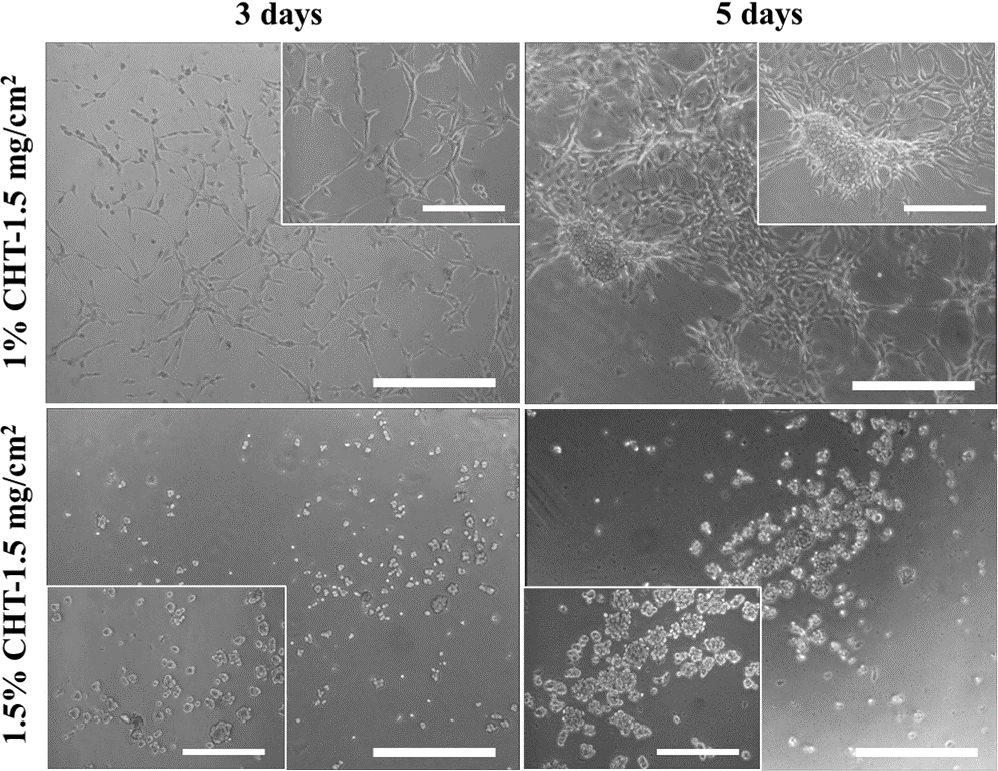
When 1.5 mg/cm2 of extracted catechin was added to the manufactured chitosan patches, the results showed that in the case of 1.5 % chitosan, on both the 3rd and 5th days, the cells failed to develop extended protrusions and instead appeared clumped together. When cell protrusions are not sufficiently extended, it can lead to negative effects on cell attachment, proliferation, and hinder efficient wound healing. In contrast, for the 1 % chitosan, on the 3rd day, cell protrusions were well-extended and evenly distributed, and on the 5th day, the cells exhibited movement, clustering, and attempted matrix formation, as shown in Fig. 7. Therefore, higher concentrations, including 1.5 %, of chitosan may have adverse effects on cell attachment, proliferation, and movement, which can be attributed to deacetylation.26) Consequently, for the 1 % - 1.5 mg/cm2 patches, which exhibited the highest initial release over 24 h, microscopic observations indicate no cell toxicity and a positive impact on cell attachment, proliferation, and matrix formation.
4. Conclusions
In this study, we observed changes in the release pattern based on chitosan concentration and catechin amount. There were conditions that exhibited an optimized release pattern depending on the concentration of chitosan and the quantity of incorporated catechin. Specifically, for the 1 % chitosan with 1.5 mg/cm2 catechin patch, which showed the highest initial release over 24 h, it was confirmed through microscopic observations that it had no cell toxicity and had a positive impact on cell attachment, proliferation, and matrix formation. Therefore, it is confirmed that the release pattern can be controlled based on the chitosan concentration and the appropriate catechin incorporation amount, ultimately maximizing wound healing.
