


1. Introduction
Fluorescent test systems for DNA diagnostics are widely studied due to their inherent advantages, such as simplicity, short test time, high sensitivity and low cost in comparison with other methods. Recently, it has been discovered that GO could be applied as fluorescent quencher.1) GO plays a key role in the different approaches of the creation of test systems for DNA diagnostics owing to this unique property and appearance of varying degrees of affinity for different forms of DNA.2-14)
The key properties allowing GO to be utilized in the development of fluorescent kits for DNA diagnostics are as follows3-14): a high affinity for single-stranded DNA and low for double-stranded and the ability of fluorescent quenching of adsorbed fluorophores on the surface of GO. To develop the high efficient fluorescent quencher, it is important to consider the issues related to its structure and properties of GO, which are dependent on the method of synthesis. GO is usually obtained through intercalating the graphite by Brensted acid. Depending on the synthesis conditions such as oxidation time, the quantity of adsorbed acid and residual compounds were varied resulting in the variation of the functional groups on the surface of GO and offset their absorption bands in the IR-spectrum. In this experiment, we prepared the various kinds of GO suspensions and tested the GO suspension for fluorescence quenching in DNA diagnostics.
2. Experimental
Natural graphite powder(mass fraction of carbon is about 93 %), potassium permanganate(mass fraction of KMnO4 is not less than 99.8 %), sulfuric acid(mass fraction of H2SO4 is 93.6 %), sodium nitrate(mass fraction of NaNO3 is not less than 99.8 %), and hydrogen peroxide (mass fraction of H2O2 is not less than 37.3 %) for GO synthesis were purchased from Sigma Aldrich. Deionized (DI) water(18.2 MΩ·cm) was prepared with Milli-Q Advantage system. The suspensions of GO were synthesized based on modified Hummer’s method.15) Briefly, 0.1 g of natural graphite and 0.05 g sodium nitrate were added into 14 ml concentrated sulfuric acid. Then 0.4 g potassium permanganate was gradually added. The mixture was stirred in a beaker by a magnetic stirrer at 75 °C during three weeks. After stirring the mixture was diluted with DI water two times by volumes. Then 5 % hydrogen peroxide was added into the mixture until the color of the mixture changed to brilliant yellow. The brilliant yellow mixture containing GO was washed on Buchner funnel with ashless filter and DI water until a neutral pH of the filtrate. These conditions gave a dark brown jellylike mass of GO. The jelly-like mass of GO was removed from filter to beaker, diluted by DI water and then exfoliated to generate GO nanoplates by ultra-sonic waves. After ultra-sonication the obtained GO-suspension was centrifuged for 5 minutes to remove particles of graphite oxide. The dark brown GO-suspension was dialyzed to remove residual metal ions and acids. Dialysis was carried out in Cellu·Sep Cellulose Tubular Membranes( MWCO 12-14 kDa). Eight suspensions with variants of GO nanoplates were prepared with some variations of above mentioned method(see Table 1).
Table 1.
Synthesis parameters for sample preparation.
Measuring the concentration of GO in the suspension was performed by simple weighing method. Briefly, 250 μl of the GO suspension was applied to apre-weighed cover glass with 20 × 20 mm2 size. The glass was heated on a laboratory hot plate at 170 °C for 3 minutes to evaporate the aqueous phase. This sequence was repeated four times, thus remained on the glass sheet by a dry residue of one milliliter GO suspension. The resulting dry residue with a cover glass was weighed on analytical scales ViBRAXFR-205DRE(Shinko Denshi, Japan) followed by calculating the concentration of the GO.
Morphologies and elements of GO films were characterized with on the scanning electron microscopy(SEM, Jeol7800F, Japan) with the system of microanalysis (Oxford Instruments Nano Analysis, OINA). Atomic force microscope(AFM, Solver Next, NT-MDT) with the noncontact mode scanning probe NSG10 was used to determine the thickness of GO films. The functional groups in GO were characterized by IR spectroscopy(FTIR spectrometer, Varian 7000 FT-IR). IR spectra were recorded in the range of 550-4000 cm–1 with a resolution of 8 cm–1. The stability of colloidal GO suspension was measured for 6 weeks using P330 NanoPhotometer(IMPLEN). The absorbance of GO suspensions was measured at wavelengths of 230 and 450 nm at intervals in one week.
Fluorescent oligonucleotide for DNA fluorescent quenching analysis(5’-FAM-CCTCAAGATTTCGAGATGGC- 3’, 95 % purity according to HPLC) was purchased from Evrogen CJSC. DNA fluorescent quenching experiments were carried out using fluorescently labeled oligonucleotide solution(5’-FAM-CCTCAAGATTTCGAGATGGC- 3’, FAM-DNA) and Gene-4 fluorimeter(DNA Technology). Two mixtures for each GO samples were prepared: 40 μl of a solution of fluorescently labeled oligonucleotide(1 μM), 100 μl of PBS 2x solution and 40 μl of DI water were mixed in a 0.6 ml microcentrifuge transparent tube. Then, 20 μl of GO suspension(0.5 mg/ml for samples #1-5,7,8 and 0,05 mg/ml for sample 6) was added to the solution, the resulting mixture was incubated for 20 minutes on an orbital shaker(450 rpm) followed by measuring of fluorescent intensity in the FAM fluorescent channel using a Gene-4 fluorimeter. For comparison, the control solution without GO was prepared.
The specific degree(N) of the fluorescent quenching for each sample of GO was calculated by the following formula:
Where C(GO) × 1000: the concentration of GO in the analyzed solution expressed in mg/L : 50 mg/L for samples #1-5,7,8 and 5 mg/L for sample #6 in Table 2. F0: Fluorescent intensity of control solution without GO (minus the background fluorescent of water) containing 0.2 μM FAM-DNA. F1: Fluorescent intensity of the analyzed solution(minus the background fluorescent of water) containing 0.2 μM FAM-DNA. C(FAM-DNA) × 1000: Used concentration of FAM-DNA in the analyzed and control solutions expressed in nM: 200 nM. DNA fluorescent quenching measurements were carried out three times for each GO sample and the average values of a specific degree of fluorescent quenching were adapted.
3. Results and Discussion
It is known that the preparation conditions of GO suspensions influence their physico-chemical properties, which is why no definite chemical formula of GO is determined.15) To prepare the different kinds of GO suspension, we selected four parameters with which it was possible to modify the properties of the suspension: stirring time for the reaction of mixture (in weeks), the temperature of the reaction mixture under stirring (in degrees Celsius), the amount of oxidant in the reaction mixture-potassium permanganate (in g), and the volume of deionized water for washing of GO on the filter (in ml). In our experiments, eight suspension variants of GO were prepared to determine the influence of the synthesis conditions on the properties of the resulting GO suspension. Table 1 presents the synthesis parameters of GO suspensions. Here, we selected the #1 sample as the base (synthesis parameters: stirring time of 3 weeks, the reaction temperature of 25 °C, the amount of potassium permanganate of 0.3 g, the amount of DI water of 300 ml during washing) and Fig. 1 demonstrates the photo of the GO suspension of #1 sample. The other seven variants of suspensions differ from base suspension with one parameter changing and 3 others constant. Determined average concentrations of GO in the prepared samples are shown in Table 2. Averages and standard deviations were calculated according to 3 repetitive measurements. Determinate GO concentration varies within 0.66-4.34 mg/ml depending on the synthesis conditions. The stability of a colloidal GO suspension was checked with the sample #1, obtained by basic technique. Optical density D measured at 455 nm was fairly stable for six weeks, as can be seen in Fig. 2 for suspension concentrations of 0.25 and 3.5 mg/ml.
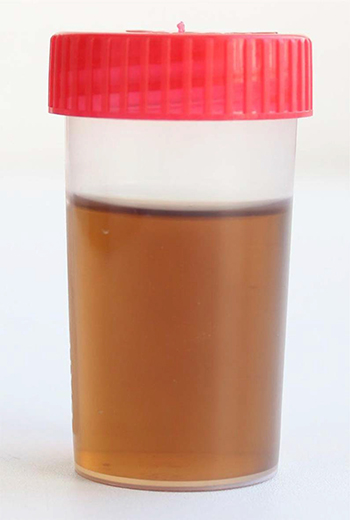
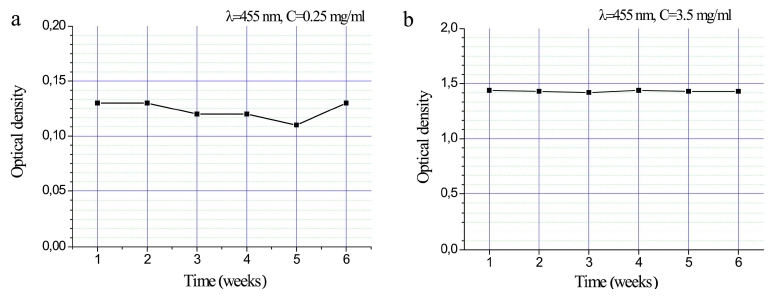
Fig. 3 showed the AFM result of sample #1 GO films, the minimum thickness of nanoplates of GO was about 1.5 nm, which was consistent with the published data.4) The mean values of atomic contents of elements C, O, S and N by SEM element analysis in the samples are shown in Fig. 4 for comparison to the base suspension (#1). Carbon content in all samples ranged from 52.5-65 %, oxygen 35-44 %, and sulfur 1-3.3 %, except for the sample with a reduced amount of oxidant in Fig. 4d. Nitrogen is present with amount of 1.7-6.5 % in two samples of Fig. 4c, d. In the case of a sample of Fig. 4d sulfur was not determined. In Fig. 4a the sulfur and oxygen content were reduced while increasing the volume of wash water. Decrease of mixing time reduces sulfur and oxygen content compared to the base sample. However, increase of mixing time does not change much their contents compared to the content in the base sample(Fig. 4b). Increasing the temperature of the reaction medium compared to the base conditions(Fig. 4b) leads to a natural reduction of the sulfur and oxygen content and nitrogen appearance in the sample. Reducing the amount of oxidizing agent leads to a decrease in the oxygen content and an increase in the carbon content compared to the base sample(Fig. 4d). Increasing the amount of oxidant doesn't considerably influence to an oxygen content and additionally nitrogen appears comparing to base sample.
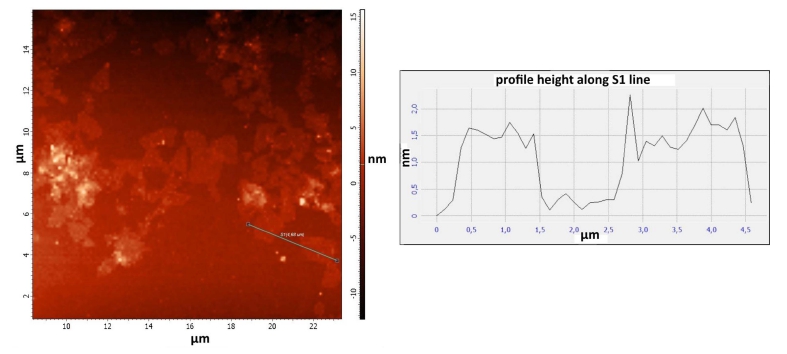
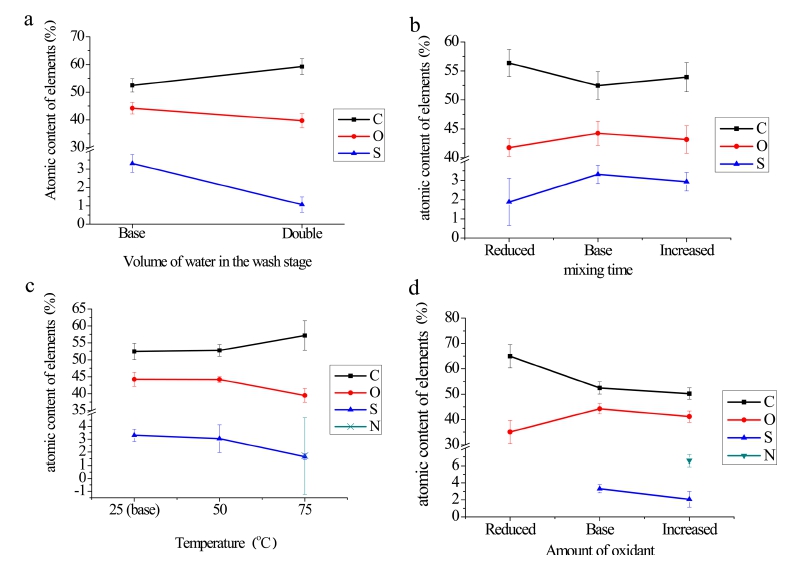
Fig. 4.
Changes in the concentrations of elements in GO films prepared from the various experimental parameters. (a) Volume of water in the wash stage, (b) mixing time, (c) reaction temperature, and (d) amount of oxidant.
SEM images of GO films synthesized with a small amount of oxidant and the base suspension were shown in Fig. 5. It is important to note, that the structure of GO film changes significantly with decreasing amounts of oxidant in the reaction mixture. The base sample in Fig. 5(b), which has larger amount of oxidant than the sample in Fig. 5(a), becomes amorphous.
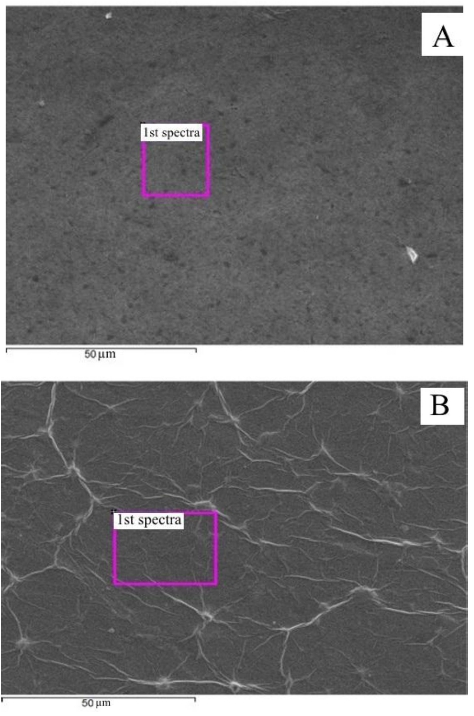
Fig. 5.
SEM images of GO film: (a) prepared with a small amount of an oxidizing agent and (b) the base sample (#1).
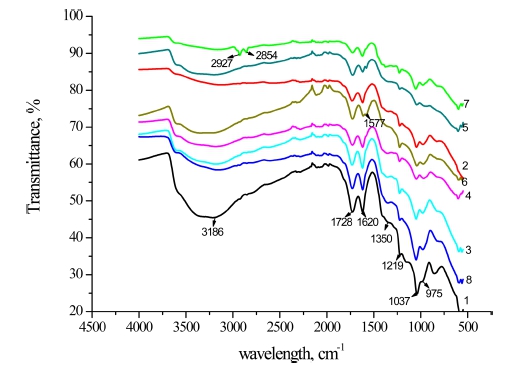
Surfaces and the edges of GO nanoplates were functionalized with different oxygen-containing groups(mainly: hydroxyl, carboxyl, epoxy) depending on the synthesis conditions, as evidenced by IR spectroscopy data of GO samples(Fig. 6). The IR spectra results show that the maximum amount of adsorbed and intercalated water(band 3000-3700 cm–1) were contained in the sample #1 (Fig. 6, curve 1), the smallest amount was contained in the sample #2 with double washing and sample #7, obtained with a reduced amount of oxidant(Fig. 6, respectively, curve 2 and curve 7). The view of the IR-spectra does not depend much on mixing time.
It is expected that the change in the surface structure of GO nanoplates and composition of functional groups on the surface could change interaction with biomolecules (including DNA molecules) used in the biosensor assays for DNA diagnostics.3-14) The most common type of fluorescent molecules that were used to generate the signal in assays3-14) was fluorescently labeled single-stranded oligonucleotides with length of 15-40 bases. In this study to compare our data with the literature the oligonucleotide was used with 20 bases in length: 5’-FAM-CCTCAAGATTTCGAGATGGC- 3’ similar to those used in references.3-5,7) The structure of the oligonucleotide was not selected on purpose, but the classic rules of molecular genetics, such as GC composition of 50 %, the lack of long repeats, were considered. Table 3 shows the values of the specific degree of fluorescent quenching measured for all of synthesized GO samples #1 ~ #8. The specific degree of fluorescent quenching of GO samples depends on the synthesis parameters of samples of suspensions and varies the magnitude of 0.90 nmol/mg of sample 8, with a reduced amount of oxidant to 16.39 nmol/mg of sample #6 synthesized at a temperature of 75 °C. Analysis of the data in Table 3 suggests that an additional washing with DI water of the resulting GO suspension (sample #2) leads to reduction of the specific degree of fluorescent quenching of GO compared with sample #1. These data also indicate that sample #3, which was synthesized with the reduced mixing time is almost 1.5 times less effective in fluorescent quenching than samples 1 and 4.
Table 3.
Specific degree of fluorescent quenching for the various GO suspensions. (nmol of fluorescent oligonucleotide per 1 mg of GO).
| Sample # | 1 | 2 | 3 | 4 | 5 | 6 | 7 | 8 |
|---|---|---|---|---|---|---|---|---|
| Oligonulceotide / GO (nmol / 1 mg) | 2.91 ± 0.17 | 1.43 ± 0.07 | 2.12 ± 0.06 | 2.79 ± 0.08 | 2.62 ± 0.08 | 16.39 ± 0.81 | 6.41 ± 0.37 | 0.90 ± 0.05 |
As can be seen from Table 3, increasing the temperature of mixing in the synthesis of GO to 50 °C (sample #5) does not lead to a significant change in the fluorescent quenching efficiency of GO, while raising the temperature up to 75 °C (sample #6) allows GO to have the quenching efficiency in ~6 times greater than basesample #1. At the same time, reducing 1.5 times amount of potassium permanganate in the synthesis of GO(sample #7) leads to an increase in the fluorescent quenching efficiency of GO at almost 2 times as compared with the sample #1, while the increase in the amount of oxidant in 1.33 times (sample #8) has the opposite effect.
According to the simple logic, increasing of the mixing time, the temperature of the reaction mixture and the amount of oxidizing agent generally lead to an increase in the degree of oxidation of GO nanoplates, and therefore lead to uniform effect of changing fluorescent quenching efficiency of GO. In fact as can be seen from Table 3, it is difficult to simplify and generalize the effect of experimental parameter on GO properties and fluorescent quenching efficiency because all experimental parameter are interrelated. However, special attention is drawn to increasing the temperature of GO synthesis (sample #6), which leads to multiple increasing of the specific degree of fluorescent quenching of GO compared to other samples and sample 1. At the same time, according to elemental analysis(Fig. 4c), sample #6 is less oxidized by oxygen than samples #1 and #5, as well as a small amount of nitrogen is fixed in its composition as opposed to samples #1 and #5. In other words, the sample #6 as an example of GO with the highest value of the specific degree of fluorescent quenching was the best of the synthesized samples, and was the best substitution for molecular quenchers for use in test systems for DNA diagnostics based on the use of fluorescently labeled oligonucleotides. In comparison with the published data,3,7) the value 16.39 nmol/mg was very good for DNA testing.
4. Conclusion
We purposely changed the synthesis condition of GO nanoplates and modified surface properties of GO for fluorescent quencher applications. During the study it was found that almost all studied parameters of GO synthesis(temperature, mixing time, ratio of components, the conditions of treatment) affect to the specific degree of fluorescent quenching efficiency for single-stranded DNA molecules associated with the fluorophore. It would be logical to assume that the key to effective adsorption of molecules of single-stranded DNA and quenching of the fluorophore must be a degree of oxidation of graphene oxide, because of the variations of the mixing time, the temperature of the reaction mixture and the amount of oxidant were changed significantly in samples #1~8 and have significant influence on the specific degree of fluorescence quenching of GO. However, based on the elemental analysis of samples #1-8, it was found that the deterioration of the oxidation conditions for the samples #3 and #7 (which is recorded in increasing of the atomic content of carbon) has opposite influences on the specific degree of fluorescence quenching for these samples. At the same time, improving oxidation conditions for the samples #4 and #8 (which does not significantly reflected in the element composition as compared with the sample #1) is also has opposite effect on the specific degree of fluorescence quenching. Thus, increasing the temperature of GO synthesis, which logically should lead to increasing the degree of oxidation of graphene oxide, on the contrary, leads to its reduction and a significant increasing of the specific degree of fluorescence quenching. At the end, double washing of GO leads to reduction of the specific degree of fluorescence quenching.
Thus, samples #2, #3, #6, #7 are more reduced than the original sample #1 according the elementary analysis data. But two samples (#2 and #3) have decreased specific degree of fluorescence quenching as compared with sample #1, and two samples (#6 and #7) have increased specific degree of fluorescence quenching compared with the sample #1. Therefore, the results of this study it is not possible to make firm conclusions about the nature of the influence of the GO synthesis conditions to the specific degree of fluorescence quenching, and this trend is for further study. However, the main finding of this work is the fact, that the reaction temperature was found to be the most dominant parameter to control the GO properties. In this experiment, 75 °C of reaction temperature produced the GO nanoplates with a maximum specific level of fluorescent quenching 16.39 nmol/mg. GO nanoplates with this value could be an effective substitution of molecular fluorescent quenchers in test-systems for DNA-diagnostics.