

1. Introduction
The term varistor is a compound word of variable resistor. The variable resistor is a resistor that the resistance changes with the applied voltage, not rheostat as an electrical instrument used to control a current by varying the resistance. The resistance in the varistor is a nonlinear and an opposite concept to Ohm’s law. For this reason, the varistor is called a voltage dependent resistor. Thus, the varistors have nonlinear voltage-current characteristics.
Today, the main material for varistor is a zinc oxide. Zinc oxide possesses more native zinc than oxygen, due to as-nonstoichiometry. Thus, zinc oxide becomes an ntype oxide semiconductor. Zinc oxide ceramics sintered without impurities is a polycrystalline and does not exhibit nonlinear voltage-current characteristics. Typical zinc oxide varistors is based on ZnO-Bi2O3-based ceramics proposed by Mastuoka et al.1) Where, Bi2 O3 acts as varistor forming oxide inducing the nonlinear resistance. To improve diverse characteristics of varistors, several oxides such as CoO, MnO2, Cr2O3, and Sb2O3 (called Mastuoka’s varistor composition) are added to zinc oxide.1)
We are interested in zinc oxide varistors doped with PrO1.83 as another varistor forming oxide.2-8) Namely, ZnO-PrO1.83-based varistors exhibit a simple microstructure and good electrical properties, when compared with ZnO-Bi2O3-based varistors. In general, the microstructure of zinc oxide ceramics is composed of ZnO grain, intergranular layer at the grain boundary, and several minor phases. In fact, minor phases may change various characteristics and yield a bad reproducibility. The minor phases mainly come from liquid phase sintering. This is in the case of mainly ZnO-Bi2O3-based varistors. By contrast, ZnO-PrO1.83-based varistors are by mainly solid phase sintering.6,7) The solid phase sintering will yield much less minor phases, when compared with liquid phase sintering. However, the solid phase sintering needs a high temperature of the vicinity of 1,350 °C. If not so, the density of ceramics will be always a problem, in particular varistor among a lot of electronic devices. So far, ZnO-PrO1.83-based varistors have been a lot of published in terms of the electrical characteristics and aging characteristics. So far, the most basic composition for ZnO-PrO1.83-based varistors published was ZnO-PrO1.83- CoO-Cr2O3 (ZPCC)-RO (Rare earth metal oxides).9-13) The doping of RO to ZPCC-based varistors (called ZPCCR-based varistors) generally deteriorates the ceramic density, whereas improves electrical characteristics. Although ZPCCR-based varistors were sintered at 1,350 °C, their ceramic density is so not satisfactory. However, the doping of Al2O3 to ZPCC-based varistors (called ZPCCA-based varistors) doped with only RO significantly improves the ceramic density.14,15)
On the basis of these experimental facts, in this study, the effect of Sm2O3 on microstructure and electrical properties of the ZPCCA-based varistors was investigated, and remarkable results, that is, an excellent dense ceramics and excellent nonlinear properties were attained.
2. Experimental Procedure
As the starting materials to manufacture the ZnOPrO1.833- based varistors, all the oxides used were analytical grade: ZnO (99.9 %, Kojundo), PrO1.83 (99.9 %, Aldrich), CoO (99.9 %, Aldrich), Cr2O3 (99.9 %, Kojundo), Al2O3 (99.9 %, Kojundo), and Sm2O3 (99.9 %, Kojundo). The varistor ceramic composition is as follows: (98.0-x) ZnO + 0.5 PrO1.83 + 1.0 CoO + 0.495 Cr2O3 + 0.005 Al2O3 + x mol% Sm2O3 (x = 0.0, 0.5, 1.0, and 2.0 mol%). The manufacturing procedure is by a standard ceramic processing technique. The weighed powder was milled in polypropylene bottle (250 ml, Nalgene) with acetone using the zirconia balls for 24 h. After drying at 120 °C, the powder was calcined in air for 2 h at 750 °C. The powder was pulverized using an agate mortar/pestle, mix ed with 2 w t% p olyvinyl a lcohol ( PVA) b inder, granulated through a 100-mesh sieve, and then pressed into discs of 10 mm in diameter and 2 mm in thickness at a uniaxial pressure of 100 MPa. The pressed discs were sintered at 1,300 °C in air for 2 h, with heating and cooling rate of 4 °C/min, and slowly furnace-cooled to room temperature. The final samples have a dimension of 8 mm in diameter and 1.0 mm in thickness. Silver electrodes were prepared on both surfaces of samples by painting with silver paste and by firing at 580 °C for 10 min. The electrodes have a dimension of 5 mm in diameter.
The microstructure of thermally etched surface was analyzed by a field emission scanning electron microscope (FESEM, Quanta 200). The mean grain size was calculated by the intercept method proposed by Wurst et al.16) The chemical elements of the specified phases were confirmed by an energy dispersion X-ray spectroscope (EDS). The crystalline phases were analyzed by an X-ray diffractometer (XRD, X¢pert-PRO MPD) using a Cu-Ka radiation. The sintered ceramic density was measured by a density determination kit (238490) attached to a balance (Mettler Toledo AG 245) using the Archimedes method.
The voltage (V)-current (I) data was measured by voltage sourcing-current measuring utilizing a Keithley 237 unit. The breakdown electric field (E1 mA) was measured at a current density of 1.0 mA cm-2. The leakage current density (JL) was measured at 0.8 E1 mA. The nonlinear coefficient (a) was estimated using the equation, a = (logJ2– logJ1)/(logE2 – logE1), where E1 and E2 are the electric fields at current density J1 = 1.0 mA cm-2 and J2 = 10 mA cm-2, respectively.
The capacitance (C)-voltage (V) data was measured at a frequency of 1 kHz and signal voltage of 1 Vrms utilizing a QuadTech 7600 LCR meter, and a Keithley 617 for dc bias. The donor concentration (Nd) of semiconducting grains and the potential barrier height (Φb) at the grain boundary were obtained utilizing the equation proposed by Mukae et al.17) The density of interface states (Nt) at the grain boundary was calculated by the equation related to Nt.17,18)
The dielectric characteristics, such the apparent dielectric constant (εAPP') and dissipation factor (tanδ) were measured in the frequency range 100 Hz – 2 MHz utilizing a QuadTech 7600 LCR meter.
3. Results and Discussion
Fig. 1 shows the FESEM images of the varistor ceramics doped with different contents of Sm2O3. The doping of Sm2O3 revealed the following phenomena; 1) The decrease of mean grain size; 2) The increase of precipitation of secondary phase; 3) The precipitation of the secondary phase at mainly triple points. The majority of the doped Sm2O3 is not resolved to ZnO matrix due to the difference of ionic radius and is precipitated at triple points. It is confirmed as one evidence that the secondary phase is composed of Pr and Sm species from EDS analysis, as shown in Fig. 2. It is assumed that the decrease of the mean grain size is attributed to a large drag effect when the doping content of Sm2O3 increases. The mean grain size (d) decreased linearly from 7.8 to 4.1 μm with the increase of doping content of Sm2O3. Therefore, Sm2O3 acted as a restrictor of grain growth. The sintered ceramic density (ρ) increased from 5.70 to 5.82 g/cm3 (5.78g/cm3 in pure ZnO) with the increase of doping content of Sm2O3. This is surprisingly dense ceramics.13-15) The tendency of change of the mean grain size and sintered density according to doping content of Sm2O3 exhibited graphically in Fig. 3. Generally rare earth metal oxides decrease the grain size and decrease the sintered ceramic density. However, a part of them increase the sintered density, when combine with Al2O3.14,19)
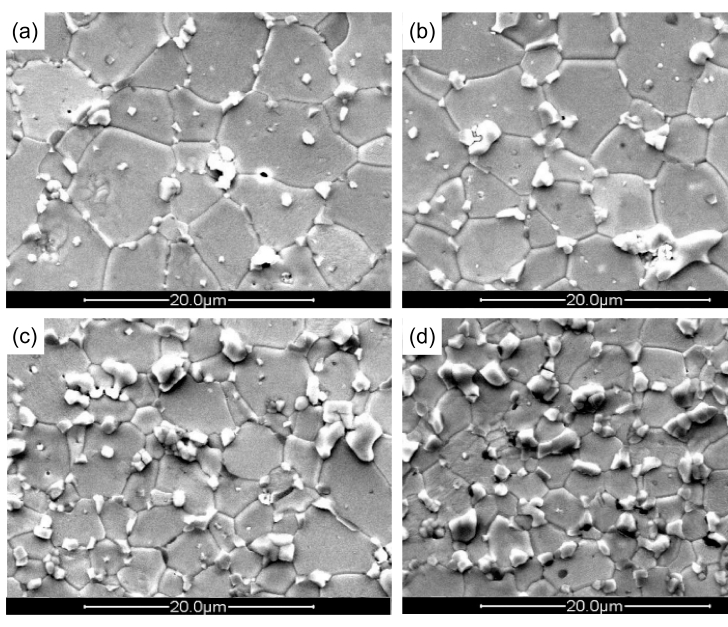
Fig. 1
SEM micrographs of the samples doped with different contents of Sm2O3: (a) 0.0 mol%, (b) 0.5 mol%, (c) 1.0 mol%, and (d) 2.0 mol%.
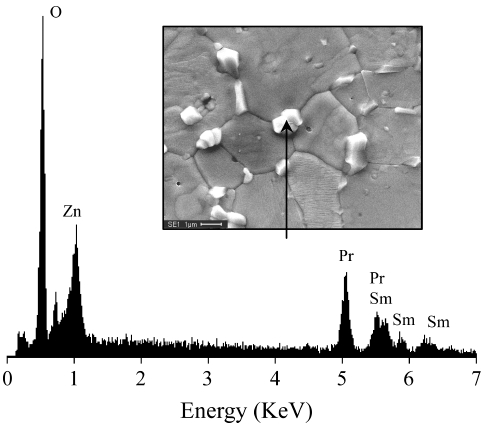
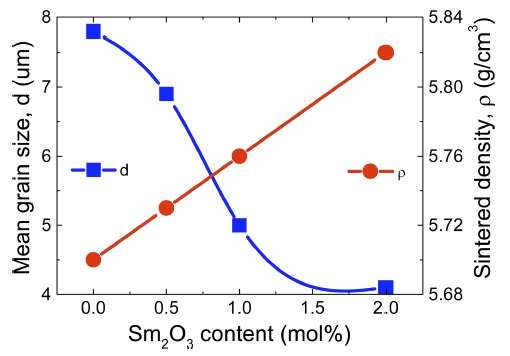
Fig. 4 shows XRD patterns of the varistor ceramics with the increase of doping content of Sm2O3. The sample without Sm2O3 is composed of only Pr-species such as Pr6O11 and Pr2O3 as a secondary phase. The samples doped with Sm2O3 have Sm2O3 itself as a secondary phase except for Pr-rich phase. New phases were not generated by a chemical reaction between doped species within bulk. The microstructure parameters of the sintered ceramics doped with different contents of Sm2O3 are shown in Table 1.
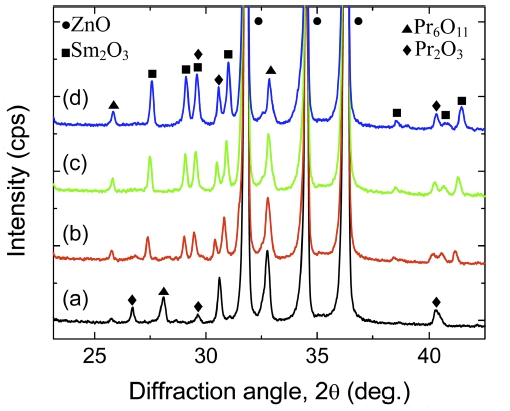
Fig. 4
XRD patterns of the samples doped with different contents of Sm2O3: (a) 0.0 mol%, (b) 0.5 mol%, (c) 1.0 mol%, and (d) 2.0 mol%.
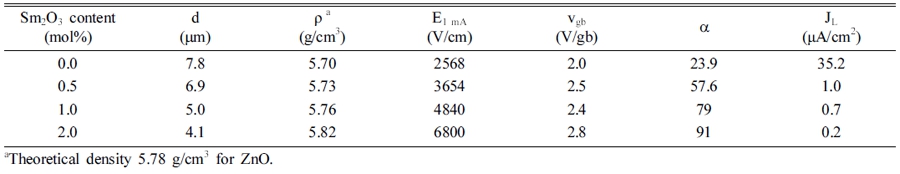
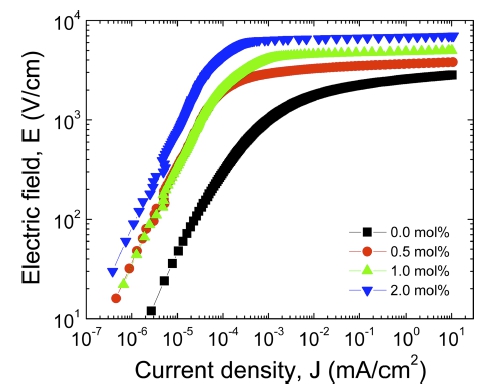
Fig. 5 shows the electric field-current density (E-J) characteristics of the varistors doped with different contents of Sm2O3. The E-J characteristics in varistors are the core among a lot of basics. The E-J characteristic curves are similar to piecewise linear model of Zener diode: a very low current region before breakdown field and a very high current region after breakdown field. This piecewise linear model comes from potential barrier at grain boundaries between ZnO polycrystalline. A low current region is dependent on a temperature, whereas a high current region is not so. Let’s us scrutinize the doping effect of Sm2O3 on the electrical parameters, based on Fig. 5.
As can be seen in Fig. 6, the breakdown electric field (E1 mA) exhibited opposite curves to mean grain size of the varistors doped with different contents of Sm2O3. The decrease of mean grain size with the increase of doping content of Sm2O3 will increase the number of grain boundaries, and then it increases the breakdown voltage (V1 mA). The increase of V1mA is the increase of E1mA (E1 mA = V1 mA/d, d is mean grain size). The E1 mA increased from 2568 to maximum 6800 V/cm with the increase of doping content of Sm2O3.
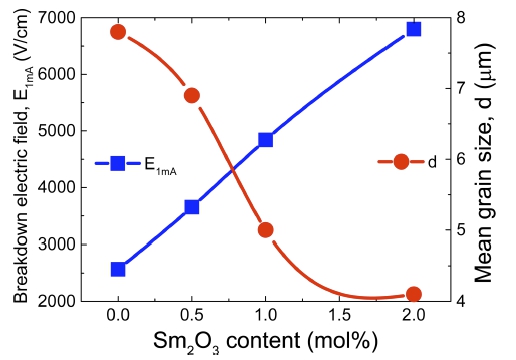
Fig. 6
Breakdown electric field and mean grain size of the samples doped with different contents of Sm2O3.
Fig. 7 shows the nonlinear coefficient (a) and leakage current density (JL) as a function of doping content of Sm2O3. The nonlinear coefficient (a) increased remarkably from 23.9 to 91 with the increase of doping content of Sm2O3. In particular, the varistor doped with 2.0 mol% in doping content of Sm2O3 exhibited the excellent nonlinearity as revealing the nonlinear coefficient of 91. It should be emphasized that this is the novel nonlinear properties. Furthermore, the nonlinear coefficient of this sample is considerably the highest value among the reported papers so far.20) On the other hand, the leakage current (JL) decreased from 35.2 to 0.2 μA/cm2 with the increase of doping content of Sm2O3. Good nonlinear properties possessing the high nonlinear coefficient and the low leakage current are closely related to potential barrier at grain boundaries. On the whole, the relation between nonlinear coefficient and leakage current exhibited an opposite tendency, as shown in Fig. 7. The more detailed E-J characteristic parameters doped with different contents of Sm2O3 are shown in Table 1.
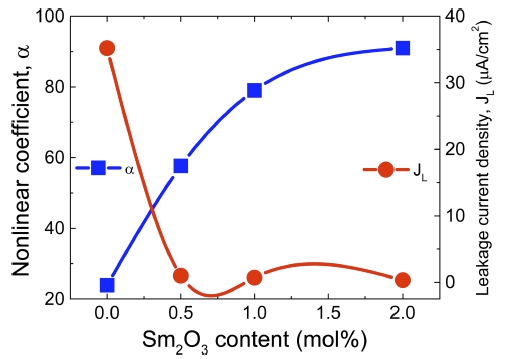
Fig. 7
Nonlinear coefficient and leakage current behavior of the samples doped with different contents of Sm2O3.
Fig. 8 shows the modified capacitance-voltage (C-V) characteristics of the varistors doped with different contents of Sm2O3. The tendency of change in the C-V curves increases linearly with the increase of the applied voltage and this means the decrease of capacitance. Fig. 9 shows the effect of Sm2O3 doping on the donor concentration (Nd) and barrier height (Φb) obtained by applying Mukae’s equation17) to Fig. 8. The donor concentration (Nd) decreased from 2.73 × 1018 cm-3 to 1.18 × 1018 cm-3 with the increase of doping content in Sm2O3. The ionic radii of rare earth metals are larger than Zn+2 ion (0.074 nm). Therefore, the substitution of Sm within the ZnO grains is extremely limited. If Sm substitutes for Zn, Sm2O3 may serve as a donor. However, experimental result is not so. Therefore, the decrease of electron concentration on conduction band is assumed to be attributed to the partial pressure of oxygen (Po2), namely, Nd μ Po2–1/4 or Po2–1/6.21) As a result, Sm2O3 serves as an acceptor. The barrier height comes from active grain boundaries inducing the nonlinearity, and increased from 1.10 to 1.49 eV. Also the highest value was 1.49 eV at 2.0 mol% Sm2O3 that has been revealed the highest nonlinear coefficient. The density of interface states (Nt) comes from a polycrystalline comprising necessarily grain boundaries, and decreased in the range of 5.31 × 10¹² to 4.08 × 1012 cm-2. If the grain boundary is a kind of a junction, the depletion layer width (t) is generated within ZnO grain, and increased in the range of 19.2 to 34.4 nm due to the decrease of donor concentration with the increase of doping content of Sm2O3. The more detailed C-V characteristic parameters doped with different contents of Sm2O3 are shown in Table 2.
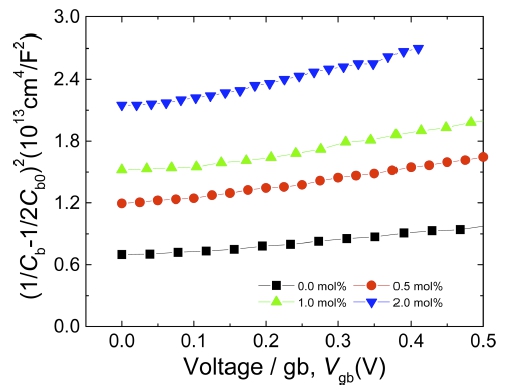
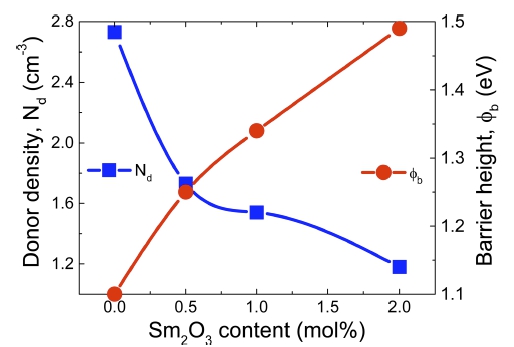
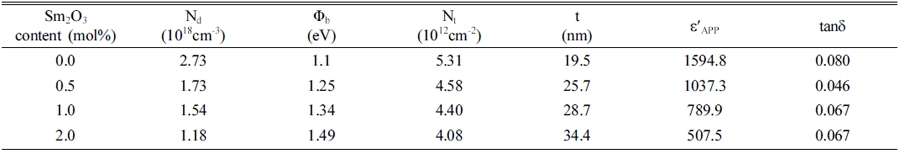
Fig. 10 shows the dielectric constant (εAPP') and dissipation factor (tanδ) of the varistors doped with different contents of Sm2O3. The depletion region is composed of a space charge, namely fixed charge such as positively charged zinc interstitial, negatively charged zinc vacancy, and ionized donor. Therefore, the dielectric constant comes from both sides of grain boundaries. It can be seen that the dielectric constant is affected by doping content of Sm2O3 from Fig. 10. The dielectric constant of all the samples decreases with the frequency. This is a kind of dielectric dispersion, as can be seen for other ceramics. The rate of decrease of the dielectric constant reduces with the increase of doping content of Sm2O3. Assuming the doping of Sm2O3 restricts the rotation of electric dipole within the depletion region, it is assumed that further doping of Sm2O3 will further restrict the rotation of electric dipole, and as a result, will decrease the dielectric constant. Meanwhile, the frequency dependence of the dissipation factor (tanδ) is somewhat complex. All the samples are unusual when compared with existing published results.
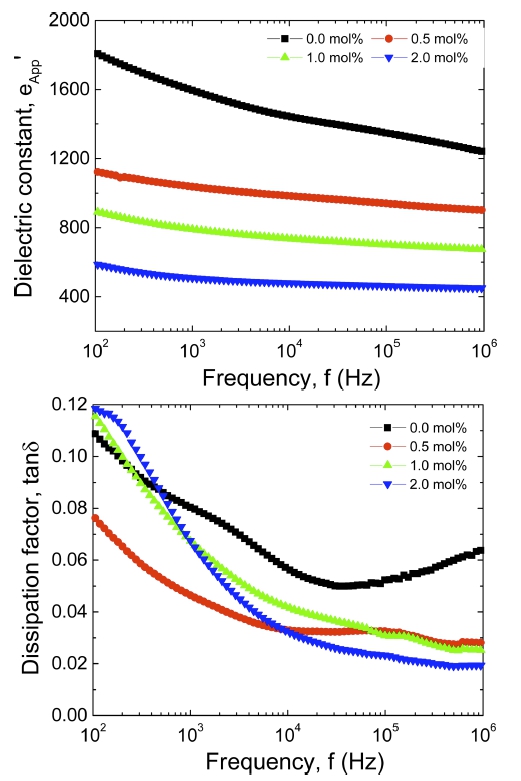
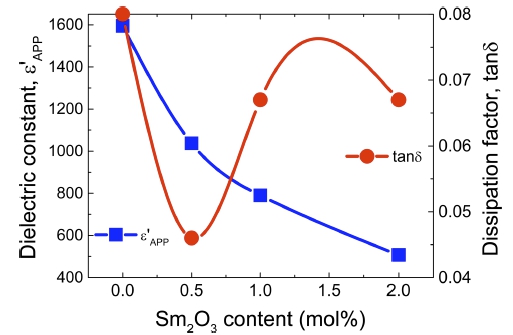
Fig. 11 shows the dielectric constant (eAPP') at I kHz and the dissipation factor (tand) as a function of doping content of Sm2O3. The dielectric constant decreased in the range of 1594.8-507.5 with the increase of doping content of Sm2O3. It is believed that this phenomenon is a result of the increase of the depletion layer due to the decrease of donor concentration with the increase of doping content in Sm2O3. The dissipation factor exhibited the fluctuation by the repetition of decrease or increase with the increase of doping content in Sm2O3. On the whole, this is the decreasing tendency. The more detailed dielectric parameters doped with different contents of Sm2O3 are shown in Table 2.
4. Conclusions
The microstructure, electrical and dielectric behavior of the ZPCCA-based varistor ceramics were comprehensively investigated with different contents of Sm2O3. In microstructure, the doping of Sm2O3 restricted the grain growth on the basis of the grain size decreasing from 7.8 to 4.1 mm, and it made more dense sintered ceramics. In electrical characteristics, the doping of Sm2O3 enhanced nonlinear properties on the basis of the nonlinearity increasing from 23.9 to 91, and Sm2O3 served as an acceptor on the basis of the donor density decreasing from 2.73 × 1018 cm-3 to 1.18 × 1018 cm-3. In dielectric characteristics, the doping of Sm2O3 decreased the dielectric constant from 1594.8 to 507.5, and the dissipation factor exhibited a weak dependence of Sm2O3 on the basis of fluctuation tendency.
Core conclusion is that 2.0 mol% Sm2O3-doped ZPCCAbased varistors exhibited surprisingly nonlinear coefficient as high as 90 as well as highly dense ceramics. Therefore, Sm2O3 will be used as a wonderful potential additive to ZPCCA-based varistor ceramics.
