

1. Introduction
2. Experimental Procedure
2.1. Chemicals
2.2. Synthesis of the nanocomposite
2.3. Characterization
3. Results and Discussion
4. Conclusion
1. Introduction
Most of these environmental toxins that harm our ecosystem are dumped straight into undeveloped waterways. These contaminants include, among other things, chemicals, oils, leftover metal, radioactive waste, and vegetable waste. Dyes are a vital component of our lives, adding color to a wide range of goods from textile, paper, leather tanning, hair coloring, cosmetic, photochemical cell, and furniture sectors. They also contribute significantly to water pollution.1,2,3,4) Over 100,000 commercially available dyes are used by the dyeing industry. The industries release about 15 % of these non-biodegradable dyes into water bodies annually.5,6,7,8) The main cause for concern is the chemically active dyes found in industrial wastewater, which have the potential to cause cancer. These dyes also lower the amount of oxygen that dissolves in water and prevent sunlight from penetrating aquatic organisms, which results in reduced photosynthetic activity. Both organic and inorganic pollutants that are harmful to the environment are found in the waste generated during the dyeing process.9,10,11,12,13,14,15,16,17) Coagulation, membrane processes, and other physio-chemical therapies are ineffective in eliminating the color and dye ingredient concentration.18,19,20,21) The development of technology for the efficient removal of dyes has been identified as a rapidly expanding field of industrial importance research. The international environmental criteria are satisfied by the efficient, cost-effective, and photocatalytic dye degradation caused by semiconductors such as metal oxides, nitrides, and sulfides.22,23,24) Manganese dioxide (MnO2) is regarded as one of these semiconductors’ best photocatalysts for the oxidative elimination of both organic and inorganic contaminants because it has great chemical stability and surface reactivity.25,26) MnO2 is easily reoxidized after being exposed to dioxygen and can facilitate fast electron transfer by functioning as an electron-transfer mediator during photocatalytic oxidation.27,28) According to earlier research, α-MnO2 nanorods have been utilized for photocatalytic organic dye elimination when exposed to ultraviolet (UV) light.29,30)
In addition, titanium dioxide (TiO2) is a famous photocatalyst because of its unique chemical stability, affordability, and biocompatibility.31) Moreover, TiO2 broad bandgap (3.2 eV) means that it mostly absorbs UV light, which produces hydroxyl radicals, and are a potent oxidant that breaks down organic molecules.32) In addition, silicon carbide (SiC) is a viable encouragement for photocatalytic applications due to its unique features that include correct bandgap for UV light, strong chemical and thermal stability. Several research have addressed the synergistic effect of SiC inclusion to TiO2, and they have all shown that this leads to enhanced photocatalytic activity because SiC grains and TiO2 nanoparticles form heterojunctions.33,34) The SiC-TiO2 plots also allowed calculating the rate constant of the methyl orange (MO) degradation reaction heterojunctions occur simply by covering the photocatalytic surface with SiC foam layers. The developed photocatalytic activity causes the charge carriers’ movement between the conduction and valance band of TiO2 and SiC.35) Furthermore, the combination of MnO2, SiC fiber, and TiO2 can facilitate efficient charge separation and migration during photocatalysis. MnO2 and TiO2 are known for their ability to generate electron-hole pairs under light irradiation. SiC, being a semiconductor, can also contribute to electron transfer processes. This synergy allows for more effective separation of photo-generated electrons and holes, reducing charge recombination, which is crucial for improved photocatalytic performance. Therefore, we selected the MnO2-SiC-TiO2 nanocomposite of good efficiency for photocatalytic degradation.
2. Experimental Procedure
2.1. Chemicals
Methylene blue (MB) and MO was procured from (Ducksan Chemical Co., Korea), Titanium Tetra-n-butoxide Monomer from Kanto Chemical Co. (Japan), Manganese (II) Chloride Tetrahydrate purchased from Daejung (Korea), DI water was made by self- product.
2.2. Synthesis of the nanocomposite
13.5 g SiC fiber and Titanium Tetra-n-butoxide 3.3 g were dissolved in 100 mL distil water under magnetic stirring for the synthesis of SiC-TiO2 composite. After the mixing, this solution provided into the dryer at 100 °C for 24 h, then powder formed. Afterwards, 6.75 g SiC-TiO2 powder and 1.94 g Manganese (II) Chloride Tetrahydrate powder were dispersed in 100 mL DI water mixed using by magnetic stirring. After well mixing, this solution was dried for 24 h at 100 °C. Then, the following synthesis chemical substances were calcined at 1,000 °C.
2.3. Characterization
X-ray diffraction (XRD, SHIMADZU XRD-6000) spectrophotometry was employed to investigate the nanocomposite crystallinity and chemical functionalization. SHIMADZU XRD-6000 equipment was utilized to gather the XRD data, along with a Cu-Kα X-ray source (1.5406) fitted throughout a 2-theta range of 10~90° at 40 kV and 40 mA. Scanning electron microscopy (SEM; JSM-5600 JEOL, Akishima, Tokyo, Japan) and the surface dispersion of the nanocomposites was evaluated using transmission electron microscopy (TEM; Hitachi HT7700, Tokyo, Japan) with bright-field imaging at 100 kV. The bandgap energies of the samples were calibrated using the Kubelka-Munk function, which utilizes UV-Vis diffuse reflectance spectroscopy (DRS) data (SHIMADZU UV-2600). Using a 150 W Halogen bulb and a tabletop SLS301-stabilized Tungsten-Halogen light source, the photocurrent value was determined. Electrochemical impedance spectra or EIS were utilized to measure the sample resistivity and rate of deterioration using an electrochemical analyzer (Zahner, Germany).
3. Results and Discussion
The XRD patterns of SiC-TiO2 and MnO2-SiC-TiO2 nanocomposites are demonstrated in Fig. 1. The TiO2 coated SiC generated a thin layer of TiO2 on SiC fibers reduces the intensity of the SiC fibers’ XRD peaks, and a few additional peaks are seen that correspond to TiO2. The major diffraction peaks of the synthesized TiO2 can be indexed as (101), (111), (112), (200), (105), (211), (213), (116), (215) and (303) peaks are located at 2θ of 25.28, 36.94, 38.58, 48.50, 53.89, 55.06, 62.12, 68.76, 75.03, 82.130, respectively.36) The SEM indicated the profile of the sample that was scanned using a high-energy electron beam and exhibited the images in Fig. 2. The SiC-TiO2 composite of SEM images were presented in Fig. 2(a). The TiO2 had a large, differently sized particle, and the TiO2 NPs were widely distributed. The SiC fiber has a plentiful surface with spread out TiO2. The SiC fiber’s diameter was 11.3 nm, and its surface was smooth. The SiC fiber’s physical characteristics provided the ideal setting for metal oxide semiconductors to create the best SEM profiles. The mixed morphology of MnO2 with SiC-TiO2 composite (rod-like and spherical) is revealed in the high magnification image of Fig. 2(b). For each sample, we acquired TEM pictures at various magnifications. The MnO2-SiC-TiO2 and SiC-TiO2 nanocomposite analysis applying TEM to reveal the perfect images of the particles size and structure, as shown in Fig. 3(a, b). As we observe, the dimensions of the nanoparticles of TiO2 powders have been shown to have simultaneously spherical and rod-shaped particles, and MnO2 and SiC nanoparticles size is physically aggregated. As shown in Fig. 3(c), by using energy-dispersive spectroscopy (EDS) analysis, the C, O, Si, Mn and Ti components verified from the elemental mapping of MnO2-SiC-TiO2 nanocomposite. UV-Vis absorbance was utilized to measure the degradation of MB concentrations, which is applied as the contaminant.37)Fig. 4(a) presents an effective characterization of the greatest peak of UV-Vis absorbance, which ranges 665 nm. We examined the degradation of contaminants using the wavelength shifting of the greatest peak.38,39) The UV-Vis light absorption characteristics of the produced photocatalysts are examined using DRS. The Kubelka-Munk theory is used to determine the band-gap value of semiconductors.40) In the formula αhv = A (hν-Eg)1/2, the absorption coefficient, light frequency range, balance unchanged, and band gap are denoted by the values of α, ν, A, and Eg. The plot of (αhv)1/2 versus energy (hν) is shown in Fig. 4(b). The band gap of SiC-TiO2 and MnO2-SiC-TiO2 is 3.23 eV and 3.21 eV, respectively. After addition of MnO2 the band gap is slightly smaller than SiC-TiO2. Thus, the exposure to visible light increases the use of visible light and the activity of photocatalysis. As shown in Fig. 4(c), the EIS test result of the SiC-TiO2, MnO2-SiC-TiO2 nanocomposite electrode in the phosphate buffer solution (PBS). The high resistivity of those samples is readily visible. The MnO2-SiC-TiO2 composite has demonstrated low resistivity in comparison to the SiC-TiO2 sample. Thus, the MnO2-SiC-TiO2 composite has a large electron transfer carrier. By using photocurrent responses, the effectiveness of charge collection was demonstrated, and the investigation focused on the excitation, separation, transfer, and recombination of photogenerated charge carriers in the samples. Using several on-off light cycles of the periodic, the photocurrent measurement versus the time of various photoelectrodes was shown in Fig. 4(d, e). As shown in Fig. 4(d) that the photocurrent response of the SiC-TiO2 composite is higher current density than the MnO2-SiC-TiO2, and [Fig. 4(e)] nanocomposite sample due to the MnO2 could modify band structure of the SiC-TiO2 sample, altering the positions of the valence band and conduction band. However, the lower density of the MnO2-SiC-TiO2 nanocomposite has indicated that the increased surface area and improved light absorption to contribute the enhanced performance and efficiency of the photoelectrode applications.

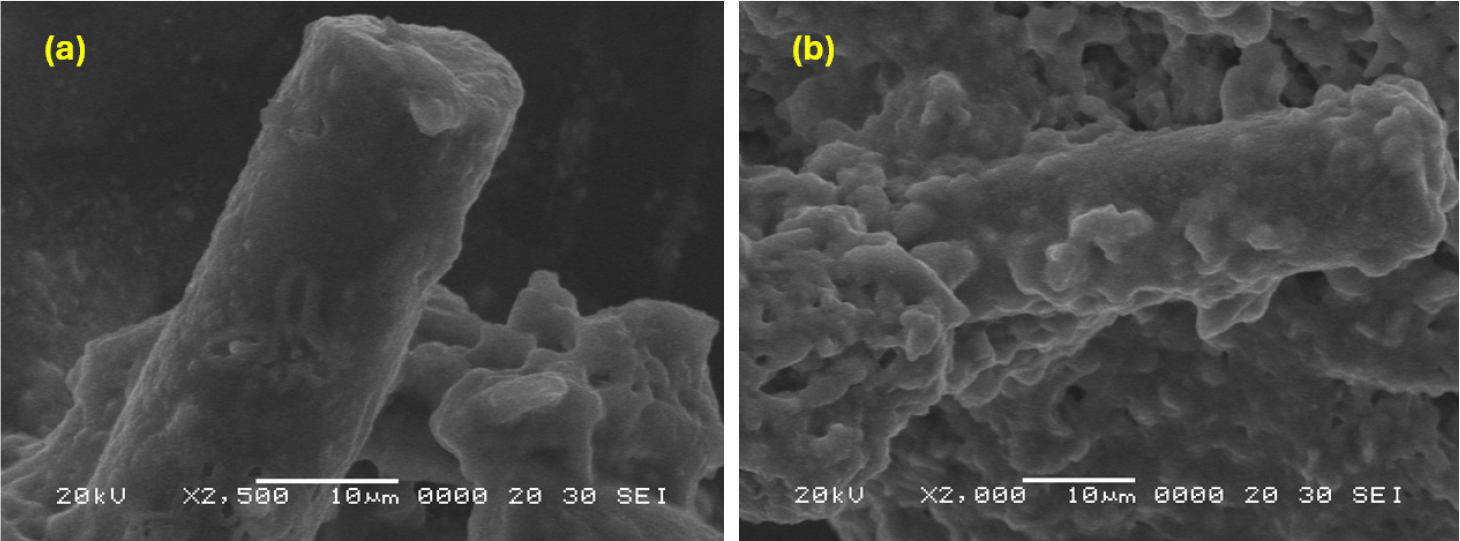


Fig. 5(a) illustrates the photocatalytic performance as evaluated by the MB dye degradation in the presence of visible light, which is triggered by TiO2, SiC and MnO2 composite. During the experiments with the MB solution of a catalyst, it was found that the decrease in MB concentration was mostly related to the photolysis effect delivered by visible light. The adsorption capacity of the MnO2 is higher than with SiC and TiO2 sample. Therefore, after binding MnO2 with SiC-TiO2 composite, its photocatalytic efficacy is higher compared with SiC-TiO2 composite. As shown in Fig. 5(b), we observed the photocatalytic degradation efficiencies of MnO2-SiC-TiO2 nanocomposites and SiC-TiO2 to learn more about the photocatalytic activity of the MB. Evidently, the MnO2-SiC-TiO2 nanocomposite exhibits a photocatalytic degradation efficiency that approaches almost 20 % after 120 min of irradiation, surpassing that of SiC-TiO2 composite. According to the data above, MnO2-SiC-TiO2 nanocomposites have superior photocatalytic decomposition activity and increased degradation efficiency. MnO2 may extend the light absorption range of the catalyst system. While TiO2 primarily absorbs UV light, MnO2 can absorb visible light. In Fig. 5(c), ln C/C0 is plotted versus t, where C denotes the MB concentration at time t and C0 is the MB concentration at initialization. The degradation process’s kinetics suit the pseudo-first-order kinetics model well. The logarithmic correlation was also found between the obtained kinetic constant and the concentration of MB and it has a good correlation of SiC-TiO2 and MnO2-SiC-TiO2 nanocomposite.

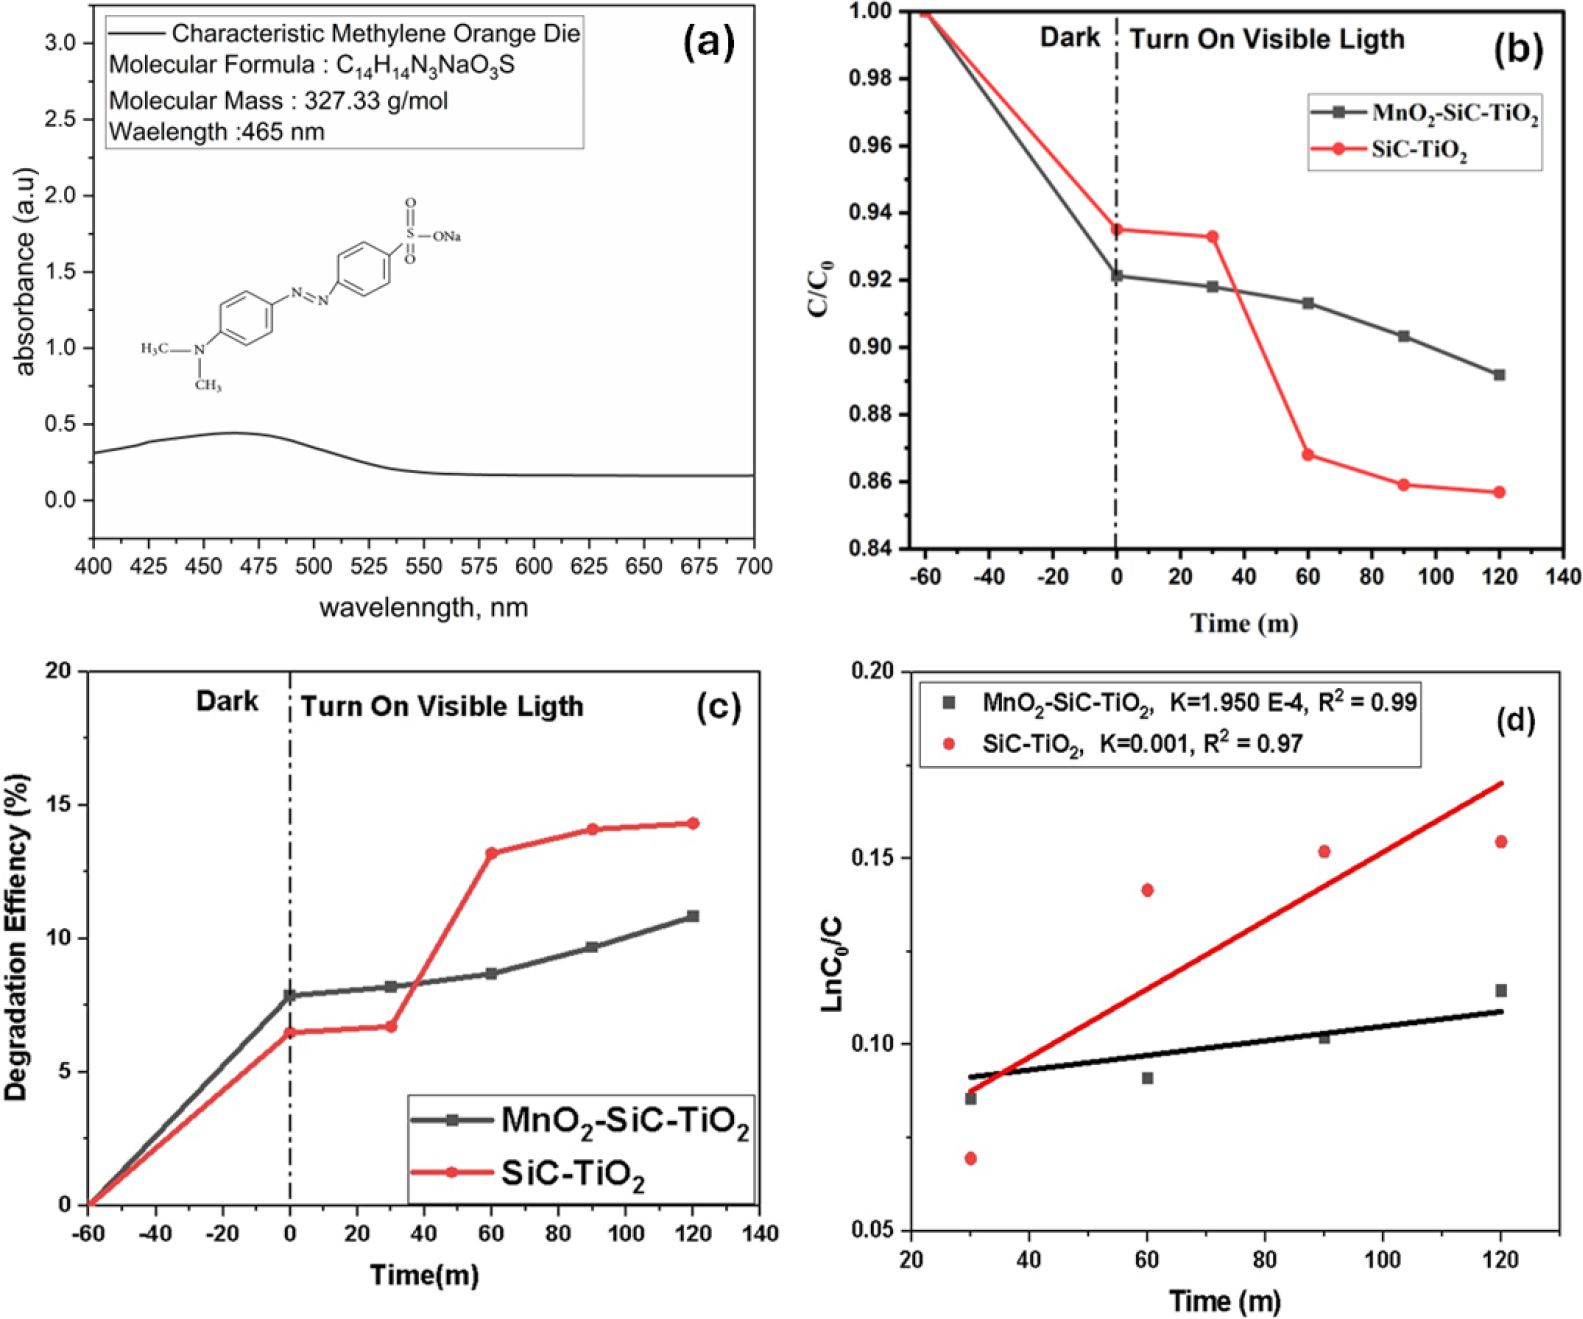
The degradation of the MO solution was chosen, as seen in Fig. 6(a), the distinctive absorption of the MO solution at a wavelength 465 nm was used to track the adsorption and photocatalytic degradation processes. The photocatalytic efficiency and the change in organic pollutant concentration (C/C0) together with the irradiation time over the SiC-TiO2 and MnO2-SiC-TiO2 composite in visible light. Regarding the irradiation time, C0 is the starting concentration and C is the current concentration. The outcomes are shown in Fig. 6(b); it can be observed that the SiC-TiO2 composite decreased in MO concentration within 120 min compared to the MnO2-SiC-TiO2 nanocomposite. The photocatalytic activities of photocatalysts under light irradiation were assessed using MO solution. As demonstrated in Fig. 6(c), after 20 min the SiC-TiO2 composite has changed in the MO adsorption rate, which indicates the highest photocatalytic efficiency, approximately 15 % than the MnO2-SiC-TiO2 composite. Fig. 6(d) illustrates that a good linear correlation of ln(C/C0) against time (0.99 < R2 < 1) were obtained, implying that pseudo-first-order kinetics govern the catalytic process. The plots performed it possible to determine the MO degradation reactions rate constant as well for the reaction catalyzed by SiC-TiO2 and MnO2-SiC-TiO2 composite.
In addition, photocatalytic activity of the MnO2-SiC-TiO2 nanocomposite was determined by different recycling analyzing the degradation of MB in the solution under UV illumination. Fig. 7(a) shows the relationship between Abs max (at 660 nm) and time (h) in the decomposition cycle test for the decomposition of MB by MnO2-SiC-TiO2 nanocomposites. From these graphs, it can be seen that the maximum value of absorbance decreases as the number of cycle tests increases. This can be explained by the blocking of pores on the photocatalyst surface within a short time. Regarding these results, SEM images after 3 cycles of decomposition on MB are shown in Fig. 7 (b, c). From these images, the surface shows a rough surface state that is completely different from the surface state before the photocatalytic test.
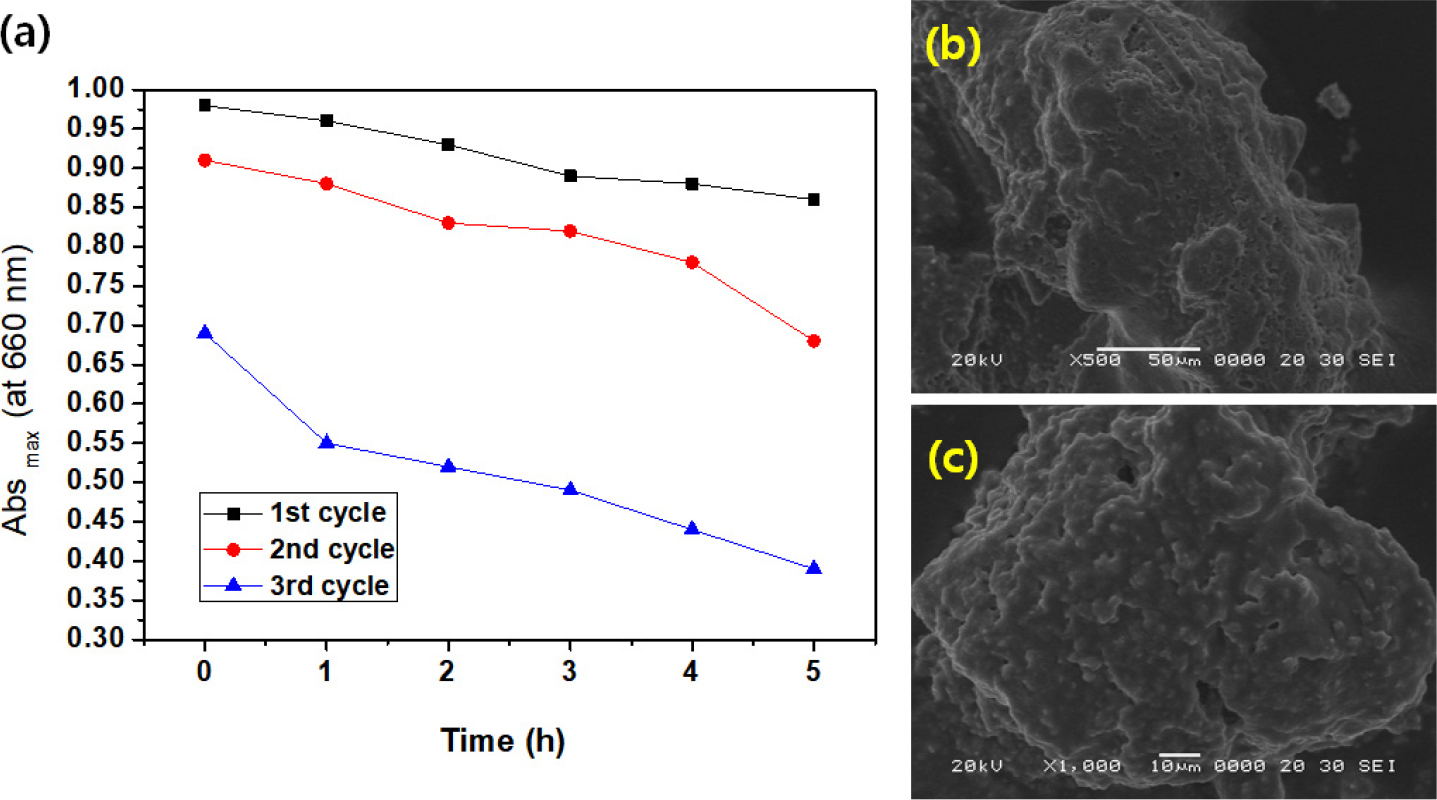
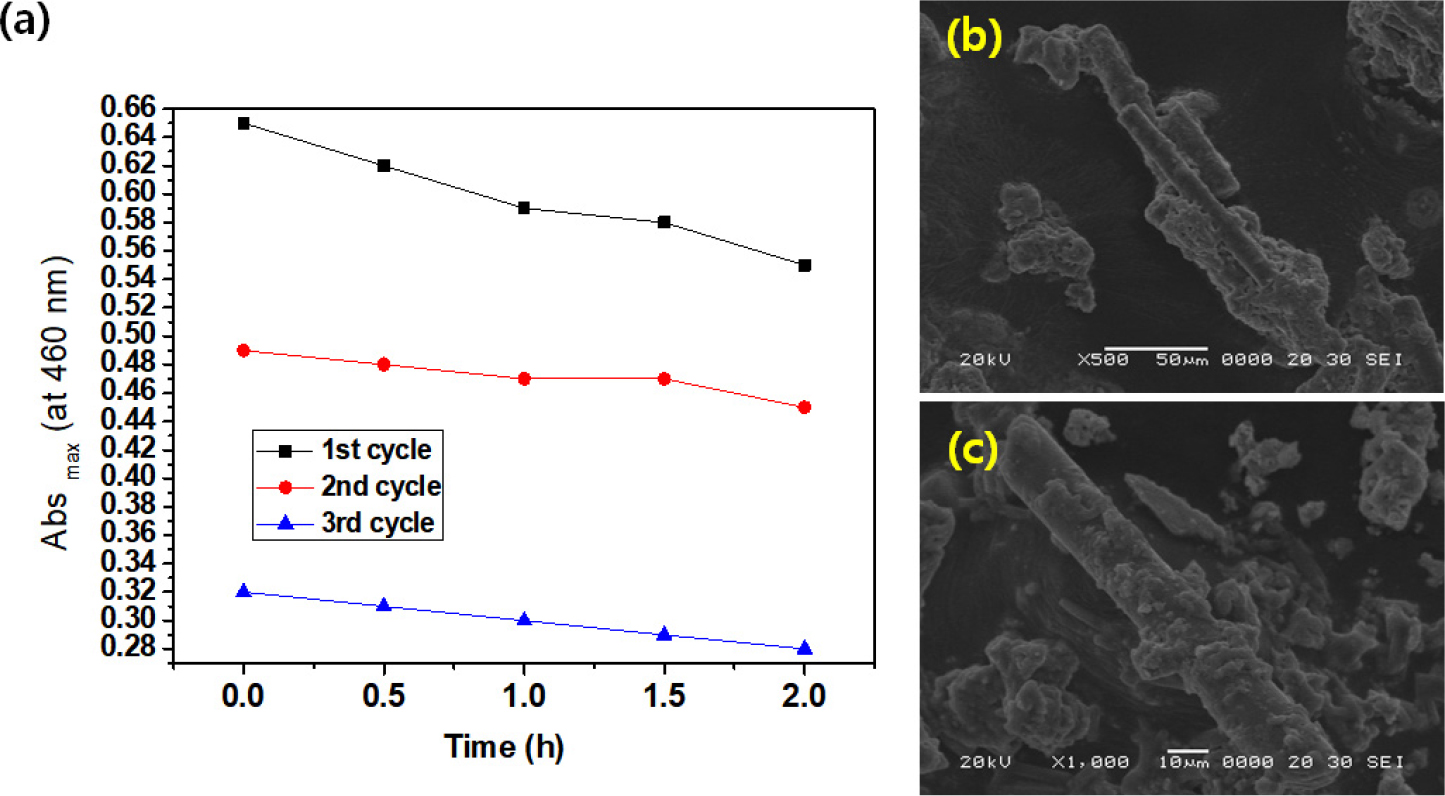
Fig. 8 shows the relationship between Abs max (460 nm) and time (h) in the decomposition cycle test for the decomposition of MO by MnO2-SiC-TiO2 nanocomposites. From these graphs, it can be seen that as the number of cycle tests increases, the maximum value of absorbance decreases rapidly. This can also be explained by the blocking of pores on the photocatalyst surface within a short time. In addition, the MnO2-SiC-TiO2 nanocomposites show poor efficiency in MO decomposition compared to MB decomposition. Regarding these results, SEM images after 3 cycles of decomposition for MO are shown in Fig. 8 (b, c). These can also be confirmed from the presented images of the rough surface state, which was completely different from the surface state before the photocatalytic test.
4. Conclusion
In this research, the MnO2-SiC-TiO2 nanocomposite used the hydrothermal method. The optimized photocatalysts were evaluated by photocurrent testing, UV-Vis DRS, XRD, TEM, EDS and SEM. The MnO2-SiC-TiO2 composite enhanced the photoelectric efficiency and visible light response. The photocatalytic degradation of MB and MO was selected as a standard reaction to compare the photocatalytic activities of MnO2-SiC-TiO2 and SiC-TiO2 composite, with finding showed that the MnO2-SiC-TiO2 nanocomposite exhibited the high efficiency in conveniently degrading of MB than that of MO. The additional characteristics of MnO2 make it an appealing photocatalyst that reacts to visible light. Therefore, we selected the MnO2-SiC-TiO2 nanocomposite for the photocatalytic degradation of these hazard dyes.
