

1. Introduction
Hydrogen energy from fuel cells is recognized as one of the most promising and cost-effective technologies, offering high efficiency and environmental friendliness.1,2,3,4) In Particular, solid oxide fuel cells (SOFCs) demonstrate high conversion efficiency through an electrochemical route.5,6,7) Yttria-stabilized zirconia (YSZ), known for its excellent O2- conductivity, as well as thermal, chemical, and mechanical stability, is widely employed as an electrolyte in SOFCs.1,2,3,4,5,6,7) Among the cubic, tetragonal, and monoclinic phases of YSZ compounds, cubic YSZ is commonly preferred in fuel-cell devices due to its rapid O2- diffusion and slow cation diffusion.8,9) However, the operating temperature of SOFCs remains relatively high, exceeding 650 °C.10) To achieve lower SOFC operating temperatures, a thin YSZ electrolyte composited of nano-scaled particles is required to enhance O2- mobility and gas tightness, thereby reducing ohmic losses in the devices.3,5,8) The successive ionic layer adsorption and reaction (SILAR) combined with a hydrothermal process can enable low-temperature deposition and crystallization of nano-materials.11,12,13,14,15) In the SILAR process, involving the adsorption, rinsing, precipitation reaction, and rinsing of cations, water, anions, and water constituents on a substrate, respectively, a cycle can be completed. To achieve the desired thickness of crystallized thin films, certain cycles can be repeated with an additional post-hydrothermal annealing process. In previous study, monoclinic and tetragonal phases of ZrO2 films were fabricated on Si3N4/Si substrates by SILAR deposition, utilizing Zr4+ and OH- solutions as cation and anion constituents, followed by post-hydrothermal and furnace annealing at 473 K and 923 K, respectively.11) The SILAR process, coupled with the hydrothermal dehydration annealing, offers a significant opportunities for generating nanocomposite crystallized materials at low temperatures. However, the diffusion layers formed by spectator ions and rinsing water during the SILAR process can lead to surface cracks on the substrates. In this study, crack-free thin films of crystallized YSZ nanoparticles were successfully fabricated using an enhanced deposition process with incorporating air spray steps, termed the SILAR-air spray plus (SILAR-A+) method, followed by post-hydrothermal and furnace annealing.
2. Experimental Procedure
The YSZ powder was prepared using 0.06 M ZrOCl2 ∙ 8H2O (40 mL, 36 mL, 32 mL, and 28 mL), 0.06 M Y(NO3)3 ∙ 6H2O (4 mL, 8 mL and 12 mL) and 0.06 M NaOH (60 mL) solutions through a hydrothermal technique at 175 °C for 18 h. YSZ films on glass or Si substrates were then fabricated using aqueous solutions of 0.06 M Y(NO3)3 ∙ 6H2O (Alfa, 99.9 %), 0.06 M ZrOCl2 ∙ 8H2O (Alfa, 99.9 %), 0.06 M NaOH (Alfa, 98 %). The substrate surface pre-treatment involved a 10 minutes UVC exposure using UV system (Omniscience, UVC-150). In the SILAR process, substrates were affixed to the arm of a Gilson 223 XYZ robotic sample changer for adsorption (0.1 min), rinsing (0.1 min), and precipitation (0.1 min) reactions.11) In the SILAR-A+ process, an air spraying step (6 seconds) with air speed of 150 m/s was incorporated into the last stage of the SILAR process. Films formation involved repeating the cycle from 300 to 900 times based on a cation-rinsing-anion-reaction-rinsing-air spray sequence. Phase identification was conducted using a Shimadzu XRD-6000 powder diffractometer (Cu-Kα radiation). High-resolution synchrotron X-ray powder diffraction data were collected at PLS-II 6D UNIST-PAL beamline of Pohang Accelerator Laboratory (PAL). For the crystallization process, the hydrothermal synthesis was conducted at 175 °C for 18 h, followed by furnace annealing in air at 500 °C for 3 h and 1,000 °C for 3 h. The surface morphology of YSZ films was observed using scanning electron microscopy (SEM, Hitachi, TM3030plus). The calculation of crack and crack-free SEM images of films was used ImageJ program.
3. Results and Discussion
In previous study, crystalline films of ZrO2 were fabricated using SILAR method, employing Zr4+ and OH- aqueous solution as the sole cation and anion constituents, respectively.11) For Y3+-doped ZrO2 (YSZ) nanoparticles, two Y3+ and Zr4+ aqueous solutions (0.06 M) as mixed cation constituents, in the ratios of 4 mL/36 mL, 8 mL/32 mL, and 12 mL/28 mL, were used in this study, combining hydrothermal annealing. Fig. 1 illustrates the calculated X-ray powder diffraction (XRD) patterns of monoclinic ZrO2 (ICSD 68782), tetragonal and cubic YSZ phases (ICSD 62994 and 60605), along with the obtained XRD patterns of ZrO2 and YSZ nanoparticles. When using a simple Zr4+ aqueous solution, x is 0, and the mixed volumes of Y3+/Zr4+ solutions (4 mL/36 mL, 8 mL/32 mL, 12 mL/28 mL) were specified x = 0.1, 0.2, and 0.3 in the formula. The XRD pattern of Zr1-xYxO2-0.5x (x = 0) revealed two phases, monoclinic and tetragonal ZrO2 material. However, when x = 0.1, 0.2, 0.3, the monoclinic phase was not observed in the XRD patterns, indicating the incorporation of Y3+ ions resulting in the cubic yttria- stabilized zirconia (YSZ) phase. The XRD patterns of Y3+-doped ZrO2 samples exhibited slight peak shifts and centrosymmetric shapes, as shown in Fig. 1. Further phase analysis using synchrotron XRD patterns in Fig. 2 demonstrated that ZrO2 and YSZ (8 mL 0.06 M Y3+/32 mL 0.06 M Zr4+) films on Si wafer, prepared by SILAR method with 900 cycles and post-furnace annealing at 1,000 °C for 3 h in air, still exhibited a monoclinic phase of ZrO2. The monoclinic phase of ZrO2 gradually transformed into tetragonal phase at high temperatures. However, the major phase of ZrO2 was tetragonal, and the XRD patterns, particularly at 2θ = 29~31° and 58~61°, shifted to lower angles, corresponding to Bragg reflections, and exhibited centrosymmetric peak shapes in YSZ compound. Fig. 3 presents the calculated XRD patterns of (a) monoclinic ZrO2 and (b) tetragonal and (c) cubic YSZ, along with the obtained XRD patterns of YSZ films (900 cycles) subjected to (d) post-hydrothermal annealing at 175 °C, (e) post-hydrothermal annealing followed by continuous heating in air at 500 °C, (f) post-furnace annealing at 500 °C in air. The X-ray diffractions obtained after hydrothermal treatments in Fig. 3 (d, e) consistently showed cubic X-ray diffraction, with peaks indicating the impurity peaks of Y2O3. The impurity peak of Y2O3 was not clearly observed in the films with just furnace annealing because it is expected that the sequential reaction of hydrothermal annealing plays a significant role in crystallization of Y2O3. The hydrothermal annealing As Y3+ and Zr4+ aqueous solutions can be precipitated by pH-driven solidification, the un-reacted Y3+ solution of the cation constituents comprising 20 % Y3+ was oxidized.


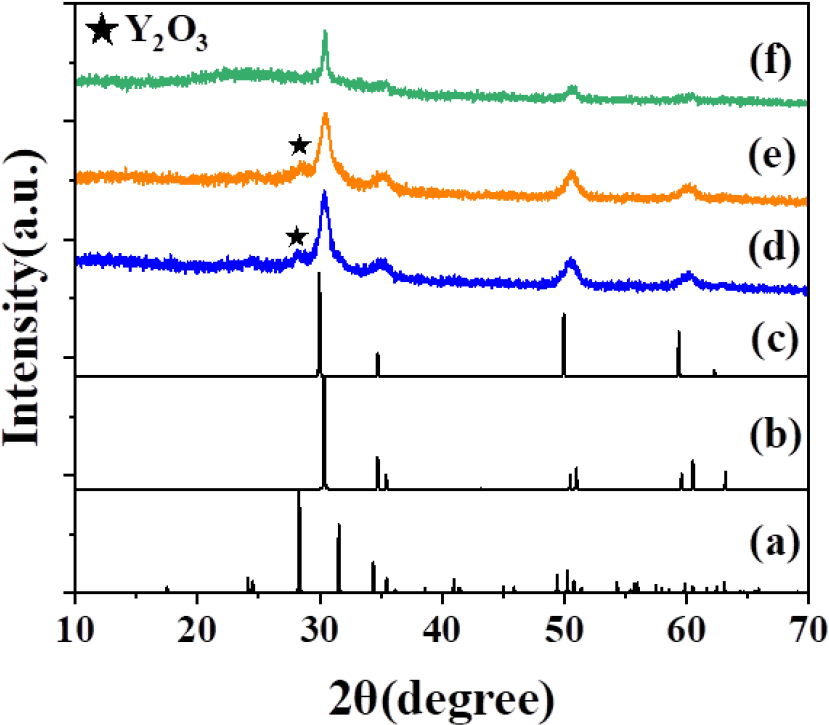
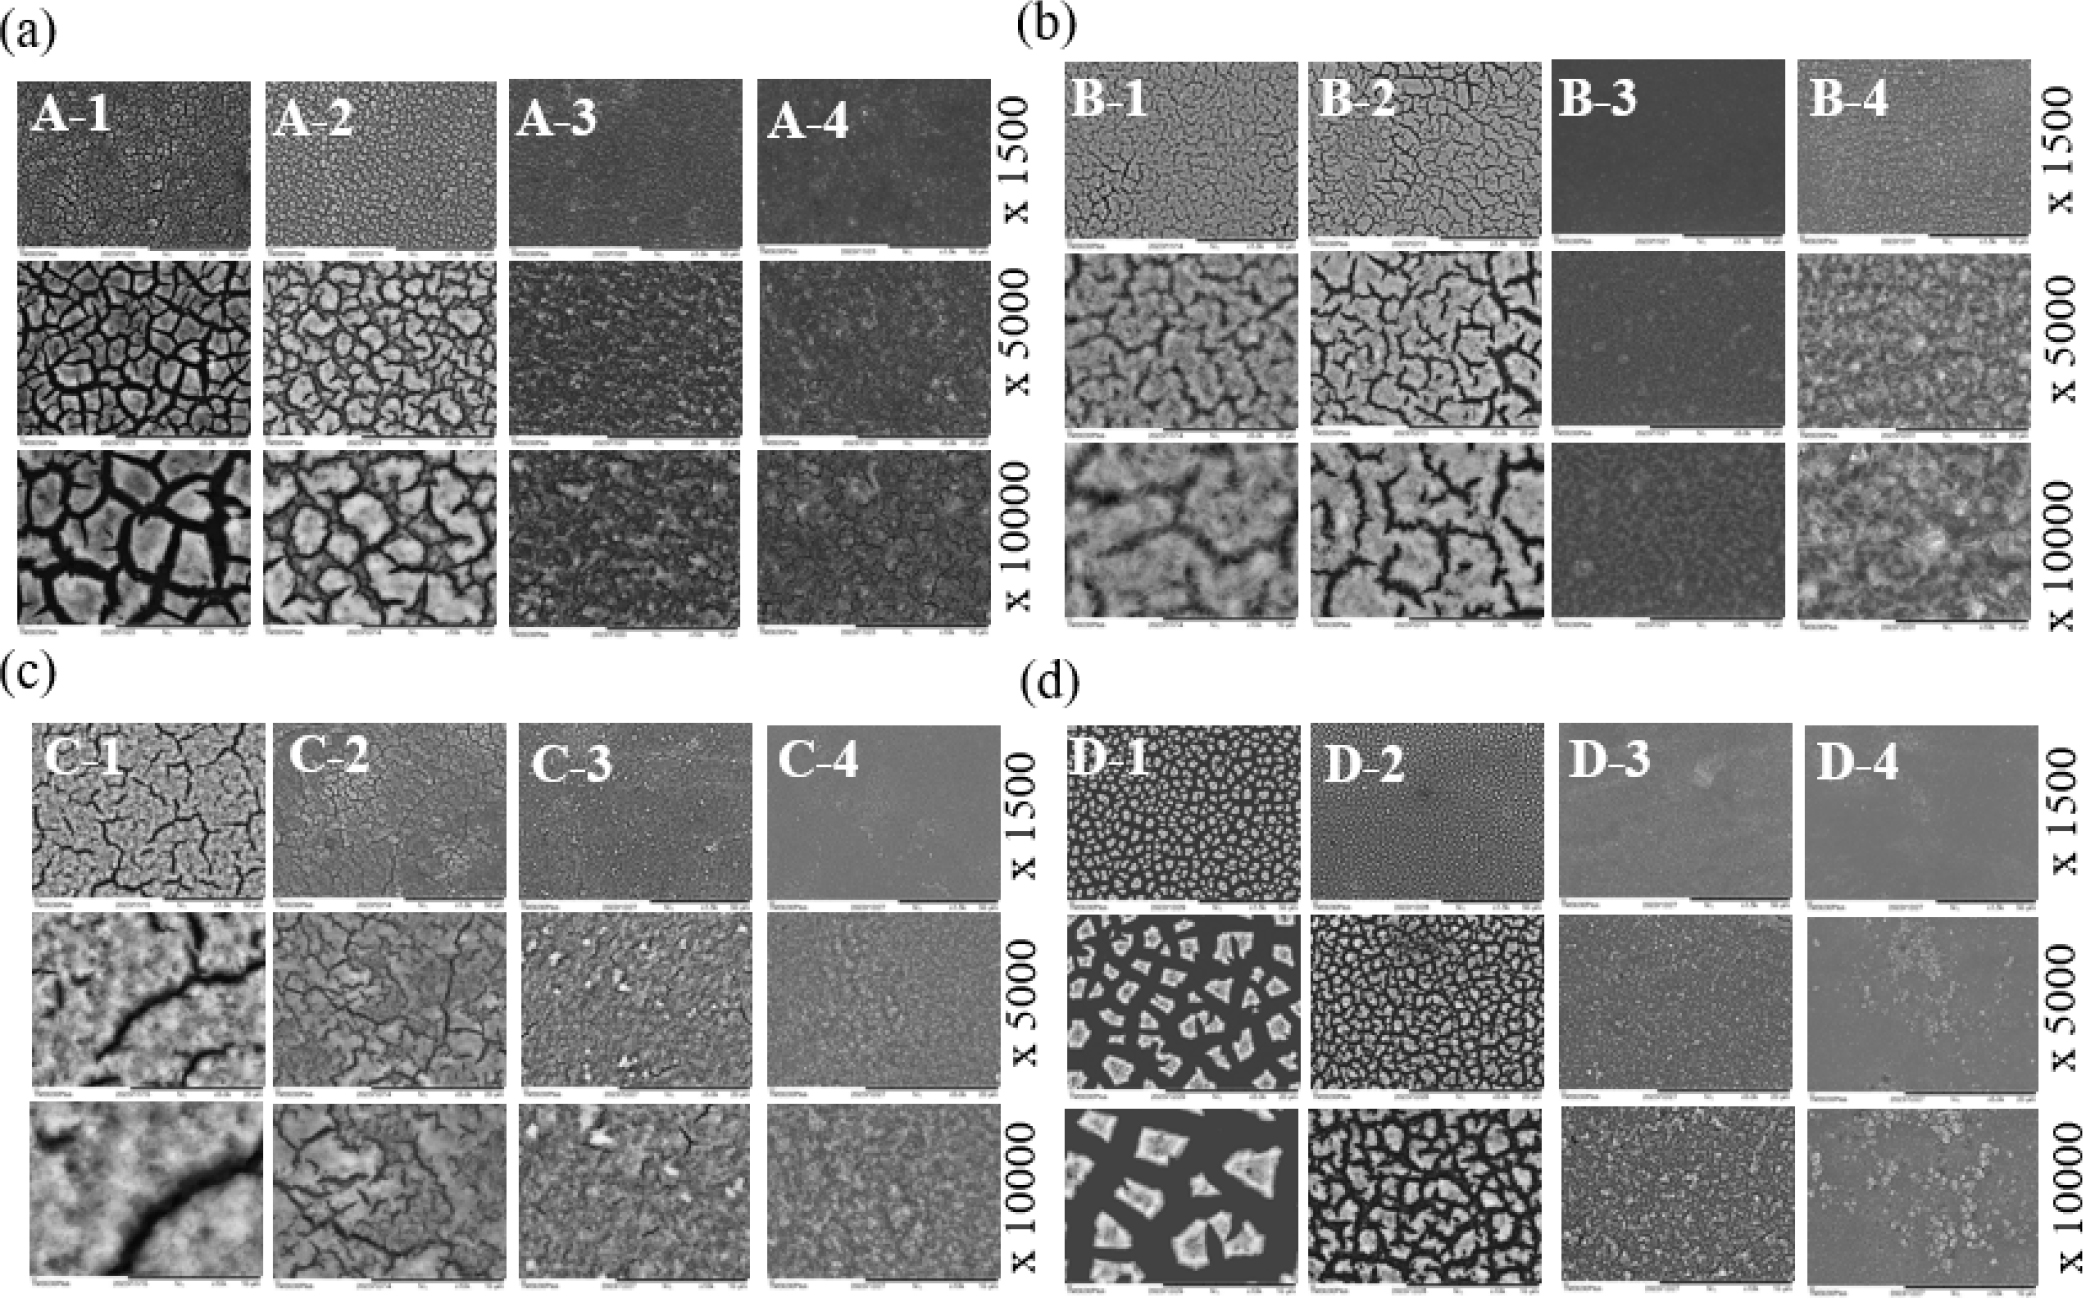
Fig. 4 illustrates the SILAR and SILAR-A+ methods. The substrate first moved to the Y3+/Zr4+ cation solution for cation adsorption onto the surface, then transferred to a rinsing step in water to remove diffusion layers such as spectator anions (NO3-, OCl24-) or H2O, relocated to OH- anion solution for a precipitation reaction at the surface, and then transferred to the water vessel again for additional rinsing to eliminate further diffusion layers, including spectator cation (Na+). This constitutes a cycle of the SILAR process. In the SILAR process, the challenge lies in the persistence of diffusion layers during cycles, leading to cracked and non-dense surfaces. To address this issue systematically, the SILAR-A+ process introduces an air-spray step to completely remove the diffusion layers containing un-removed spectator ions and excess water on the substrate. The air-spray process can be performed with an additional steps. This cycle of depositing, rinsing, and air-spraying is repeated many times to achieve the desired film thickness. Fig. 5 displays YSZ thin films prepared by SILAR (A,B,C,D-1) and SILAR-A+ (A,B,C,D-2,-3,-4) methods using of 300 cycles. SEM images of A, B, C, D represent YSZ films without post-annealing, with additional post-hydrothermal annealing at 175 °C, with post-hydrothermal annealing at 175 °C and subsequent furnace annealing at 500 °C, and with post-furnace annealing at 175 °C, respectively. A, B, C, D-2,-3,-4 in SILAR-A+ methods indicate additional intermediate air-spray steps with 3, 6, 12 times, respectively. Each SEM image is magnified by 1,500, 5,000, and 10,000 times, enabling a clear observation of surface cracks. Hydrothermal post-treatment accelerates the decrease in surface cracking, as shown in Fig. 5(b, c). In the SILAR-A+ process, an increase in the number of air-spray steps results in a clear reduction in surface cracking, as observed in -2, -3, and -4 in all post-annealing processes, even in as-prepared films. This reduction is attributed to the removal of diffusion layers, including spectator ions and water, from the surface through air-spraying during the substrate’s cation, anion, and rinse processes, leading to effective and uniform precipitation reactions. Fig. 6 presents crack and crack-free SEM images in white and black colors and in bar graphs, comparing the surface cracks of YSZ thin films. Through 0, 3, 6 and 12 times of air-spray steps, a distinct decrease in surface cracks from 34 % to 4 % and 69 % to 10 % in as-made and furnace annealed YSZ films is evident, respectively, as shown in Fig. 6. Even in the SILAR-A+ combining post-hydrothermal or/and subsequent furnace annealing, further decreases of surface crack, resulting in crack-free surfaces, occurred with the addition of air-spray steps. The changeover from the SILAR process to the SILAR-A+ process resulted in a significant reduction in surface cracking. Fig. 7 presents cross-sectional SEM images, revealing the thickness of YSZ thin films with bar graphs. The cross-sections of A-1, B-1, and C-1 films manufactured through the SILAR process showed sizes of 1.44 µm (1,400 nm), 3.21 µm (3,200 nm), and 1.33 µm (1,330 nm), respectively. The as-made film (A-1) was dried in air after the SILAR process, while the film (B-1) heated by hydrothermal annealing without a drying process exhibited YSZ crystallization with hydroxyl (-OH) layers, resulting in a thick cross-section in SEM image. The thickness of the film (C-1) decreased due to the removal of hydroxyl and water layers by subsequent furnace heating at 500 °C. The thickness of C-1 films produced by SILAR process and post-thermal treatments and C-2, -3, -4 films produced by SILAR-A+ process, were approximately three times less thickness than that of the SILAR process. A gradual decrease in film thickness was observed with an increase in air-spray process steps, consistent with the crack-free surface results. This indicates effective removal of diffusion layers occurred during cation adsorption, anion reaction, and rinsing process.


4. Conclusion
This study highlights the advancement of a technology capable of producing crack-free YSZ thin films composed of nanoparticles through the SILAR-A+ process, followed by hydrothermal and furnace heat treatments. The significance of thin and crack-free surfaces in the manufacturing of YSZ solid electrolytes for SOFC is emphasized. Cracks in the solid electrolyte can disrupt proper fuel cell function by causing short-circuit currents between the two electrodes. The anticipated future applications in SOFCs involve adjusting the thickness of crack-free YSZ films to decrease operating temperature and increase efficiency.
