

1. Introduction
2. Experimental Procedure
2.1. Materials
2.2. Preparation of the Sunblock materials (HAp, ZnO, and TiO2)-water nano sol
2.3. Preparation of Sunscreen Samples
2.4. UV absorbance test
2.5 SPF (Sun Protection Factor) test
2.6. White turbidity test
3. Results and Discussion
3.1. XRD and EDS of Hydroxyapatite
3.2. Particle size and UV absorbance of Sunblock materials (HAp, ZnO and TiO2)
3.3. UV absorbance of Sunblock materials according to HAp ratio
3.4. White turbidity
3.5. SPF (Sun Protection Factor)
4. Conclusion
1. Introduction
Exposing ultraviolet (UV) rays from the sun is very harmful and it can cause skin trouble such as sunburn and erythema. The UV rays are divided into three types in accordance with wavelength: UVA (320~400 nm), UVB (280~320 nm) and UVC (200~280 nm). In these UV rays, only UVA and UVB are harmful because UVC is mainly blocked by ozone layer. UVA can cause photoaging and photocarcinogenesis, while UVB can damage to DNA and RNA.1,2,3,4,5)
To protect skin from these harmful UV rays, people use the sunscreen that can block UVA and UVB. PA means UVA protection level and sun protection factor (SPF) means UVB protection level. Previous sunscreen was manufactured with ZnO and TiO2 as sun block materials. However, ZnO and TiO2 has disadvantage that show white turbidity effect. In certain research, to terminate white turbidity effect, nano sized ZnO and TiO2 were used as sunblock materials. But nano sized ZnO and TiO2 (under 100 nm) can cause photo toxicity when it penetrate human dermis.6,7,8,9,10,11) Hydroxyapatite (HAp) is one of the calcium phosphate compound and it is main component of the bone. Therefore, it is biocompatible and non-toxic. HAp is widely used as bone graft materials and also used in air filter.12,13,14) HAp is also used as anti-aging materials.15) In this study, we manufactured sunscreen with lotion base and nano sized HAp (about 241.9 nm). First, to evaluate differences between ZnO, TiO2, and HAp, nano sol of each sunblock materials were manufactured and their particle size, UV absorbance was measured. The sunscreen lotion base (LB) was manufactured as lotion, with some oil and water. Composites of various HAp-water solutions and LB concentrations were fabricated and their UV absorbance and SPF were measured. Skin tests of each samples were progressed to compare White turbidity. To evaluate its possibility as sunscreen, we optimized ratio of composites and compared with other sunscreen product.
2. Experimental Procedure
2.1. Materials
HAp (Ca:P ratio = 1.67) powder was synthesized with CaCO3 and H3PO4 using liquid state methods. First, CaCO3 was mixed with distilled water, and stirred for 5 h. H3PO4 was slowly dropped into the CaCO3 solution and stirring was continued for 12 h. After reaction, the solution was dried at 100 °C, and the obtained dry powder was sintered at 1,350 °C. ZnO and TiO2 powders and other oils (Jojoba oil, Black sesame oil, Emulsifying Wax, Olive Wax, and Shea butter) were purchased from Bubble Bank Co., Korea. Glycerin and ethanol (99 %) were purchased from Daejung Chemical Co., Korea.
2.2. Preparation of the Sunblock materials (HAp, ZnO, and TiO2)-water nano sol
HAp-water nano sol was produced with a 1:1 ratio of HAp and deionized (DI) water, respectively. HAp powder (200 g), DI water (200 g), and zirconia balls (800 g) were ground in an attrition milling machine (Coreakiyun, Korea) at 450 rpm for 4 h. ZnO-water nano sol and TiO2-water nano sol were prepared in same condition. Particle size analyzer (ELS-Z, Otsuka Electronics, Japan) was used to analyze the average particle size of each nano sol.
2.3. Preparation of Sunscreen Samples
Sunscreen samples were made by mixing lotion base and HAp-sol. First, lotion bases were mixed with oil base and DI water at 70 °C as shown in Table 1. To evaluate the effect of the HAp concentration of the sunscreen, various weight percentages of HAp (2, 4, 6 and 10 wt%) were added to LB, as shown in Table 2. In this mixing process, water in LB was removed to the same extent as the amount of water added to HAp-sol. The mixing was conducted for 1 h using a paste mixer at the 600 rpm.
Table 1.
Lotion base preparation.
| Lotion base materials | Amount (g) | Temperature (°C) |
| Jojoba oil | 2.00 | 70 |
| Black sesame oil | 1.25 | 70 |
| Emulsifying Wax | 0.25 | 70 |
| Olive Wax | 0.75 | 70 |
| Shea butter | 0.75 | 70 |
| Glycerin | 0.75 | 70 |
| DI Water | 19.25 | 70 |
| Total | 25 |
Table 2.
Samples in accordance various material ratio.
| Sample | LB (g) | HAp in HAp-sol (g) |
| LB (0 %) | 20.0 | 0 |
| 2 % | 19.5 | 0.5 |
| 4 % | 19.0 | 1.0 |
| 6 % | 18.5 | 1.5 |
| 10 % | 17.5 | 2.5 |
2.4. UV absorbance test
The UV absorbance tests of sunblock materials (HAp, ZnO and TiO2) were measured. And to evaluate the effect of HAp as sunblock materials, UV absorbance measurements (280~400 nm) were performed with UV-vis spectrometer (Optizen2120UV, Mecasys, Korea). Samples (LB, 2 %, 4 %, 6 %, 10 %) were diluted to 1/103 with ethanol before the measurement.
2.5 SPF (Sun Protection Factor) test
SPF refers to the index that represents the UVB-blocking efficacy of a sunscreen. A higher SPF value indicates a longer duration of protection against UVB exposure. It is expressed as a number (e.g. SPF 30, SPF 50), and larger values correspond to stronger UVB-blocking performance. Samples (LB, 2 %, 4 %, 6 %, 10 %) were applied on the transpore tape (2 µl/cm2) and maintained at 25 °C for 15 min. After that, SPF test was performed on samples applied to transpore tape using a Sunscreen Analyzer (SPF290, Solar Light, USA).
2.6. White turbidity test
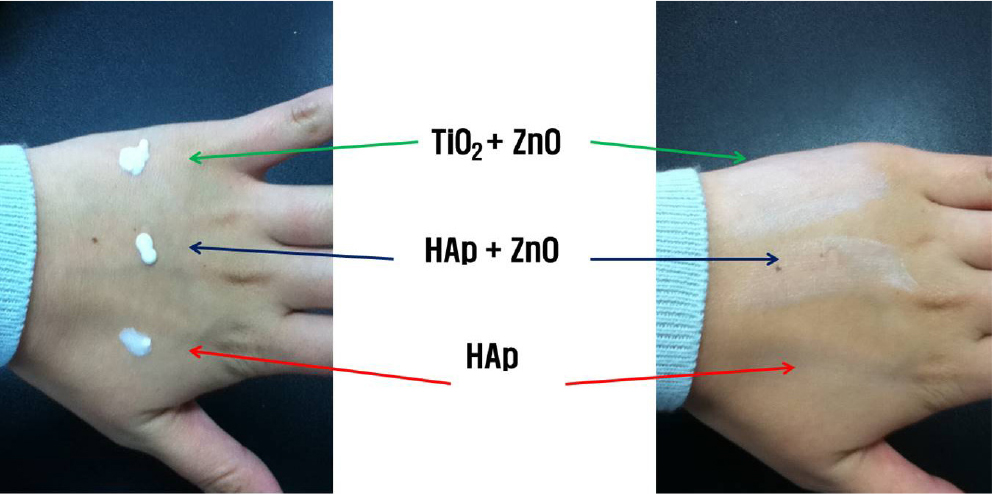
Whitening (white cast) in sunscreens is primarily caused by inorganic UV filters such as zinc oxide and titanium dioxide. These reflect not only UV light but also visible light, resulting in a whitish appearance on the skin. The degree of whitening is commonly evaluated by observing changes in skin color after topical application. In this study, the white cast was visually assessed according to the amount of added HAp. The samples (TiO2+ZnO, HAp+ZnO, HAp) and lotion bases (Table 1) were mixed and applied outside of hands. We observed white turbidity of samples with the visual inspection.
3. Results and Discussion
3.1. XRD and EDS of Hydroxyapatite
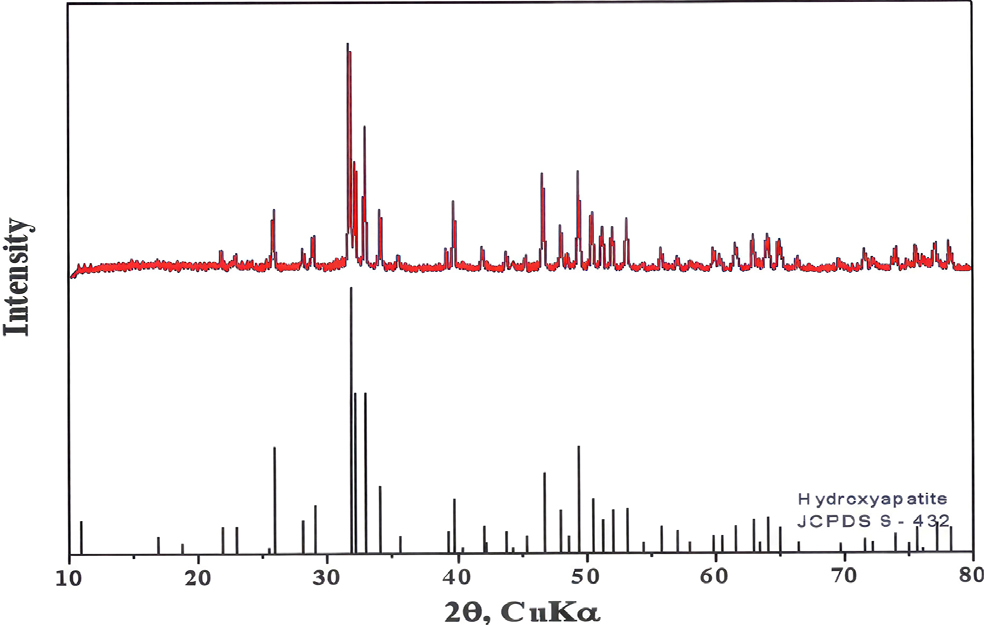
Fig. 1 and Table 3 show X-ray diffraction (XRD) and energy dispersive X-ray spectroscopy (EDS) results of synthesized HAp. The main peak of the hydroxyapatite powder was found at 31.8°, and all peaks were found to be hydroxyapatite crystals by JCPDS card No. 9-432 (Fig. 1). The EDS results for quantitative analysis of Ca and P also reveal that the molar ratio of Ca/P is 1.67 (Table 3).
3.2. Particle size and UV absorbance of Sunblock materials (HAp, ZnO and TiO2)
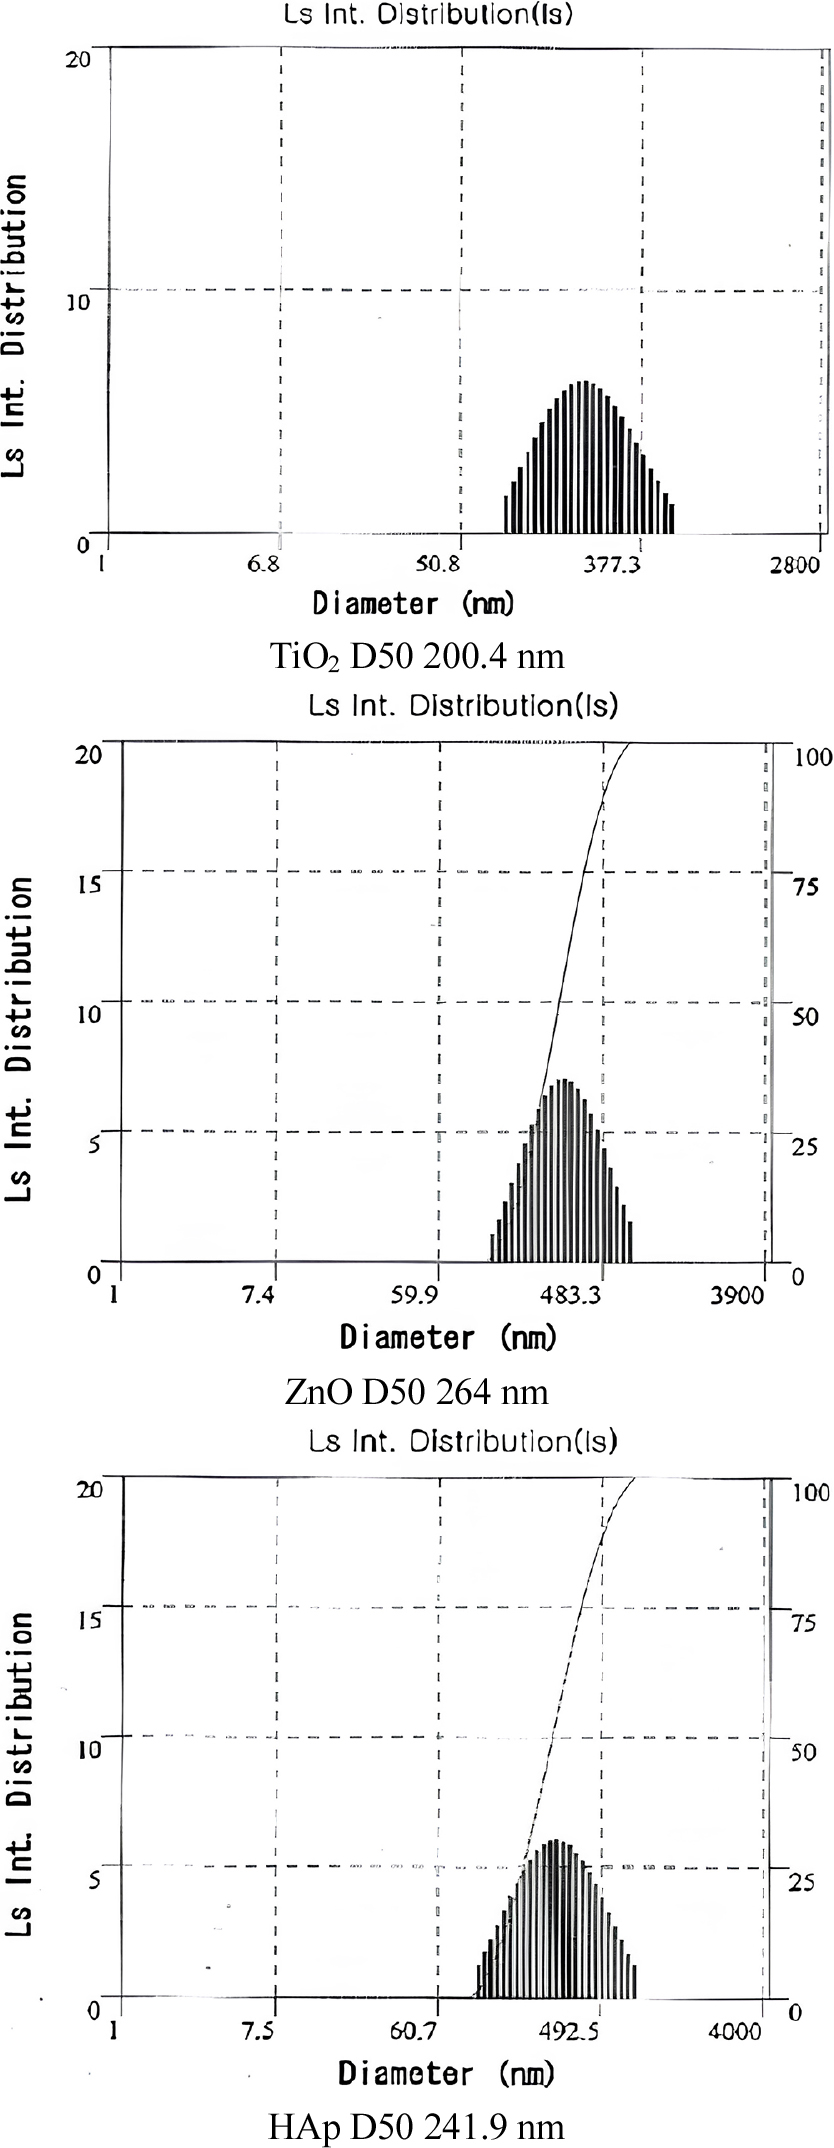
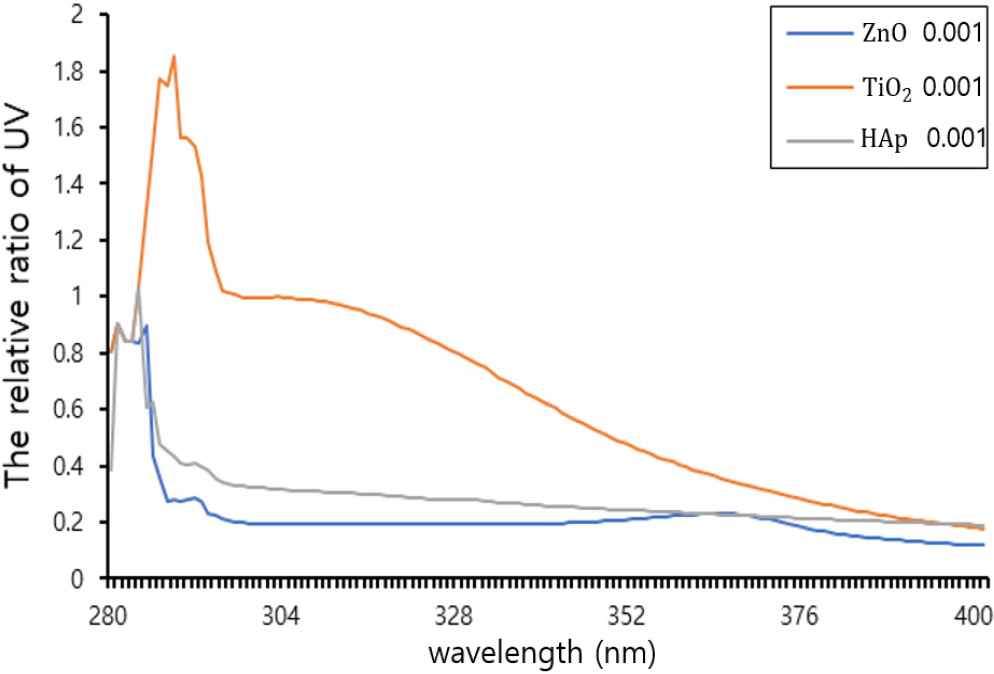
The average particle sizes of sunblock materials (HAp, ZnO and TiO2) were measured by PSA (Fig. 2). The result is TiO2 (avg. 200 nm), ZnO (avg. 264 nm) and HAp (avg. 242 nm). With these particles, the relative UV cut rate of TiO2 and ZnO was compared, which are used as HAp and weapons sunscreen respectively. As a result, HAp was found to have potential applicability as sunscreen. UV rate exhibited different patterns depending on the materials. That is, the degree of light scattering varies depending on the specific material. The results of comparing the relative blocking rate, revealed as follows Fig. 3. In these results, the UV ratio of TiO2 (1.9) was higher than those of ZnO (0.9) and HAp (1.0) but UV-blocking ability of HAp was similar to ZnO. Furthermore, irradiated TiO2 causes oxidative damage of nucleic acid in cells and strand breaks in isolated DNA. Therefore, we used HAp instead of TiO2 in the sunblock material.
3.3. UV absorbance of Sunblock materials according to HAp ratio
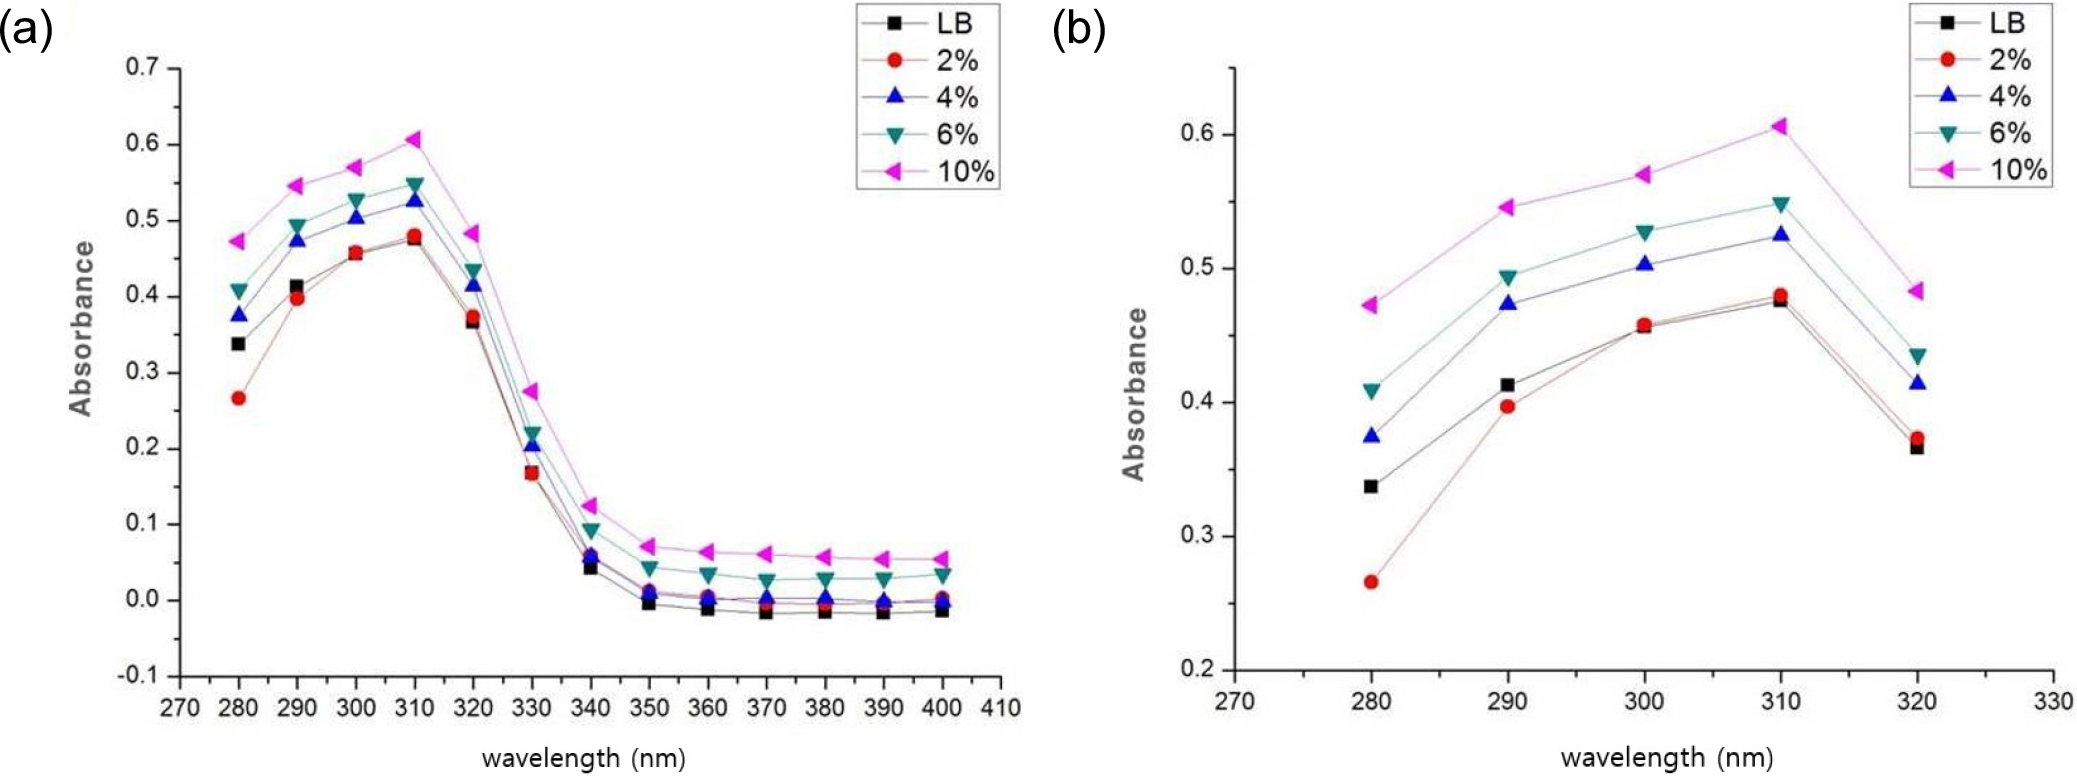
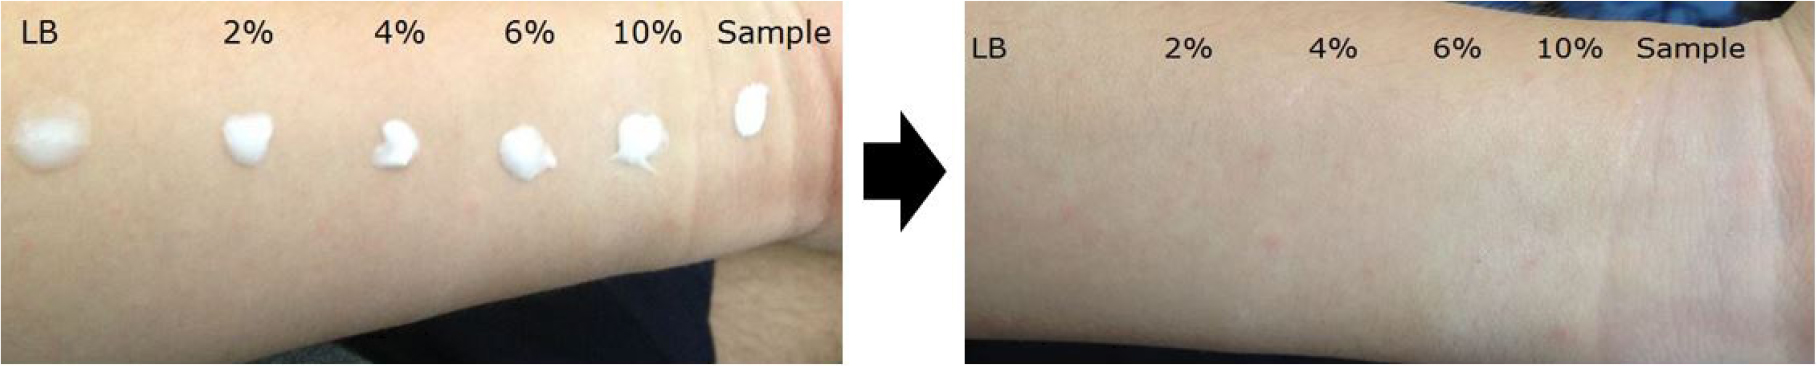
UV absorbance of fabricated sunblock was measured by UV-Vis. In Fig. 4, UVB area (280~320 nm) showed UV block. At a wavelength of 310 nm, the samples containing 6 % and 10 % HAp showed average absorbance values of 0.54 and 0.60, respectively. A higher HAp ratio resulted in increased UV absorbance. In the case of mixture with water, sample showed the same appearance. Therefore, HAp has the ability of sunblock.
3.4. White turbidity
Fig. 5 presents the whitening effect according to the amount of HAp added. Notably, no visible white cast was observed upon visual inspection. Fig. 6 shows white turbidity. With the naked eye, TiO2+ZnO and HAp+ZnO samples showed white turbidity. But the HAp sample does not show white turbidity. In this result, sunblock with HAp did not have white turbidity compared to TiO2, ZnO. Upon this result, it can be inferred that the ordinary sunblock with TiO2 and ZnO has definitive turbidity. So, it is possible to use the HAp instead of TiO2 and ZnO.
3.5. SPF (Sun Protection Factor)
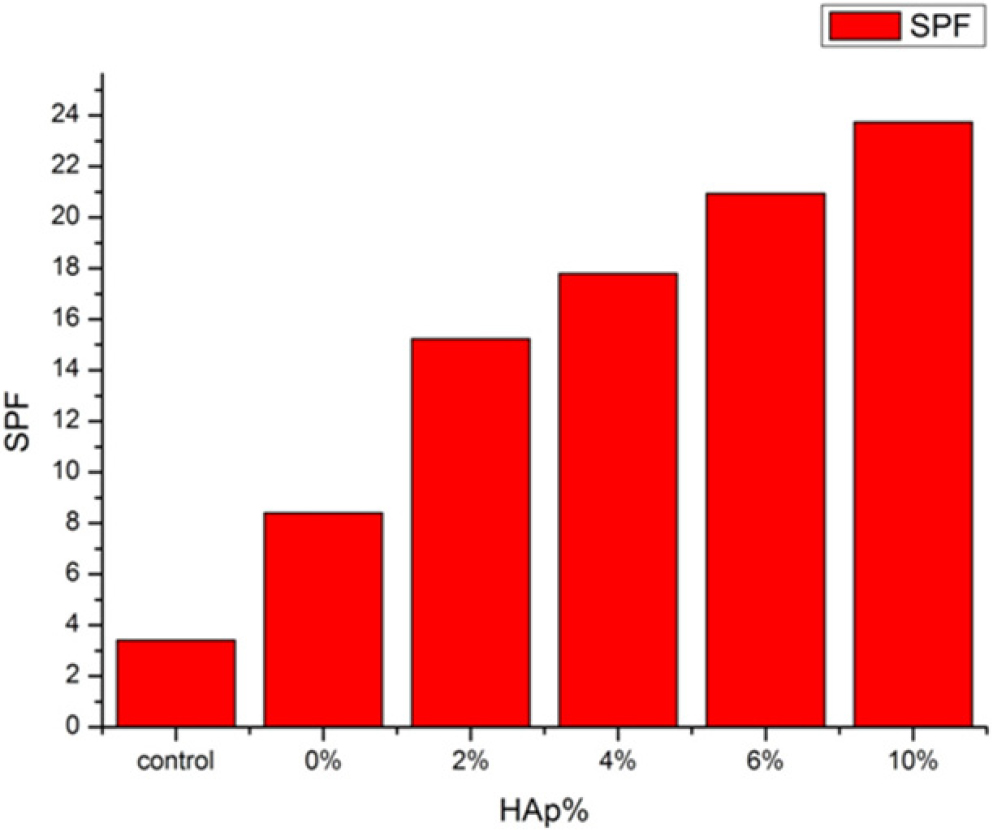
Fig. 7 is the average result of SPF obtained from six repeated measurements by SPF 290. In general, SPF of control sample was 4. Therefore, all samples exhibited relatively low value. In 0 % addition of HAp, SPF was 8. The reason for this result is that other oil had function as organic blocker. In 2 % addition of HAp, SPF showed drastic increase. Other samples showed same increasing range. Therefore, 6 % addition of HAp is the most logical content regarding the price. At this point, the SPF value was approximately 20 on average, corresponding to about 95 % UV protection, indicating that it is suitable for daily use.
4. Conclusion
Sunblock was fabricated by using HAp, TiO2 and ZnO. In the relative ratio of UV, TiO2 (1.9) was higher than those of ZnO (0.9) and HAp (1.0). At the same time, HAp and ZnO had 1 and 0.9. UV absorbance of fabricated sunblock showed high absorbance as HAp concentration increased. Therefore, sunblock ability showed an increase. On the basis of this result, sunblock was made by changing of HAp ratio. Over the 4 % addition of HAp, SPF value was over 15. The value of 15 corresponds to 95 % UV block. Therefore, 6 % addition of HAp have enough ability. Comparing the turbidity of ordinary sunblock with fabricated sample, ordinary sample had turbidity. Considering all the factors, above 6 % ratio was the best. In addition, considering that HAp has effect of UV block ability, sunblock with HAp have possibility of cosmeceutical.
