


1. Introduction
According to United Nations’ report, currently 20 % of the world has experienced a serious water shortage. In 2025, this problem might be getting worse.1) Although 70 % of the earth is water, only 2.5 % is fresh water on earth. Furthermore, most of fresh water is glaciers and it is left only 0.8 % of fresh water on the ground to be used. To solve this problem, seawater desalination had been employed based on thermal processes such as multi effect distillation(MED) and multi stage flash(MSF), but in recent years, reverse osmosis(RO) is being widely used and expected to double the production from 2007 to 2015.2,3) However, 61 % of seawater desalination are still using thermal processes to produce 44.1 Mm3/day fresh water in 20074) even with their higher production cost; the cost per ton for MSF is 1.10 $/m3, MED is 0.80 $/m3, and RO is 0.70 $/m3.2,5) About 50 % of production cost in thermal processes has been used for heat energy.4,6)
Gas hydrates(clathrate hydrates) are three-dimensional crystalline compounds where guest molecules(gases with low molecular weight, e.g., CH4 or CO2) are trapped in host structures that are composed of hydrogen-bonded water molecules. Meanwhile, during the formation of gas hydrates in seawater, water and guest gas molecules combine together while salts and other impurities are excluded from crystalline hydrate structures and concentrated in the bulk solution. If hydrates are then harvested from the brine and thermally dissociated, fresh water can be recovered as a final desalination product. This poses a new possibility of fresh water production at a lower cost. Prior to the commercialization of this desalination technology using gas hydrate formation(currently, pilot-tested in our research group), basic information are necessary for process design and profitability estimation. Especially, the effect of seawater salinity on hydrate equilibria and kinetics should be evaluated because it is essential to determine operating conditions(temperature and pressure) and residence time of the process.
Gas hydrate equilibria had long been studied since Parrish and Prausnitz’s work on dissociation pressures of gas hydrates formed by gas mixtures.7) They used the Van der Waals-Platteeuw model and single gas hydrate data to develop a numerical calculation procedure for hydrate formation conditions. In 1980, Holder et al. studied about thermodynamic and molecular properties of methane-krypton and methane-argon hydrates.8) For CO2 clathrate hydrate, Diamond reported its stability in KCl- NaCl solutions9) and Nagano et al. introduced Raman spectroscopy on their study about high pressure phase equilibrium of CO2 hydrate.10) Recently, Youssef et al. successfully measured dissociation temperatures of methane, ethane, and CO2 hydrates in the absence of any aqueous phase.11) The enthalpies of dissociation of simple and mixed CO2 clathrate hydrates were then reported by Lirio et al.12) For refrigerant-based hydrates, equilibrium data of R-134a, R-141b, and R-152a hydrates were reported by Liang et al. in 200113) and Hashimoto et al. studied about hydrate dissociation enthalpies for R-134a, R-125, and R-143a hydrate systems.14) M. Oowa et al. had selected R-134a as an alternative refrigerant for refrigerant gas hydrates as cool storage materials in 1990 and studied about the formation-decomposition of R-134a gas hydrates.15) Effects of additives on CO2 hydrate formation was studied by Liu et al. in 200816) and Tang et al. reported the kinetic studies of gas hydrate formation with low-dosage hydrate inhibitors in 2010.17)
In this study, we have investigated the salinity effect by tracing equilibrium points for CO2 and R-134a gas hydrates in seawater. Then, time-resolved in-situ Raman spectroscopy has been employed to evaluate how the kinetics of hydrate formation is affected by salinity. We used CO2 because it is one of the most common guest gases and R-134a(HFC-134a), a refrigerant, because R- 134a gas hydrate is known to be formed in much more favorable conditions(relatively low pressure and/or high temperature) and it does not contain chlorines destroying the ozone layer and potentially causing the bad effect of global warming.
2. Experimental
2.1 Apparatus and materials
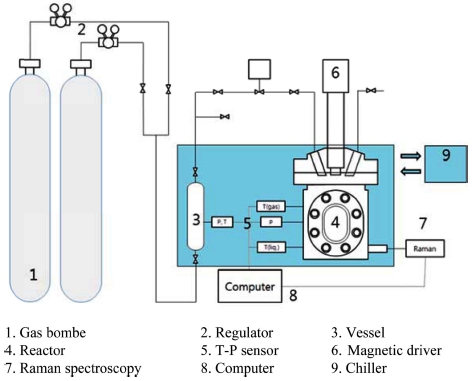
Hydrate equilibrium data were measured by a set of devices made of SUS 316 as seen in Fig. 1. Attached beside the reactor is Raman spectrometer(Dimension-P1, Lambda Solution, USA). Temperature and pressure were measured by a T-P sensor, whose data were sent to computer. As object gases, CO2 and R-134a(1,1,1,2-tetrafluoroethane, HFC-134a) with a purity of 99.5 % were used. Artificial seawater was prepared by using Coralife Marine salt(Coralife, USA) with three different concentrations( 1.75 %, 3.5 %, and 5.25 %). The salinity was measured by using Pro30 conductivity meter(YSI Enviromental, USA).
2.2 Procedure
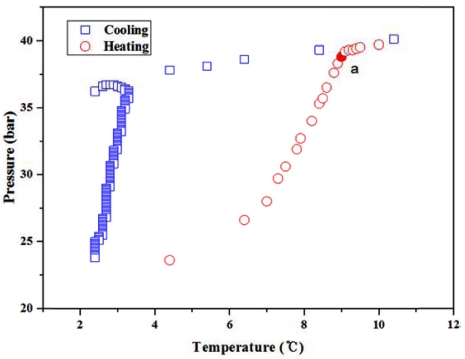
To get hydrate equilibrium data, the following test procedure was used same for all variables. A 50 ml of water was put in the reactor and flushed with gas until it reached a starting point(desirable temperature and pressure). The reactor was then cooled down until there is no pressure change which means gas hydrate is formed. Afterwards, the temperature was slowly raised by a step of 0.1 °C per hour until all the gas hydrate was dissociated. The point where cooling and heating curves meet was an equilibrium point, denoted by ‘a’ in Fig. 2. It is also called as a triple point where three phases - liquid water(Lw), gas hydrate(H), and vapor(V) - coexist in thermodynamic equilibrium.
2.3In-situ Raman Spectroscopy
A Raman spectrometer(Lambda Solutions, Inc., Dimension- P1) with an optical fiber and a charged coupled device(CCD) detector was used to monitor the hydrate formation by in-situ and time-resolved manners. While its analysis range and resolution are 150-320 cm-1 and 3.0 cm-1, respectively, it uses a TE stabilized diode laser of 785 nm wavelength. The Raman signal is collected through a Unilab II probe, inserted into a specially designed quartz window port in the reactor as schematically illustrated in Fig. 2.
3. Results and Discussion
3.1 CO2 Gas Hydrate
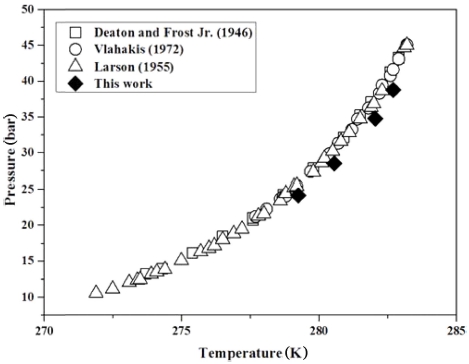
To verify the reliability of our experimental apparatus, our results for the equilibrium points of CO2 gas hydrate in deionized water are compared to previous experiments in the literature as shown in Table 1. Although the results seem different in Table 1, plotting the results in a diagram, as seen in Fig. 3, demonstrates that the trend is almost identical, and pressure lowering by about 2 bar is consistently observed at a given temperature. The pressure lowering is probably considered as an inherent mechanical off-set by our experimental setup.
Table 1
Equilibrium points of Lw-H-V for CO2 gas hydrate in deionized water.
| Deaton and Frost Jr.18) | Vlahakis19) | Larson20) | this work | ||||
|---|---|---|---|---|---|---|---|
| bar | K | bar | K | bar | K | bar | K |
| 32.13 | 280.9 | 29.89 | 280.4 | 15.1 | 275.0 | 24.2 | 279.25 |
| 35.30 | 281.5 | 31.34 | 280.7 | 16.34 | 275.7 | 28.5 | 280.55 |
| 37.09 | 281.9 | 33.27 | 281.2 | 16.82 | 276.0 | 34.8 | 282.05 |
| 41.3 | 282.6 | 34.72 | 281.4 | 17.17 | 276.2 | 38.8 | 282.70 |
| 43.23 | 282.9 | 36.26 | 281.8 | 18.06 | 276.5 | ||
| 38.33 | 282.2 | 18.89 | 276.9 | ||||
| 39.47 | 282.3 | 19.51 | 277.2 | ||||
| 40.82 | 282.6 | 21.37 | 277.8 | ||||
| 41.62 | 282.7 | 21.65 | 278.0 | ||||
| 43.11 | 282.9 | 23.44 | 278.6 | ||||
| 45.08 | 283.2 | 24.48 | 278.8 | ||||
| 25.3 | 279.1 | ||||||
| 25.44 | 279.2 | ||||||
| 27.3 | 279.8 | ||||||
| 28.61 | 280.1 | ||||||
| 29.23 | 280.2 | ||||||
| 30.20 | 280.5 | ||||||
| 31.58 | 280.8 | ||||||
| 32.82 | 281.1 | ||||||
| 34.75 | 281.5 | ||||||
| 36.34 | 281.9 | ||||||
| 36.89 | 282.0 | ||||||
| 38.68 | 282.3 | ||||||
| 44.68 | 283.1 | ||||||
| 45.02 | 283.2 | ||||||
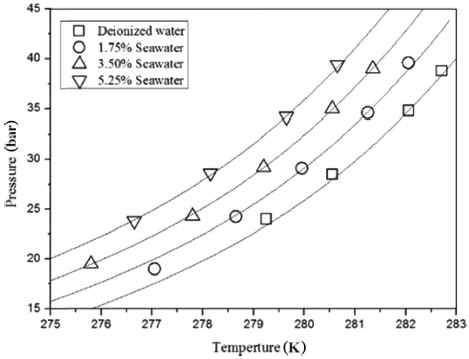
Then, how the equilibria of CO2 gas hydrate are affected by salinity was investigated, as shown in Fig. 4. Increasing the salinity moves the equilibrium to the left in proportion. Each time the salinity increases by 1.75 %, the temperature drops by about 2 °C at a given pressure and/or the pressure rises by about 1 bar at a given temperature. The condition for the formation of CO2 gas hydrate becomes obviously unfavorable with salinity and it suggests that the presence of various ions in seawater would play roles of inhibitors.
3.2 R-134a Gas Hydrate
The same approach was applied to R-134a gas hydrate. Table 2 and Fig. 5 compare our experimental results to previous ones in the literature for the equilibrium points of R-134a gas hydrates in deionized water. A slight difference is observed, corresponding to pressure lowering by about 0.8 to 1 bar at a given temperature. However, the trend is also almost identical, similarly as in the case of CO2 hydrate.
Table 2
Equilibrium points of Lw-H-V for R-134a gas hydrate in deionized water.
| Liang13) | this work | ||
|---|---|---|---|
| bar | K | bar | K |
| 0.566 | 273.51 | 1.3 | 280.75 |
| 0.739 | 274.82 | 1.8 | 281.75 |
| 0.963 | 276.12 | 2.3 | 282.55 |
| 1.484 | 278.23 | 2.8 | 283.05 |
| 2.357 | 280.46 | 3.2 | 283.35 |
| 2.94 | 281.51 | ||
| 3.632 | 282.50 | ||
| 3.978 | 282.92 | ||
| 4.144 | 283.13 | ||
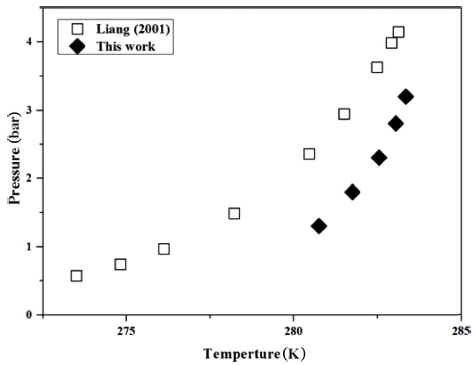
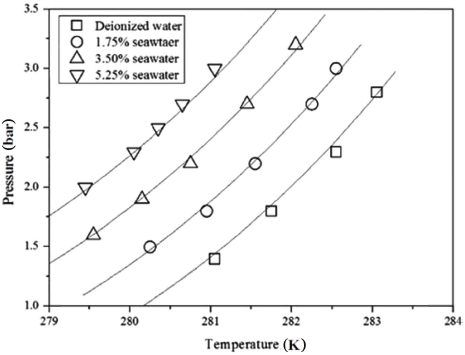
Equilibrium shift of R-134a gas hydrate by salinity was also investigated, as shown in Fig. 6. By the same way as in the case of CO2 gas hydrate, increasing salinity moves the equilibrium to the left systematically. Each time the salinity increases by 1.75 %, the temperature drops by about 0.38 °C at a given pressure and/or the pressure rises by about 0.25 bar at a given temperature. Seawater is definitely not favorable for the formation of R-134a gas hydrates. Combined with the results for CO2 gas hydrates, it can be generalized for all gas hydrates.
3.3In-situ Raman Spectroscopy
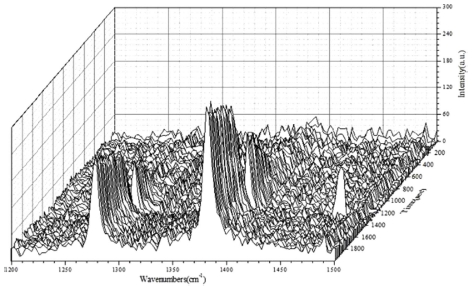
To visualize the formation of gas hydrates kinetically, in-situ Raman spectroscopy was employed for CO2 gas hydrate. The CO2 molecule has three normal vibration modes: symmetric stretching vibration mode(v1), bending vibration mode(v2), and antisymmetric stretching vibration mode(v3). Considering the symmetry of the molecule, the vibration mode of v1 is only Raman active while v2 and v3 are inactive. However, anharmonic coupling between nearly degenerate states of v1 and the overtone of v2 gives rise to modes v+(~v1) and v-(~2v2) in Raman spectra by the Fermi resonance effect. In liquid CO2, Raman spectra have their peaks at wavenumbers of 1281 and 1386 cm-1, correspondingly.10) As shown in Fig. 7 for the formation of CO2 gas hydrate in seawater with 3.5 % salinity, strong peaks are observed at wavenumbers of 1276.5 and 1381.1 cm-1, when CO2 is captured in water framework. These are very similar to characteristic wavenumbers of liquid CO2. Those peaks become stronger as hydrates are growing, indicating that the more Raman signal is collected from the symmetric stretching vibration mode of CO2, the denser CO2 becomes in gas hydrate structures.
3.4 Gas Hydrates Formation Rate
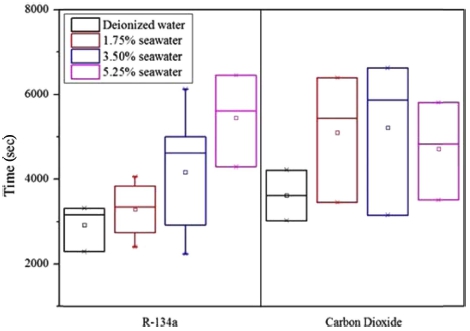
Although the kinetics of gas hydrate formation can be resolved by in-situ Raman, we found out that the growing of characteristic peaks of CO2 somehow related to the optical haziness in the reactor. Thus, simply based on our optical observation, kinetic data of gas hydrate formation are summarized by using box plots in Fig. 8, for several salinity values and two guest gases(R-134a and CO2). For R-134a, increasing the salinity made the hydrate formation become longer in proportion. It suggests that the presence of ions in seawater inhibits the formation of R-134a hydrate in terms of kinetics, as well as in terms of equilibrium thermodynamics. For CO2, however, increasing the salinity made the hydrate formation longer only in low salinity and the kinetics is saturated in salinity above 1.75 %. The underlying mechanism will be more meticulously investigated in future research.
4. Conclusions
As a preliminary step, our experimental apparatus was verified for CO2 and R-134a gas hydrates in deionized water. Our results for hydrate equilibrium(triple points) are very consistent with previous experimental data in the literature, although there were slight differences of 2 bar for CO2 and 0.8 to 1 bar for R-134a at a given temperature. The effect of salinity to hydrate equilibria was then investigated by varying the salinity with 1.75 %, 3.50 %, and 5.25 %. For CO2, increasing the salinity by 1.75 % made the temperature drop by about 2 °C at a given pressure and/or the pressure rise by about 1 bar at a given temperature. For R134-a, the values were 0.38 °C and 0.25 bar by the same increase of salinity. The salinity definitely provides an unfavorable condition for the formation of gas hydrates in terms of equilibrium thermodynamics. To evaluate the effect of salinity in terms of kinetics, the kinetics of gas hydrate formation was resolved by using in-situ Raman spectroscopy. For R134-a, higher salinity apparently caused retarded hydrate formation, while it was valid only in low salinity for CO2 and its kinetics appeared to be saturated in salinity above 0.75 %.