1. Introduction
2. Experimental Procedure
2.1. Reagents
2.2. Sample preparation
2.3. Characterization
3. Results and Discussion
3.1. Synthesis of intermediates and time dependence on the coprecipitation method
3.2. LiFePO4/C synthesis and characterization
3.3. Electrochemical performance of different LiFePO4
4. Conclusion
1. Introduction
As concerns about global warming and environmental pollution grow, there is significantly increasing interest in eco-friendly solutions. In particular, electric vehicles require batteries with high energy density to power their systems.1,2) Lithium-ion batteries, with high voltage and energy density, are receiving considerable attention due to their suitability for eco-friendly transportation.3,4,5) Among these, LiFePO4 is widely used in electric vehicle batteries because of its abundant iron content, cost-effectiveness, high theoretical capacity (170 mAh ‧ g-1), and voltage in 3.2 V versus Li+/Li.6) LiFePO4 has an olivine structure comprising FeO6 octahedra, LiO6 octahedra, and PO4 tetrahedra. In particular, the P-O covalent bonds provide strong binding energy, stabilizing the oxygen atoms and ensuring the structural stability of LiFePO4. However, the insulating nature of FeO6 hinders electron mobility.4,5,6,7,8) Therefore, LiFePO4 exhibits lower electronic conductivity (10-6 to 10-10 S cm-1) and Li+ diffusivity compared with other cathode materials like LiNi1-x-yCoxMnyO2 (NCM) and LiCoO2 (LCO).4,6) To address these limitations, extensive research has been conducted, including carbon coating to prevent Fe dissolution in electrolytes and enhance conductivity, and metal ion doping to reduce polarization and electron transfer resistance.9,10,11,12,13,14)
Additionally, extensive research is actively being conducted to overcome the limitations of LiFePO4 by optimizing particle size. Typically, the FePO4 ‧ xH2O precursor is synthesized at the nanoscale to increase surface area, enhance electrolyte contact, and shorten the lithium-ion diffusion path, ultimately improving conductivity.15,16) As a result, recent LiFePO4 batteries exhibit capacities approaching 90 % of their theoretical value.17) However, achieving high tap density and electrode density remains challenging with nanoscale particles due to their large surface area and inherent porosity. In contrast, spherical micrometer-sized particles enable higher tap density, which leads to an increase in energy density at the cell level. Various methods, including sol-gel, solvothermal, hydrothermal, and solid-state synthesis, have been proposed to synthesize micrometer-sized particles for improved tap density.18,19,20,21,22) Although solid-state synthesis offers simplicity in processing, it remains challenging to produce uniform particles. The co-precipitation method can provide great advantages in terms of mass production, low energy consumption, and cost. Moreover, the morphology and size of the precursors can be modified by controlling parameters such as pH, complexing agents, and reaction time. The co-precipitation method, especially when using a continuous tank reactor, is more advantageous for the uniform size distribution of prepared particles and is cost-effective.23)
In this study, micrometer-sized FePO4 was synthesized through the co-precipitation method. Ammonia was utilized during the co-precipitation process, and the particle size and morphology of FePO4 were analyzed as a function of synthesis time. Furthermore, the LiFePO4/C cathode material was prepared using the synthesized FePO4 precursor, and its electrochemical performance was evaluated thoroughly.
2. Experimental Procedure
2.1. Reagents
The reagents used in this study were ferric nitrate nonahydrate [Fe(NO3)3 ‧ 9H2O], phosphoric acid (H3PO4, 85 %), ammonium hydroxide (NH4OH), lithium carbonate (Li2CO3), and sucrose (C12H22O11), all of which were purchased from SAMCHUN chemical.
2.2. Sample preparation
FePO4 precursors were prepared by using the co-precipitation method in a continuous stirring tank reactor (CSTR). A solution of Fe(NO3)3 and H3PO4 was dissolved in distilled water at a concentration of 1 M. A 3 M NH4OH aqueous solution was used to adjust the pH of the solution to 1.5. All solutions were slowly added at a rate of 0.08 L/h, and the temperature and stirring speed were controlled at 60 °C and 900 RPM, respectively. Each experiment was conducted for 3, 7, and 10 h, resulting in white or pale-yellow precipitates, which were collected by filtration and washed several times with deionized water. The obtained powders were labeled by Pre-3, Pre-7, and Pre-10 as their reaction time of 3, 7, and 10 h, respectively.
To obtain anhydrous FePO4, FP-3, FP-7, and FP-10, the precipitated powders were calcined at 600 °C in the air for 3 h. After heat treatment, anhydrous FePO4 forms. Then, LiFePO4/C samples were prepared by the carbothermic reduction method. Anhydrous FePO4, Li2CO3, and sucrose were mixed in ethanol using a mortar at a molar ratio of 1 : 0.51 : 0.1, and the mixture was dried in an oven at 80 °C for 12 h. The dried mixture was calcined at 650 °C for 10 h under the mixed gas atmosphere (Ar/H2 at 96 : 4 %) to reduce Fe3+ in FePO4 to Fe2+ in LiFePO4 and to prevent oxidation at the high temperature. We successfully synthesized the LiFePO4/C samples, labeled LFP-3, LFP-7, and LFP-10, which were prepared by FP-3, FP-7, and FP-10, respectively.
2.3. Characterization
The crystal structures of FePO4 and LiFePO4 were analyzed using X-ray diffraction (XRD) with a D8 Advance (Bruker, USA) employing Cu Kα radiation (λ = 0.15418 nm). The morphology and microstructures of the samples were examined using a field emission scanning electron microscope (FESEM, Tescan, Czechia). In addition, specific surface area analysis were calculated based on the Brunauer-Emmett-Teller (BET) method, and pore size distribution analysis, using the Barrett-Joyner-Halenda (BJH) model. The N2 adsorption-desorption isotherm can be measured using an ASAP 2420 nitrogen adsorption-desorption analyzer. The particle size distribution was determined using a particle size analyzer (PSA, Mastersizer 2000, Malvern, UK). Thermogravimetric analysis (TGA) and differential scanning calorimetry (DSC) (Mettler-Toledo, Switzerland) were conducted to evaluate mass changes and phase transitions under a nitrogen atmosphere at a heating rate of 10 °C/min. Furthermore, Fourier transform infrared (FTIR) spectra were acquired using a VERTEX 80v spectrometer (Bruker, USA).
The electrochemical performance of the LiFePO4/C composites was investigated using CR2032 coin-type cells. The LiFePO4/C slurry was prepared by mixing the active material, carbon black, and polyvinylidene fluoride (PVDF) in a weight ratio of 80 : 10 : 10. The slurry was then coated onto aluminum foil and dried in a vacuum oven at 120 °C for 24 h. The electrolyte used was 1 M LiPF6 dissolved in a 1 : 1 : 1 volume ratio of ethylene carbonate (EC), dimethyl carbonate (DMC), and ethyl methyl carbonate (EMC). A polyethylene separator was employed in the cell assembly, which was conducted in a glove box under an argon atmosphere. The cells were aged for 6 h before electrochemical performance testing. Charge-discharge tests were carried out using a battery test system with cut-off voltages set at 2.5 V and 4.2 V (vs. Li+/Li). Cyclic voltammetry (CV) was carried out within a voltage range of 2.0 V to 4.2 V at a scan rate of 0.05 mV/s. Electrochemical impedance spectroscopy (EIS) was used to measure internal resistance with a voltage amplitude of 5 mV and a frequency range from 1 kHz to 10 mHz.
3. Results and Discussion
3.1. Synthesis of intermediates and time dependence on the coprecipitation method
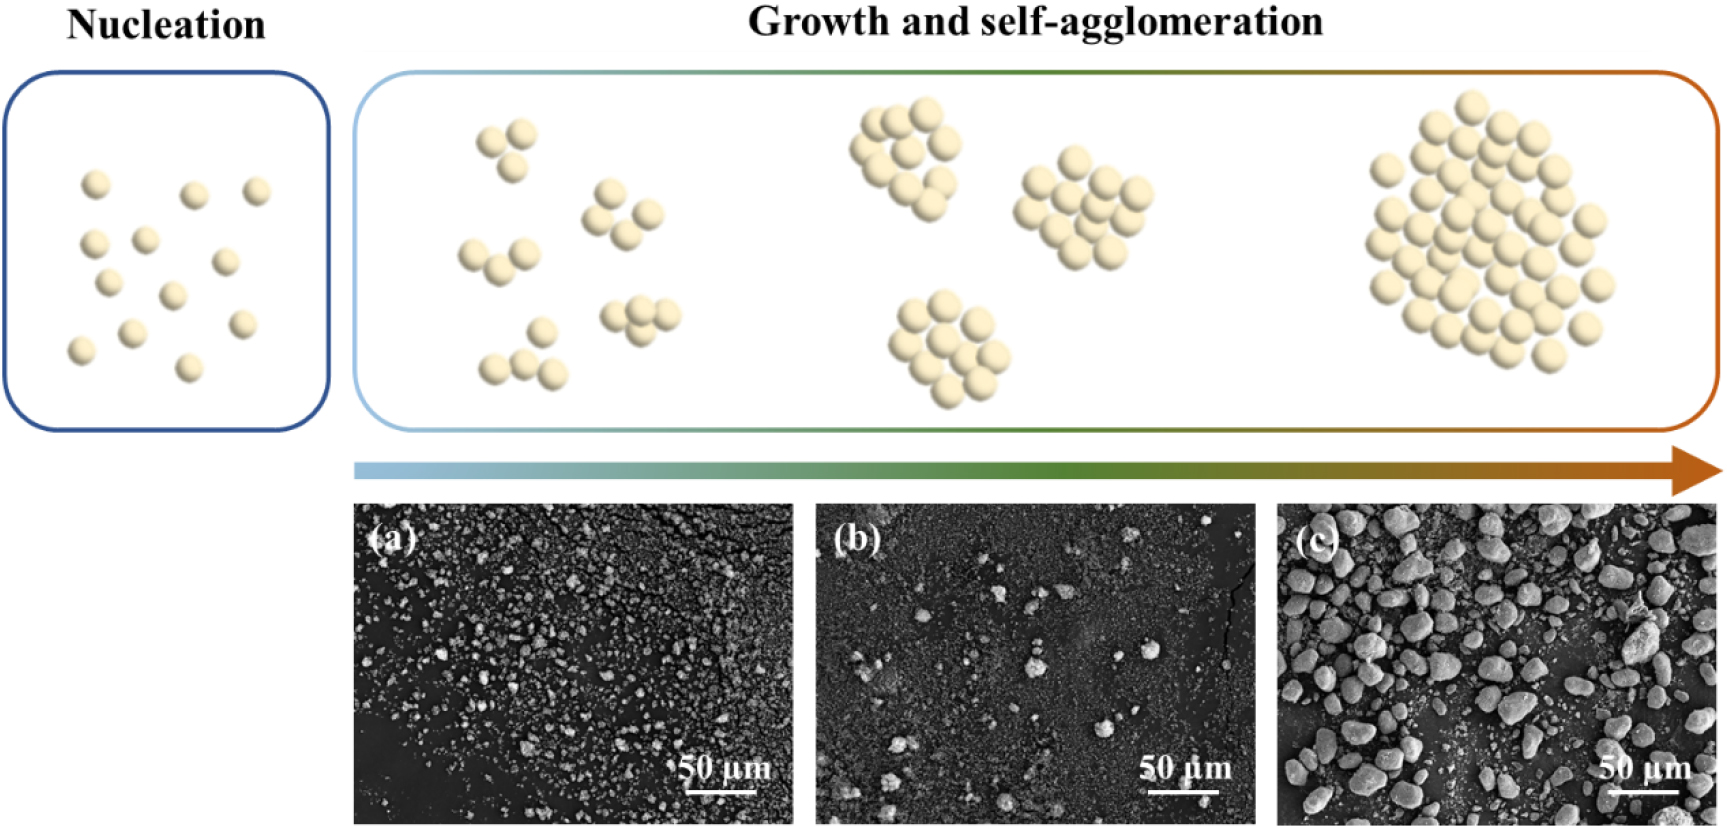
The growth and self-aggregation phenomena during the synthesis of the precursor are illustrated in Fig. 1. Upon injecting the aqueous solution into the reactor, the solution color changed immediately from transparent to pale-white. Small particles remained even after 10 h of reaction and exhibited self-aggregation, as shown in Fig. 1(c). This suggests that the particles cannot grow gradually due to the absence of a chelating agent, and intermediates are continuously generated by consuming the metal and phosphate sources.
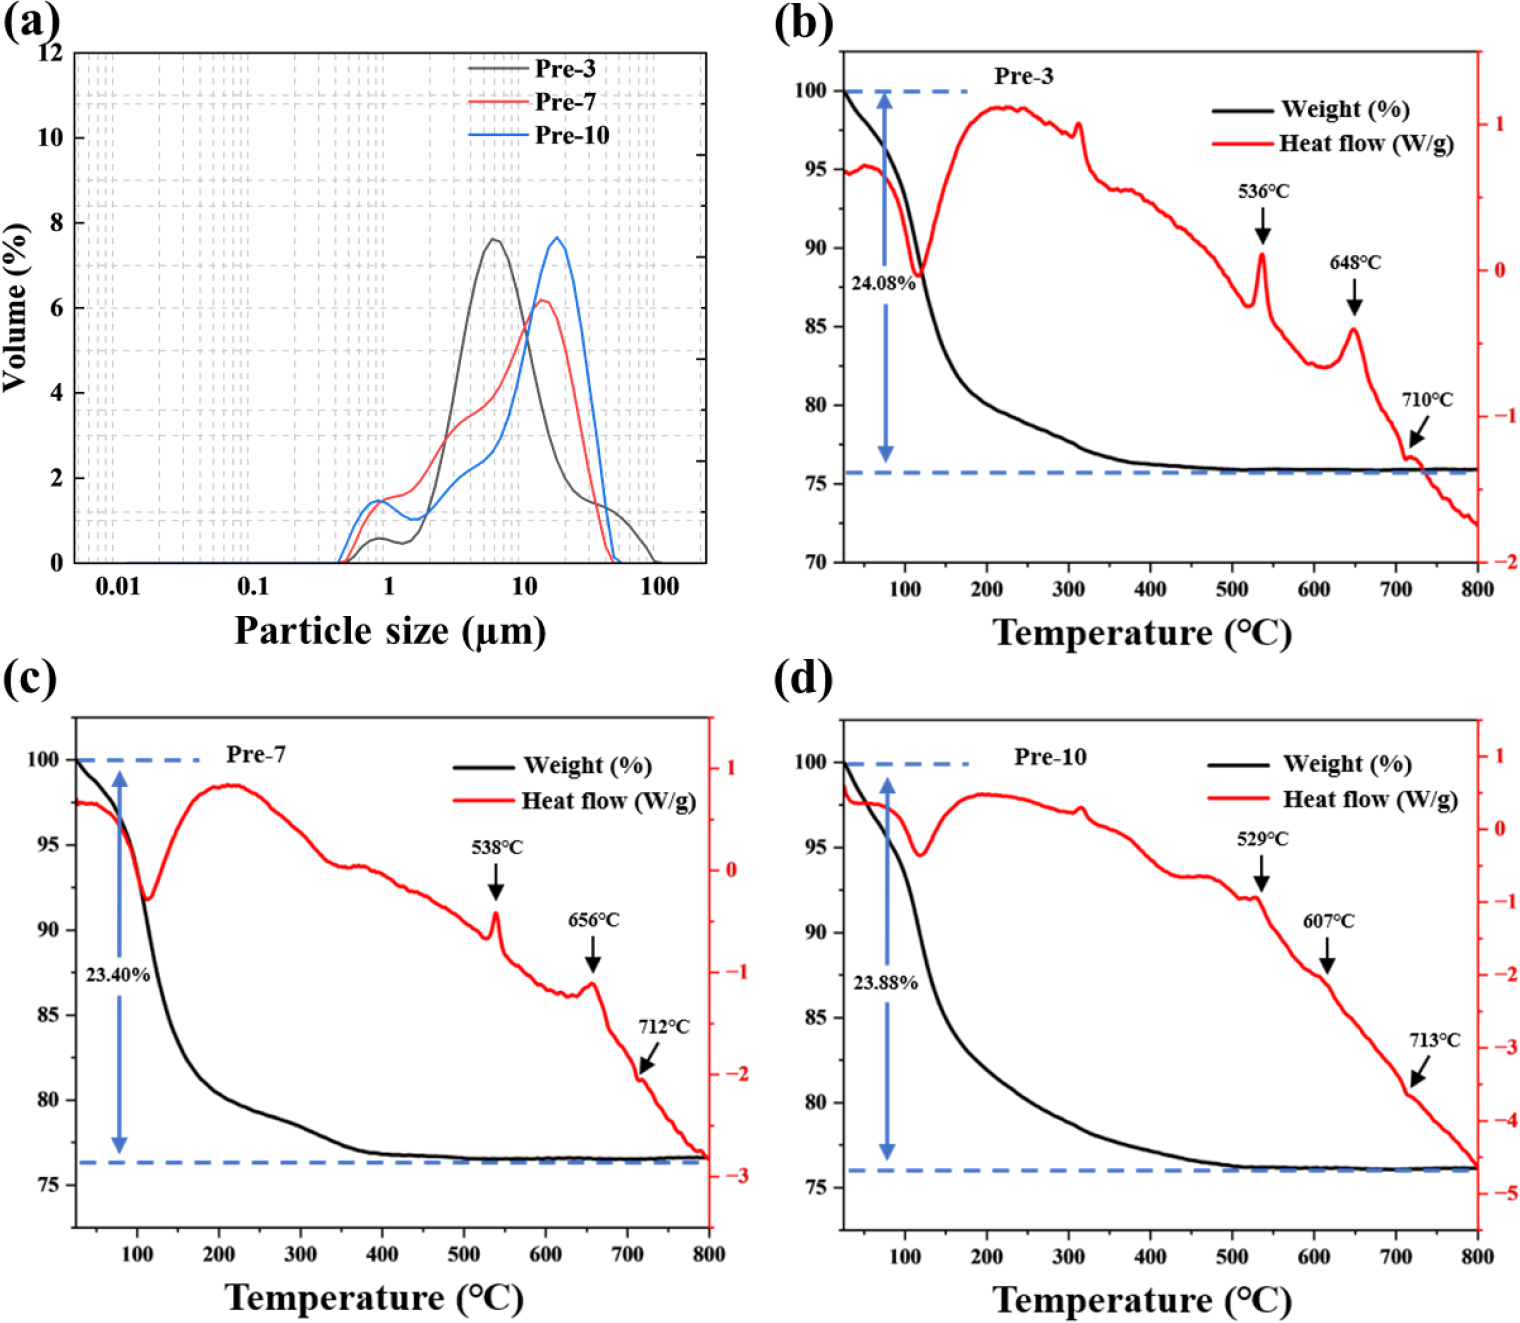
To investigate the particle size and distribution over the reaction time, particle size analysis was conducted, as shown in Fig. 2(a). The D50 values for Pre-3, Pre-7, and Pre-10 were 4.93 µm, 7.72 µm, and 11.46 µm, respectively, indicating that the average particle size increases over the reaction time. However, the particle size distribution graphs show a broad feature due to the coexistence of small and irregular shapes of the particles, which can hinder the formation of active material with high tap density. The emergence of small particles results from the lack of a chelating agent. The weight loss and phase transition characteristics of all intermediates during the heating process were observed using TG/DSC analysis. The weight decreased due to the loss of crystal water and NH3, which occurred around 100~500 °C and 530 °C for all samples, with weight loss values of 24.08 %, 23.40 %, and 23.88 % for Pre-3, Pre-7, and Pre-10, respectively.24)
Phase transition occurred accompanied by the exothermic reaction at approximately 600~660 °C and 710 °C in the DSC curves [Fig. 2(b-d)] for all samples without significant weight loss. Notably, Pre-10 showed a lower temperature at 607 °C compared with others, indicating easier crystallization due to densely packed primary particles. The absorption peaks in Fig. 3(a) show the spectrum of the anti-symmetric stretching mode of PO43- in the range of 1,000~1,200 cm-1 and 400~560 cm-1 for all prepared samples, while the broad bands around 3,200~3,400 cm-1 and 1,630 cm-1 could be attributed to the stretching and bending vibrations of water molecules. Additionally, the stretching vibration at 1,426 cm-1 in the FT-IR spectra of all samples may confirm the presence of NH4+, suggesting that ammonium hydroxide acts not only as a pH adjuster but also as a reactant, as shown in Eq. (1).
The intermediate shows an amorphous phase as observed in the XRD pattern [Fig. 3(b)]. After heat treatment, all intermediates were converted to trigonal FePO4 phase (JCPDS No. 29-0715) as shown in Fig. 3(c). Crystallinity of the FePO4 precursor affects the electrochemical performance of LiFePO4.25) The XRD patterns of the precursors show slight differences in peak intensity. The highest intensity could be attained in FP-10, indicating the highest crystallinity, which is consistent with the TG analysis results shown in Fig. 2.
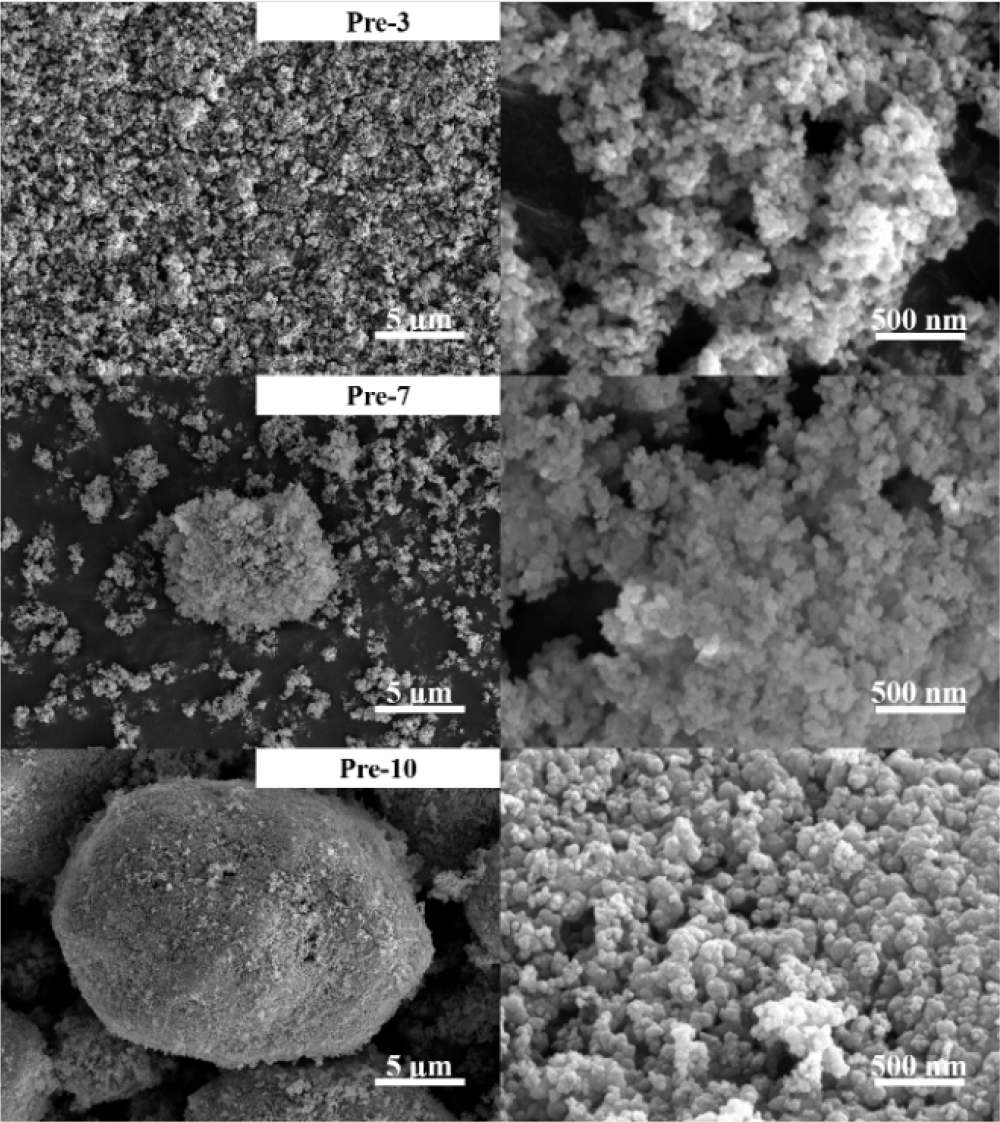
Scanning electron microscope (SEM) analysis was conducted to analyze the morphology of precursors as shown in Fig. 4. All precursors have nano-scale primary particles. While notable change in the morphology could not be detected among the samples, several particles of FP-3 were highly aggregated after calcination owing to their relatively large surface area, which could result in irregular shapes of active materials.
3.2. LiFePO4/C synthesis and characterization
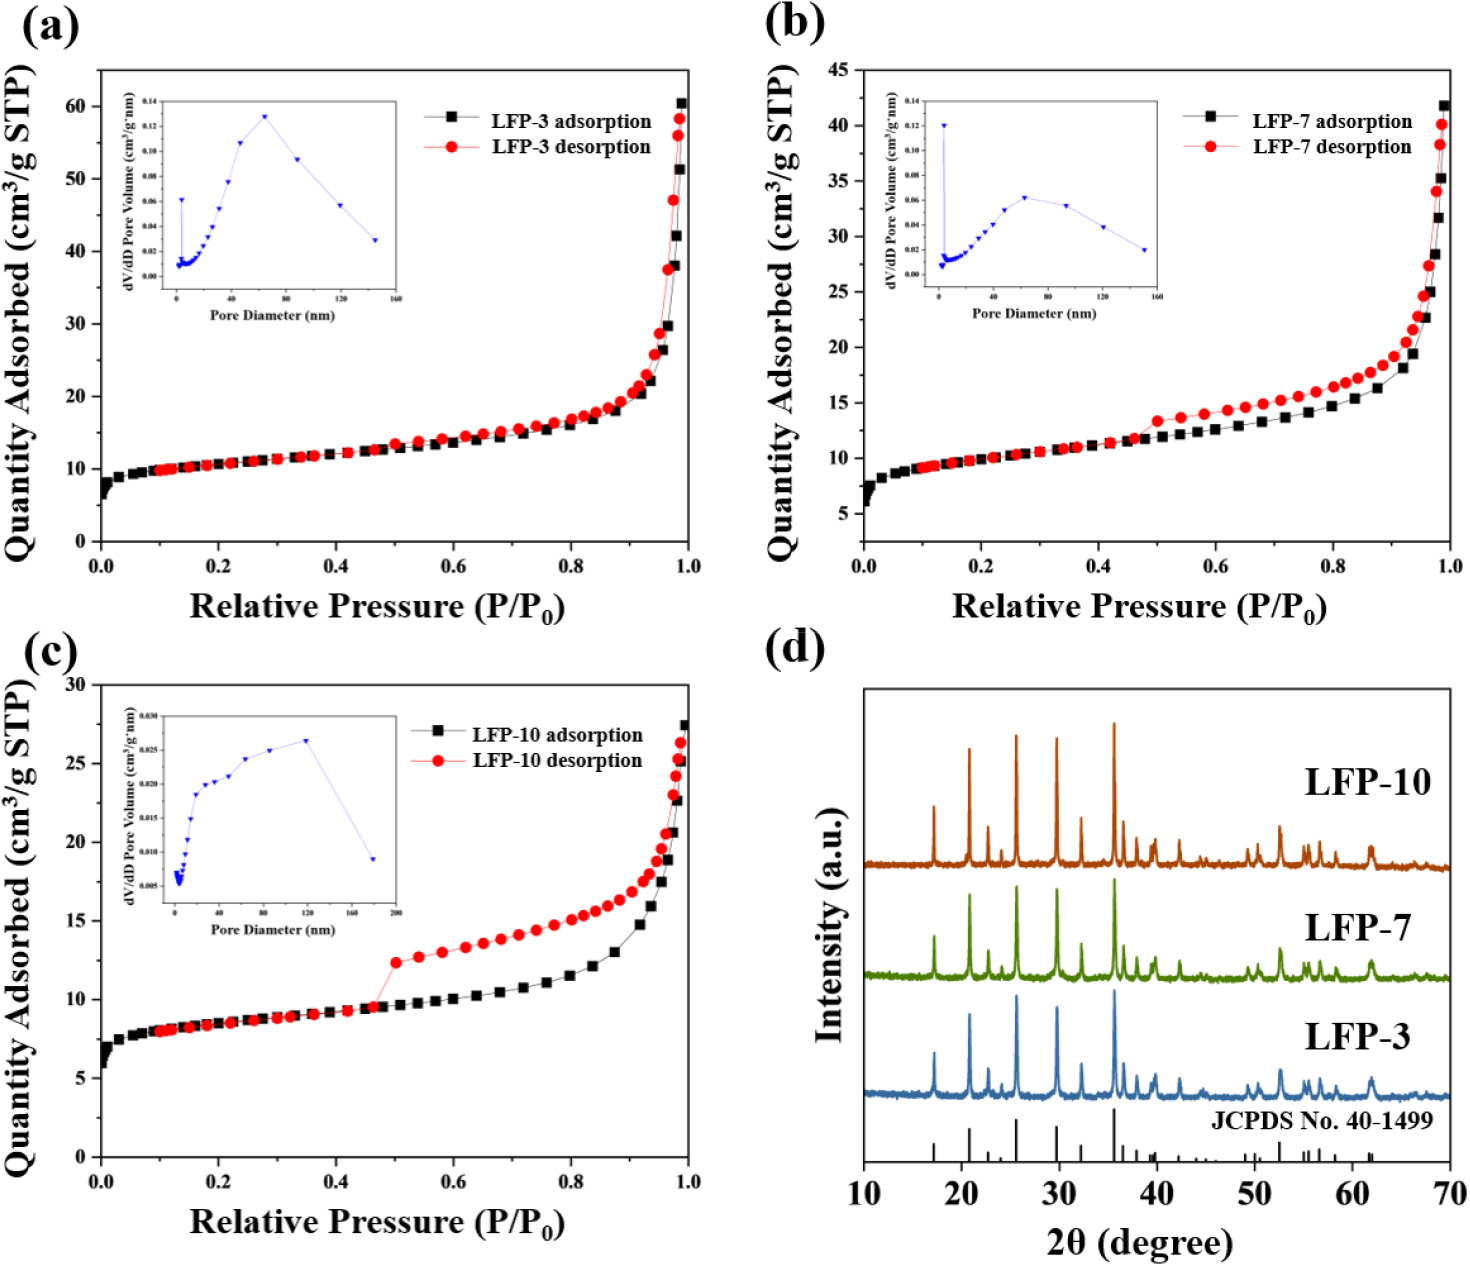
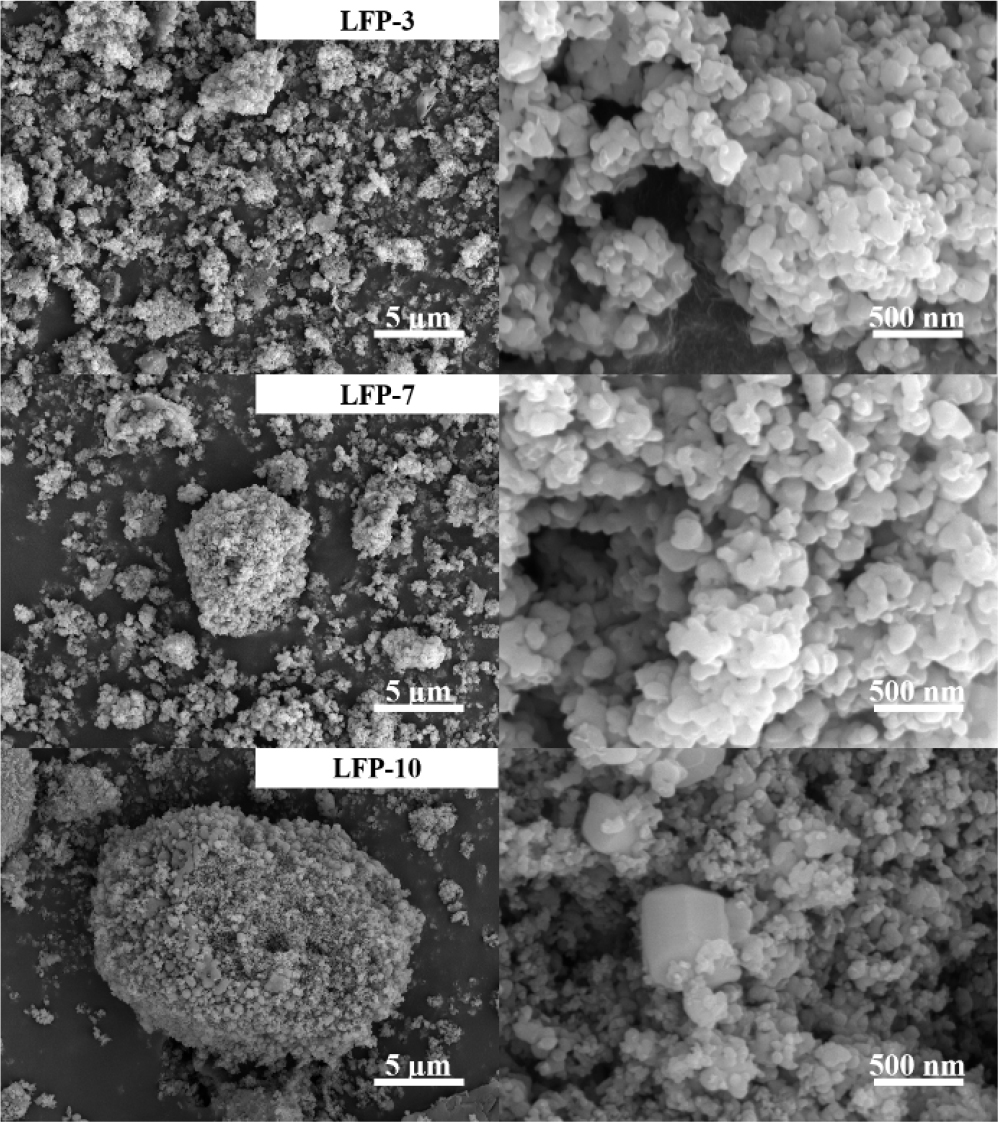
LiFePO4 active materials were synthesized via a carbothermic reduction reaction using sucrose as a carbon source to enhance electronic conductivity through carbon coating and to reduce Fe3+ to Fe2+.25) The XRD patterns of LFP-3, LFP-7, and LFP-10, shown in Fig. 5(d), indicate that the main phases of all LiFePO4/C powders were LiFePO4 with a well-ordered olivine structure, indexed to orthorhombic type (JCPDS No. 40-1499). The LFP-10 sample exhibits relatively higher peak intensity than the other samples, which can be more beneficial to the performance of cathode materials. However, larger crystallite size can also increase the Li+ diffusion path, thereby leading to the degradation of the rate performance.26) Carbon was not detected in the XRD due to the formation of a thin surface layer with amorphous nature. The N2 adsorption-desorption of LiFePO4 samples was measured and the pore size and surface area were calculated [Fig. 5(a-c)]. The specific surface areas of the samples were 39.1085 m2/g, 36.2876 m2/g, and 31.7218 m2/g for LFP-3, LFP-7, and LFP-10, respectively. LFP with the smaller precursor shows the larger surface area, which can effectively contact the electrolyte, thereby enhancing bulk reaction kinetics and electrochemical performance. All nitrogen adsorption/desorption curves exhibited the shape of a type IV isotherm with a hysteresis loop. The presence of mesopores in the active material was confirmed by the gap in the hysteresis loop. A larger average pore volume was observed in the LFP synthesized using the precursor with a longer reaction time, possibly due to the aggregation of primary particles into larger secondary particles, followed by the generation of additional pores within the particles. As shown in the SEM images in Fig. 6, the LiFePO4 synthesized from various FePO4 precursors exhibited different morphologies. LFP-3 shows an irregular shape with abundant mesopores on the surface, which may facilitate electrolyte penetration and lithium-ion diffusion. Additionally, LFP-3 maintained a primary particle size similar to that of FP-3, as the carbon coating prevented severe agglomeration. In contrast, LFP-10 displayed larger primary and secondary particles compared to LFP-3, due to the use of FP-10, which has the larger particle size.
3.3. Electrochemical performance of different LiFePO4
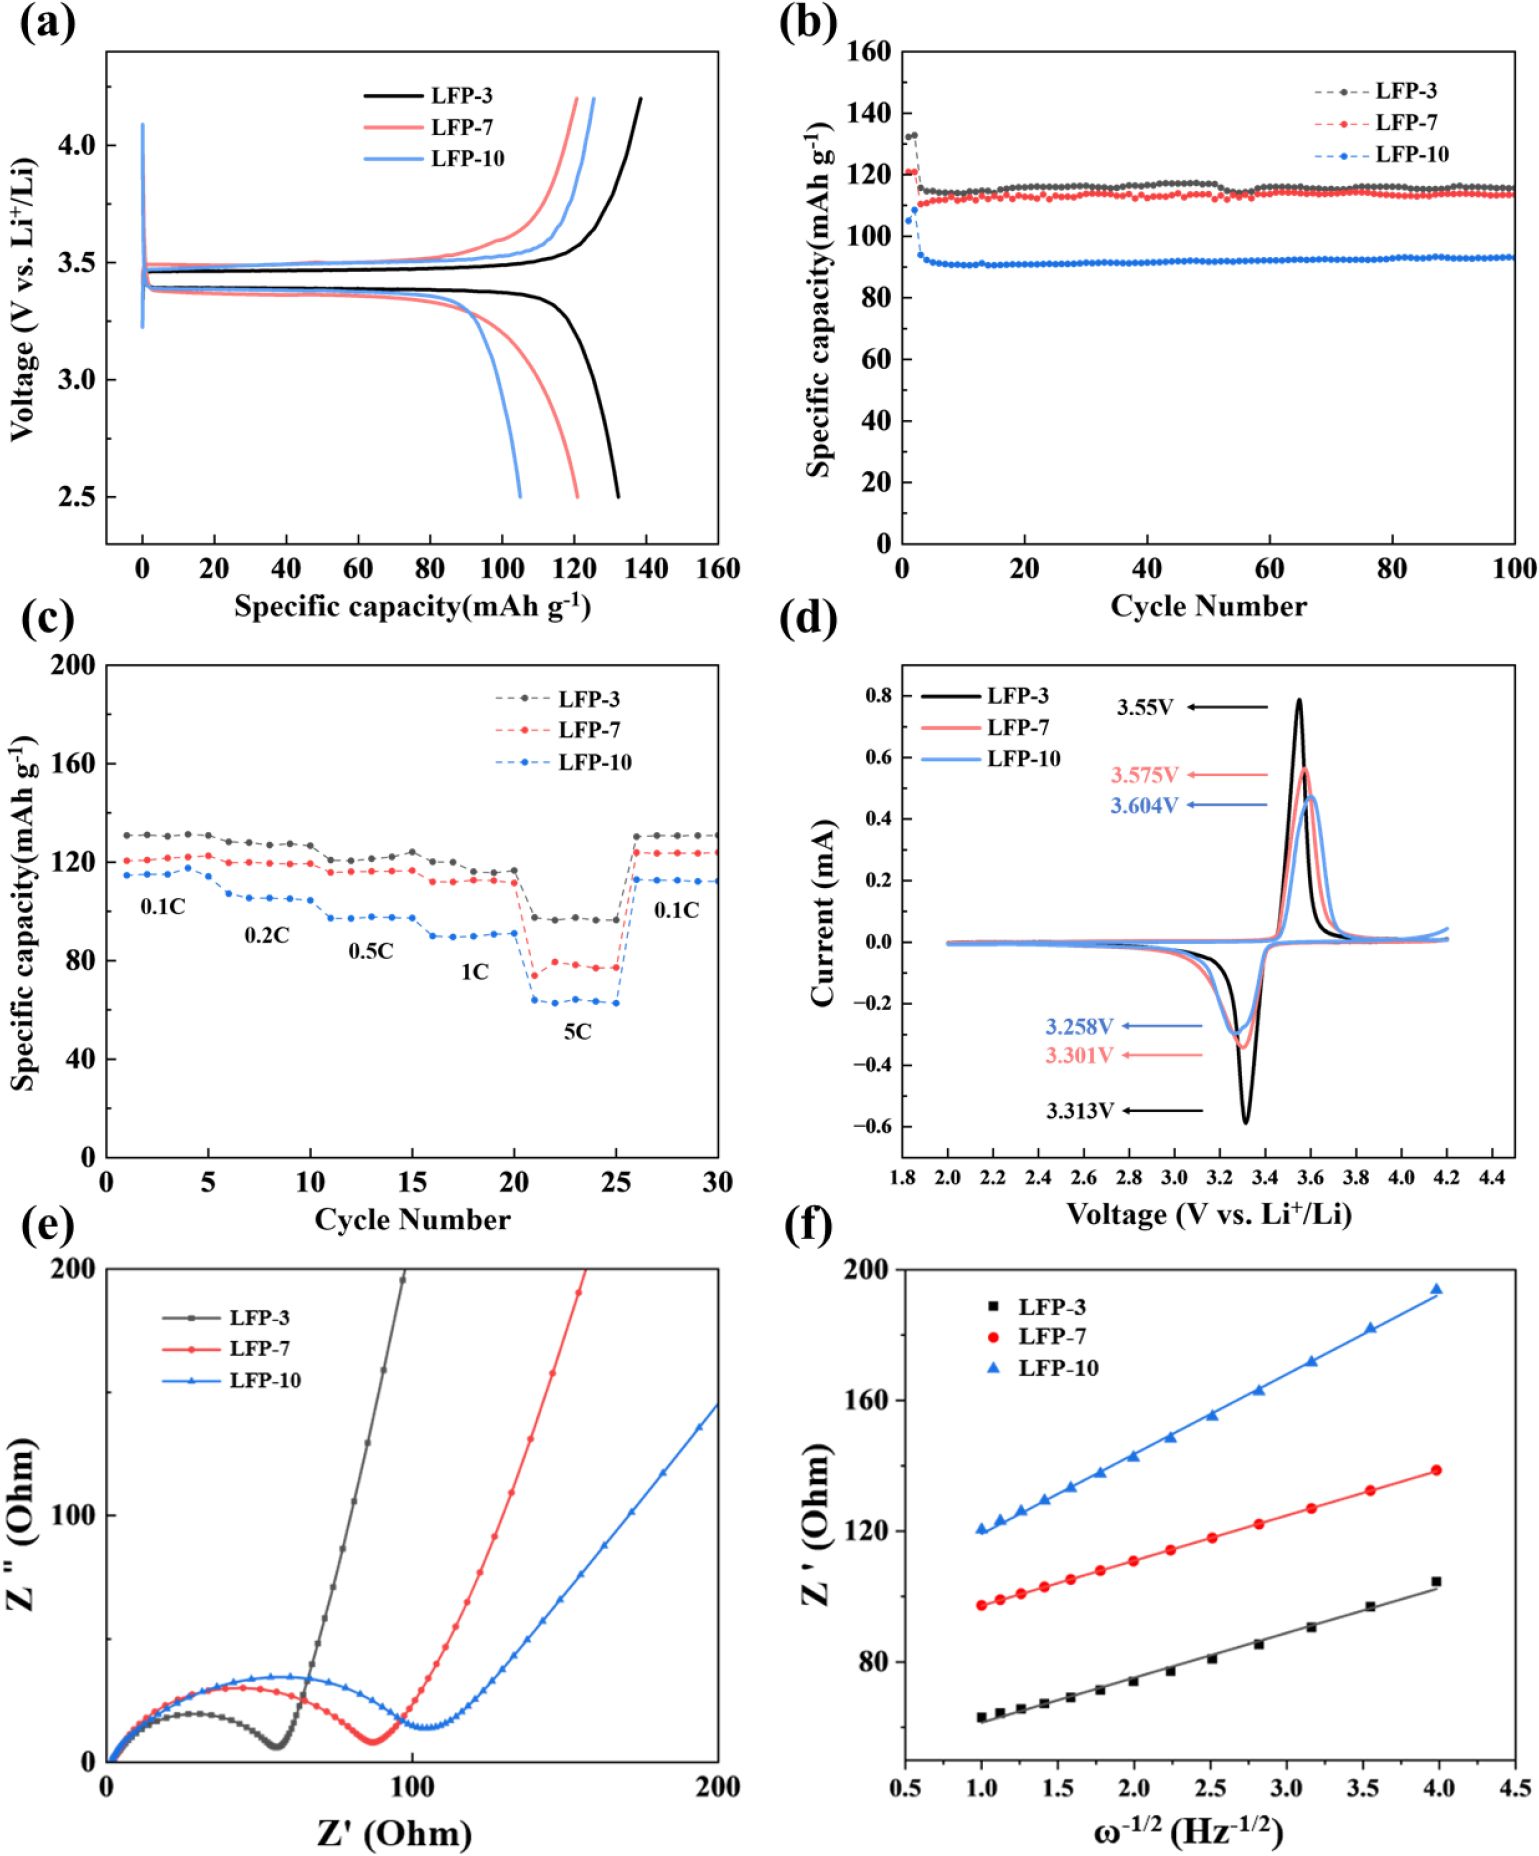
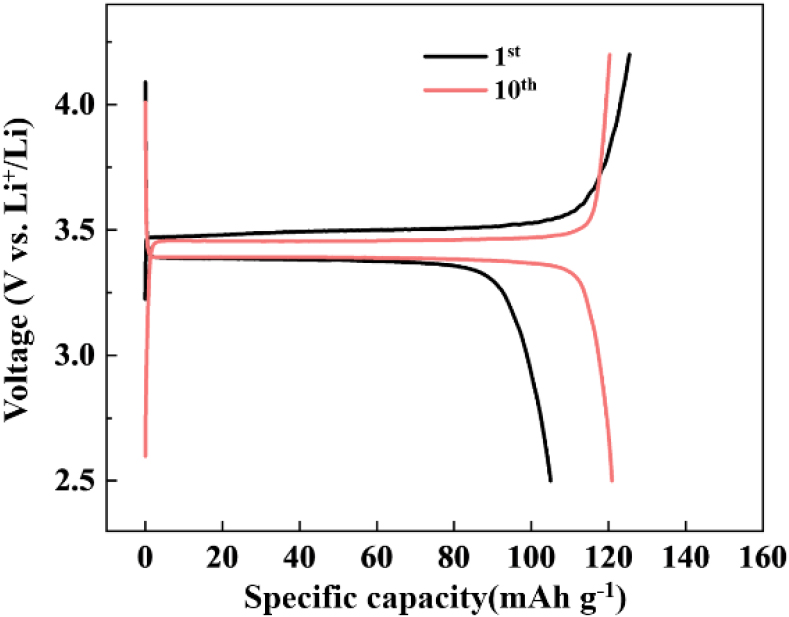
To investigate the effect of particle size on the electrochemical performance of LiFePO4/C samples, a series of electrochemical tests were conducted. Fig. 7(a) presents the initial charge-discharge profiles at a rate of 0.1 C (=17 mA ‧ g-1) for LiFePO4/C with different FePO4 precursors. All samples exhibited flat voltage plateaus at approximately 3.4~3.5 V, corresponding to the Fe2+/Fe3+ redox potential. For LFP-3, a discharge capacity of 132.25 mAh ‧ g-1 and a coulombic efficiency of 95.52 % were attained at 0.1 C. LFP-7 demonstrated a lower capacity of 120.88 mAh ‧ g-1 and a coulombic efficiency of 100.1 %, while LFP-10 showed a lower capacity of 105 mAh ‧ g-1 and a coulombic efficiency of 83.72 %. The lower capacities and efficiencies can be attributed to the large particle size resulting from the longer reaction time. However, as shown in Fig. 8, the discharge capacity of LFP-10 was restored to 120.9 mAh ‧ g-1 after 10 cycles, which can be attributed to the activation of cathode materials and improved wetting of the electrolyte. Fig. 7(b) illustrates the capacity retention of all LiFePO4/C cathode materials at a rate of 1 C, following the initial two cycles at 0.1 C, demonstrating that all prepared samples exhibit excellent cycling performance. The initial discharge capacities of LFP-3, LFP-7, and LFP-10 at 1 C were 115.72 mAh ‧ g-1, 110.42 mAh ‧ g-1, and 93.93 mAh ‧ g-1, respectively. After 100 cycles, the capacity retention for LFP-3, LFP-7, and LFP-10 was 99.9 %, 102.7 %, and 98.8 %, respectively. The increase in discharge capacity is attributed to the activation of the active material with the electrolyte. All LiFePO4/C samples exhibited excellent cycle stability, indicating the good crystallinity of olivine structure and suggesting that an irreversible reaction between the electrolyte and active material didn’t occur. Fig. 7(c) shows the rate capability of all cathode materials under different current density conditions. The discharge capacity of the LFP-3 sample was 90 mAh ‧ g-1 at a rate of 5 C, while that of LFP-10 was approximately 60 mAh ‧ g-1 at the same current, resulting in capacity retention of 70 % and 55 %, respectively. Cyclic voltammetry of LiFePO4/C cathode materials was carried out at a scanning rate of 0.05 mV/s, within a voltage range of 2.0 to 4.2 V, for the first cycle [Fig. 7(d)]. The curves exhibited cathodic and anodic peaks around 3.3 V and 3.55 V, corresponding to the Fe2+/Fe3+ redox couple (Fe3+ to Fe2+) processes. The peak potential differences between anodic and cathodic scans were 0.237 V, 0.274 V, and 0.346 V for the LFP-3, LFP-7, and LFP-10 samples, respectively. This confirms that LFP with a smaller crystal size exhibits lower polarization, contributing to enhanced electrochemical performance. The LFP-3 sample displayed a sharper peak shape and higher peak current, suggesting lower impedance than LFP-7 and LFP-10. To further understanding for the relationship between electrochemical performance and the particle size of LiFePO4, EIS was measured in the charged state (FePO4). Nyquist plots for the charged LFP-3, LFP-7, and LFP-10 samples, Z' vs. ω-1/2 plots, are presented in Fig. 7(e-f). The semi-circle in the mid-frequency region represents the charge transfer resistance (Rct), while the linear plot of Z' vs. ω-1/2 at the low-frequency region results from the Warburg impedance related to Li+ ion diffusion in the electrode material. The EIS fitting results were modeled using an equivalent circuit with a constant phase element (CPE) to reflect double-layer capacitance at the imperfect electrode interface. The charge transfer resistance values for LFP-3, LFP-7, and LFP-10 were 49 Ω, 75.3 Ω, and 96.3 Ω, respectively, suggesting that the reaction kinetics involving Li+ and electron exchange are more favorable in the sample using a small-sized precursor. This is consistent with the capacity and polarization shown in Fig. 7(a, d), suggesting that LFP samples with shorter reaction times exhibit larger specific surface areas and optimal bulk morphologies.
Li+ ion diffusivities (DLi⁺) were also calculated using the slope from the linear fitting of the Z' vs. ω-1/2 plot in Fig. 7(f). The diffusion coefficient (DLi⁺) is given by Eq. (2).
R, T, F, A, and C are the gas constant, the absolute temperature, Faraday constant, electrode surface area, concentration of Li+ in the material, respectively. σ is the slope obtained from the Z' vs. ω-1/2 plot. The calculated Li+ ion diffusion coefficients for LFP-3, LFP-7, and LFP-10 were 7.9462 × 10⁻¹¹ cm2 S-1, 7.7256 × 10⁻¹¹ cm2 S-1, and 2.4144 × 10⁻¹¹ cm2 S-1, respectively. The LFP-3 sample exhibited the highest Li+ ion diffusion coefficient, confirming its superior electrochemical performance owing to its smaller crystallite size and large specific surface area. In contrast, LFP-10 sample showed approximately three times lower Li+ diffusivity than LFP-3 due to the larger crystallite and secondary particle size, which extended the Li+ diffusion path.
4. Conclusion
In this study, we investigated the effect of the precursor size on the battery performance of the resulting LiFePO4/C active materials. LiFePO4/C cathode materials synthesized from FePO4 precursors exhibited superior electrochemical performance despite their larger size, likely due to small primary particles, which offers shorter Li+ diffusion path. Our findings also suggest that a scalable synthesis method for larger particles can be applied to achieve LFP with higher volumetric energy density. In addition, our study highlights that ammonia, a common chelating agent, is not working as a complexing agent at low pH values. To synthesize micro-sized LFP with high energy density, appropriate chelating agents that influence the nucleation and growth of precursors should be investigated further.


