


1. Introduction
Thermoelectric(TE) generators could be an important part of the solution to today’s energy challenge by converting the waste heat from power plants, automobiles and so on into electricity through the thermoelectric power of solids without producing greenhouse gasses. The performance of TE materials is generally evaluated in terms of a dimensionless figure of merit Z with the definition ZT = S2 σT/k, where S, σ, T and k are the Seebeck coefficient, electrical conductivity, absolute temperature, and thermal conductivity, respectively. From definition it is seen that, the performance of the thermoelectric materials should be increased by increasing the so-called power factor (PF = S2 σ) as well as decrease the thermal conductivity. The Seebeck coefficient and the electrical conductivity are both depend on the charge carrier concentration. For high charge carrier concentration the electrical conductivity usually increased but the Seebeck coefficient also decreased simultaneously. To achieve a large value of power factor it is important to find a balance point. The S could be increased by increasing the effective mass m* of the carrier though the carrier with heavy m* leads to low σ due to small mobility. On the other hand, k of a material can be effectively suppressed by enhancing phonon scattering at the grain boundaries by the introduction of a nanostructure1) and a second phase.2) Recently, various high-performance thermoelectric materials such as Bi2Te3,3) Yb14MnSb11,4) and BiSbTe5) have been successfully developed which has ZT values more than 1.0. However, these compounds use rare or toxic elements that will limit their large scale commercial applications. Thus the current focus of research is on developing materials that are environmentally friendly and stable for high temperature applications.
Recently, at high temperatures, metal oxides have attracted significant attention for thermoelectric power generation because they are naturally abundant and nontoxic and have greater chemical and thermal stability over heavy metal alloys.6-8) Among metal oxides, crystalline SrTiO3(STO) is one of the promising thermoelectric material, which has the cubic perovskite structure. By substitutional doping on different sites9) (A-site and B-site) in the lattice or by creating oxygen vacancies,10) the electrical conductivity of STO can be easily varied from insulating to metallic. One research group has reported the large ZT value observed in the p-type oxide semiconductor NaCo2O4,11) hence extensive research studies have been carried out on one promising n-type oxide insulator candidate, SrTiO3. SrTiO3 has a direct bandgap energy of 3.75 eV12) with very low σ. Substitutional doping on different sites(A-site and B-site) in the lattice is generally adopted to enhance σ. For example, Dehkordi et al. reported that Pr-doped SrTiO3 ceramics showed improved carrier mobility, and a ZT value of 0.35 was obtained at 500 °C.13) Moreover, other common elements, such as Nb and La have also been selected to effectively optimize the electrical properties.14,15) The objectives of our research are to investigate the effects of vanadium substitution on the thermoelectric properties.
2. Experimental Procedure
Vanadium substituted SrTiO3 was prepared by a conventional solid-state reaction of analytical grade reagents (AR) SrCO3(99.9 %), TiO2(99.9 %), and V2O5(99.9 %). Accurately weighted powders were ball-milled in ethanol by using a ZrO2 medium for 24 h. The dried powders were discretely sieved through 200 meshes and calcined at 1273 K for 6 h in air. To get desired fine particle size the calcined powders were then ball-milled for 72 h. The powders were placed in a die(10-mm diameter) and hotpressed in vacuum under a pressure of 70 MPa at 1573 K for 2 h. The disk specimen were then cut into rectangular pieces of 3 × 3 × 10 mm3 to measure the Seebeck coefficient and the electrical conductivity, and cylindrical pieces of 10 mm(diameter) × 1 mm(length) to measure the thermal conductivity, Hall coefficient and carrier concentration.
The phase purity was determined by using powder Xray diffraction(XRD; Bruker D8 Advance system). The density was calculated based on Archimedes principle. The micrographs of the specimens were observed by using a scanning electron microscope(SEM; FEI Quanta 400 system). The Hall coefficient, Hall mobility and Carrier concentration were measured by van der Pauw method (Keithley 7065) at room temperature in a 1 T magnetic field at a 50 mA electric current. The thermoelectric properties, including the Seebeck coefficient and electrical conductivity, were measured at 300-1000 K in an Ar atmosphere using the temperature differential and the 4- probe methods(Ulvac-Rico ZEM-3 system). The thermal conductivity was determined from the measurements of the thermal diffusivity, specific heat, and density by using the laser flash method(Ulvac-Rico TC-9000 system). The thermal conductivity was calculated from the thermal diffusivity(β), specific heat capacity(Cp), and density(ρ) using the following equation, k = ρCpβ.
3. Results and Discussion
The lattice parameter was calculated by using multiple peak-separation method and the results for c/a ratios for the perovskite phases are also plotted as a function of V contents in Fig. 1(a). From the figure it can be seen that the lattice parameter slightly decreased with increasing V contents. Generally, the diffraction angle increased with decreasing lattice constants for example, [110] peak shift to higher diffraction angles as shown in Fig. 2(c). Such a decrease in the lattice parameter is related to the replacement of large size Ti3+ ions (0.67 Å) in the B sites of the perovskite structure with the small sized V5+ ions (0.46 Å). For more than 0.5 mole% doping level, though the diffraction angles shifts to lower diffraction angles, the lattice parameter decreased with increasing doping level may be due to the presence of impurities and secondary phase as shown in Fig. 1(a). Fig. 1(b) illustrates the relative densities of all the hot pressed samples for different V substitution. The relative densities of all the samples varied from 98.75 % to 99.18 %. The densities increase with doping up to 1.0 mole% and then decreases with increasing further doping. Sample with high density shows the maximum value of ZT because of the higher electrical conductivity. In this research, 1.0 mole% sample shows the highest density and the highest ZT value. A maxi- mum density 5.068 g/cm3 was obtained for the SrTi0.99- V0.01O3 specimen hot pressed at 1573 K.
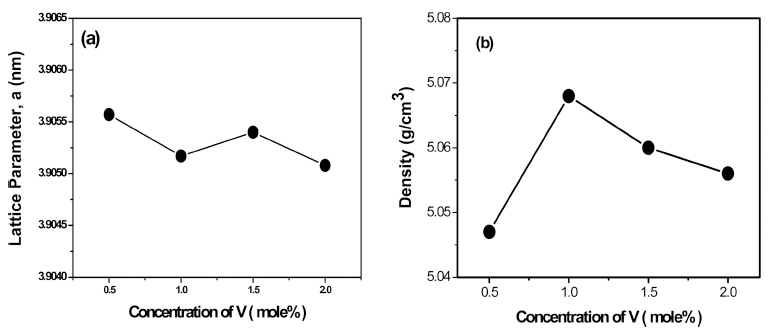
Fig. 1
(a) Lattice parameter as a function of the V content, and (b) density of sintered V-substituted SrTiO3 at 1573 K.
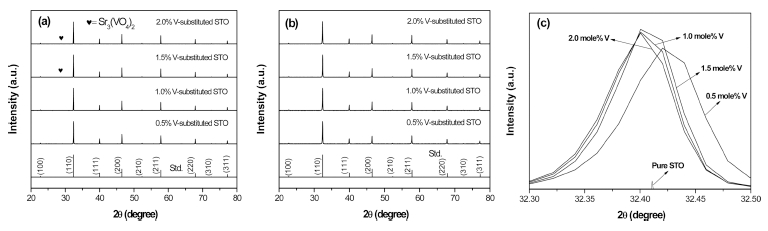
Fig. 2
(a) X-ray diffraction patterns of calcined V-substituted SrTiO3 synthesized by a solid-state reaction method, (b) X-ray diffraction patterns of sintered V-substituted SrTiO3 and (C) [110] diffraction peak for different V substituted SrTiO3 with pure STO.
Fig. 2(a) shows the X-ray diffraction patterns of calcined 0.5 mole%, 1.0 mole%, 1.5 mole%, and 2.0 mole% Vsubstituted STO together with pure STO. From figure it can be seen that the high purity major phase formed for V-substituted SrTiO3 compared with standard pure STO (ICDD # 01-079-0174). However, for more than 1.0 mole% of V-substitution a very small peak of a secondary Sr3(VO4)2 phase was observed after calcination at 1273 K. Fig. 2(b) shows the X-ray diffraction patterns for the V-substituted SrTiO3 specimens sintered at 1573 K. Though there is no secondary phase of Sr3(VO4)2 in Fig. 2(b) after sintering, it was clearly seen to play an important role in the reduction of the densities and the gran size when comparing XRD results with density and scanning electron microscope results(Fig. 1(b) and Fig. 3 respectively). Moreover, with increasing doping level the lattice parameter decreased as shown in Fig. 1(a) due to the replacement of large size Ti3+ ions (0.67 Å) in the B sites of the perovskite structure with the small sized V5+ ions (0.46 Å). The doping dependence of the lattice parameter and high purity single-phase XRD patterns clearly suggested the nature of V-substituted SrTiO3 powders with actually controlled doping levels.
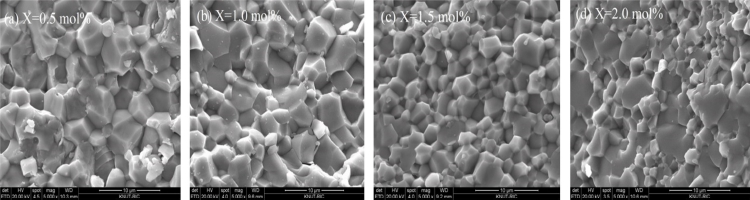
Fig. 3
Scanning electron micrographs of surface of the sintered V-substituted SrTiO3: (a) 0.5 mole%, (b) 1.0 mole%, (c) 1.5 mole%, and (d) 2.0 mole%.
The SEM images of the sintered samples containing various amounts of V contents are shown in Fig. 3(a-d). From figure it is clearly seen that, the grain size seems to be decreased by the addition of V2O5 into SrTiO3. The average grain size are approximately 3.50 μm, 3.40 μm, 2.20 μm, and 1.40 μm for 0.5 mole%, 1.0 mole%, 1.5 mole%, and 2.0 mole% respectively. Such a decrease is related to the replacement of large size Ti3+ ions (0.67 Å) in the B sites of the perovskite structure with the small sized V5+ ions (0.46 Å). This behavior can also be explained based on a pinning effect due to the secondary phases. Probably, with increasing V contents, the amount of the second phase of Sr3(VO4)2 increases(as indicated in the XRD patterns, Fig. 2(a)), which may hindered the grain growth. Such type of change in grain size suggests that the microstructure of SrTiO3 materials could be influenced by introducing small amount of vanadium.
The temperature dependences of the Seebeck coefficient, electrical conductivity, thermal conductivity and lattice thermal conductivity, respectively for the V-substituted SrTiO3 samples sintered at 1573 K in a vacuum is shown in Fig. 4(a-d). Fig. 4(a) shows the temperature dependences of the Seebeck coefficient of the V-substituted SrTiO3. In this research, a negative value of Seebeck coefficient suggests that all the samples are ntype and that the major carrier is an electron because for an n-type conductor a negative Seebeck coefficient is obtained. Generally, with increasing measurement temperature and carrier concentration the absolute value of the Seebeck coefficient should increase in magnitude.16-19) In this study, the Seebeck coefficient decreased with increasing V concentration up to 1.0 mole% because though the carrier concentration increased but the Hall mobility decreased rapidly and for x > 1.0 mole% the Seebeck coefficient increased with increasing V concentration due to increasing carrier concentration and slow decreasing of Hall mobility(as shown in Table 1). In this research, the maximum absolute value of the Seebeck coefficient(504 μVK−1) was observed at 973 K for 2.0 mole% of V content.
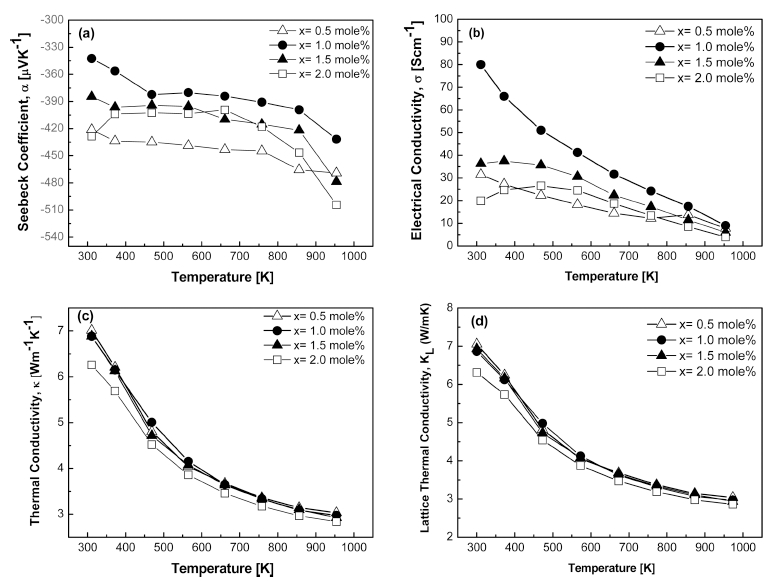
Fig. 4
Thermoelectric properties of V-substituted SrTiO3: (a) Seebeck coefficient, (b) electrical conductivity, (c) thermal conductivity, and (d) Lattice thermal conductivity.
Table 1
List of Hall coefficient, Hall mobility and carrier concentration of V-substituted SrTiO3 composites at room temperature.
Fig. 4(b) demonstrates the temperature dependence of the electrical conductivity of V-substituted SrTiO3 samples. With increasing temperature the electrical conductivity decreased up to 1.0 mole% V contents due to the degenerating behavior. For more than 1.0 mole% V contents, with increasing temperature up to 473 K first the electrical conductivity increased and then decreased, which is also observed in bulk La-doped STO samples with an actual doping level of 9.0 % by Park et al.20) At low temperatures such a peak behavior is related to the semiconductor- like nature, because at low temperatures some excess electrons tend to be localized and can be thermally excited. This may be due to the generation of the second phase or distortion of local structures.20) At temperature more than 450 K, the electron concentration should be temperature independent because all excess electrons are reasonably excited. The electrical conductivity of V-substituted SrTiO3 is higher than that of pure STO because the carrier concentration of V-substituted SrTiO3 is higher than that of pure STO due to the replacement of V3+ by Ti5+, which generates electrons. The similar work was reported by Mahmud et al.21) In this study, with increasing doping level up to 1.0 mole%, the electrical conductivity increased and then decreased as the V content was increased. This increasing behavior of the electrical conductivity is related to the increasing carrier concentration, though the carrier mobility decreased with increasing doping level(as shown in Table 1). For more than 1.0 mole% vanadium substitution, the electrical conductivity decreased with V contents. This decreasing behavior can be explained by the grain size effect. Though the carrier concentration is slightly increased but the grain size decreased drastically(as shown in Fig. 3) which may decreased the conduction process as well as decreased the electrical conductivity. A similar observation was also reported that, La doping in the SrTIO3 increased the grain size, which enhanced the conduction process.22,23)
Figs. 4(c) and 4(d) shows the temperature dependence of the thermal conductivity and lattice thermal conductivity for various V-contents within the experimental range. Generally, the total thermal conductivity is composed of the electrical thermal conductivity and lattice thermal conductivity. In this study, for 0.5 mole% vanadium substitution the total thermal conductivity is 7.01Wm−1K−1 and lattice thermal conductivity is 6.99 Wm−1K−1 at 300 K. Therefore, lattice thermal conductivity made a major contribution(approximately 99.71 %) to the total thermal conductivity. With increasing vanadium concentration of the substituted STO system, no significant doping dependence was found in lattice thermal conductivity, again implying that the lattice contribution is dominant rather than the changing carrier density at different doping levels as found in other electron doped STO materials. In this study, the total thermal conductivity observed is in good agreement with results from Park et al.20) and Kikuchi et al.24) and significantly smaller than that of single crystalline SrTiO3.15)
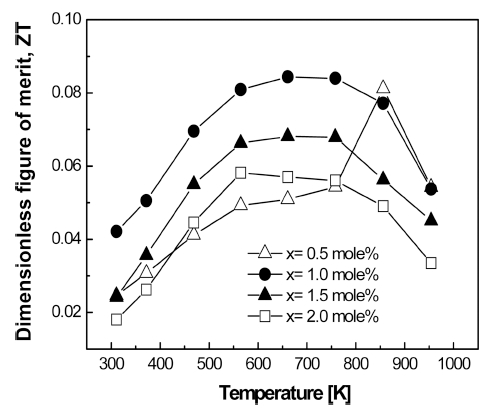
Fig. 5 illustrates the temperature dependence of ZT values calculated from the measured Seebeck coefficient, electrical and thermal conductivity for the V-substituted SrTiO3 sample sintered at 1573 K. A relatively high figure of merit was obtained for V-substituted STO compared to pure STO because of the combination of the relatively high Seebeck coefficient and electrical conductivity with low thermal conductivity. This suggests that the thermoelectric figure of merit of SrTiO3 can be increased by careful tuning of an appropriate dopant. From Fig. 5 it is clearly seen that, for all doping levels, ZT increased with increasing temperature and reached maximum values at 673 K. In this study, the SrTi0.99V0.01O3 composition shows higher figure of merit of 0.084 around a temperature of 673 K due to the combination of the relatively high Seebeck coefficient and high electrical conductivity with the low thermal conductivity.
4. Conclusions
Eventually, V-substituted SrTiO3 was successfully synthesized by using a conventional solid-state reaction method. The bulk materials were obtained by hot-pressed plus sintering process and the effect of V on the thermoelectric properties of the V-substituted SrTiO3 samples has been studied. With increasing doping level, though no significant doping dependence of thermal conductivity was observed, a reasonable balance point between the Seebeck coefficient and the electrical conductivity seemed to be present in the most optimized doping level of 1.0 mole%. In this research, a remarkable thermoelectric performance with the highest value of the figure of merit, ZT = 0.084 at 673 K is realized upon 1.0 mole% of V substitution. Note that for improving the thermoelectric performance of SrTiO3, vanadium doping should be the promising technique.