

1. Introduction
2. Experimental Procedure
2.1. Specimens
2.2. Impact tensile test
2.3. Tensile test
2.4. Analysis methods
3. Results
3.1. Mechanical properties
3.2. Observation of the fracture surface
3.3. FEM analysis results
4. Discussion
4.1. Impact tensile properties
4.2. Effect of strain rate on intergranular fracture
4.3. Effect of specimen dimensions on intergranular fracture
5. Conclusion
1. Introduction
6000 series aluminum alloys are attracting attention as liner materials for high-pressure hydrogen tanks of hydrogen fuel cell vehicles because they are lightweight and have excellent corrosion resistance.1,2,3) They are also being applied to automotive body panel materials due to their excellent plastic hardening properties.4,5) However, because they exhibit moderate strength, research is underway to improve their strength by adding Si-rich or Cu. So far, studies on the impact properties of 6000 series alloys have been reported on the relationship between strain rate and test temperature for T6 materials6,7,8,9) and O materials,10) the distribution of secondary phase particles11,12) and the influence of solute atoms13,14) and for thin sheet materials, there are reports on 5000 series alloys15) and 7000 series alloys,16) but there are few reports on 6000 series alloys.
In addition, it has been reported that excessive Si addition to Al-Mg-Si alloys is prone to grain boundary cracking and reduces ductility.17,18) Studies on grain boundary cracking in Al-Mg-Si alloys with excessive Si addition have investigated the effects of heat treatment conditions,19,20) material composition21,22) and strain rate (low strain rate region).23) In addition, studies have been reported on the deformation of the grain boundary from a microscopic point of view, such as grain size24) and grain boundary precipitates25) and Cao et al.26) considered preferential fracture of the grain boundary as a factor causing grain boundary cracking.
The authors conducted static and dynamic tensile tests on 6000 series alloy thin sheet materials with Si-rich composition and Cu addition for the purpose of improving strength and formability, and obtained the results that the static tensile properties varied with the specimen size. They also obtained the results that the tensile properties of the same specimen size varied with the deformation rate. Static tensile tests were performed on Si-rich alloy specimens by varying the reduced section-to-plate thickness ratio (W/T) and crystal grain diameter d, as previously reported,27) and the specimen size dependence of tensile properties was explained in terms of the ratio of geometry and microstructure factors, which is W/d.
Therefore, this study was conducted with two objectives. Firstly, thin sheet materials of Si-rich 6000 series alloys with different crystal grain diameters d with and without Cr addition were studied. The impact tensile properties were evaluated by performing Split-Hopkinson bar impact tests using specimens with different aspect ratios, W/T, and aging conditions, and the effects of specimen geometry and strain rate dependence on impact tensile properties were investigated by finite element method (FEM) analysis. Secondly, tensile tests were conducted at three different dynamic strain rates, 10-1/s, 10-4/s, and 3 × 10⁻³/s, using specimens of ASTM standard size to investigate the effect of strain rate and specimen size on the grain boundary fracture of alloys with excessive Si addition.
2. Experimental Procedure
2.1. Specimens
The Al-Mg-Si system alloy used in this experiment is a 1 mm thick plate made by cold rolling after homogenization and hot rolling, and the chemical composition and average grain size of the specimens are shown in Table 1.
Table 1.
Chemical composition of Al-Mg-Si alloys (mass%) and grain size (d).
The Mg content was kept constant at 0.7 mass%, and the amount of excess Si added was 0.35 mass%, which is called alloy A1, and the amount of excess Si added was 0.66 mass%, which is called alloy B1. Alloy A1 and alloy B1 were further refined by adding Cr to refine the grain size, and the alloys were named alloy A2 and alloy B2, respectively. The heat treatment was a solubilization treatment at 813 K for 3.6 ks, followed by a quenching in ice water, and an aging treatment (T6 treatment) in oil at 448 K. The aging time was determined by hardness testing. The aging time was measured by hardness test, with 3.6 ks as the under-aging (UA) and 28.8 ks as the peak-aging (PA) for the highest hardness. The grain shape was almost equiaxed in the rolling plane.
2.2. Impact tensile test
Specimens with the geometry shown in Fig. 1(a) were fabricated with two variations of W alone. Table 2 lists the specifications of all specimens.
The specimen setup was made of 2017-T4 material with jig and ring for screwing the input and output rods and specimen as shown in Fig. 1(b). The impact tensile test was conducted at a strain rate of 1 × 10³/s at room temperature using a tensile Split-Hopkinson bar impact testing machine shown in Fig. 1(c). Both the input and output rods were made of 2017-T4 (aluminum) with a diameter of 14 mm, and the impact cylindrical tube was made of 2017-T4 (aluminum) with an outer diameter of 20 mm, an inner diameter of 16 mm, and a length of 700 mm.
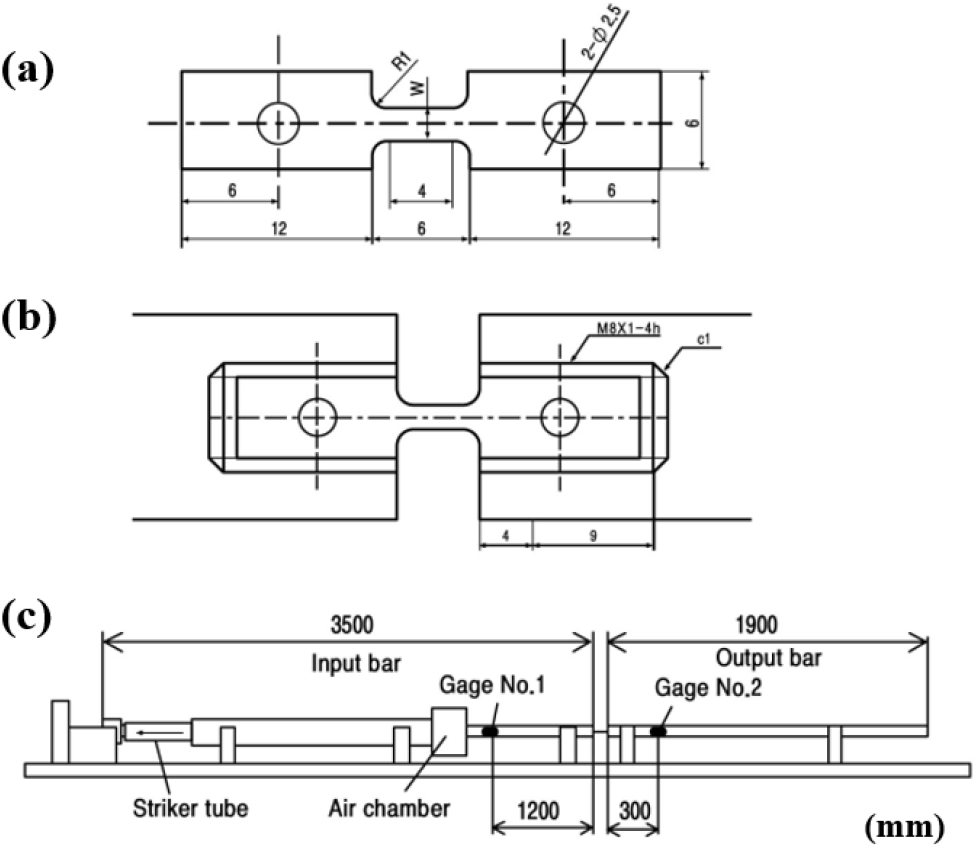
Table 2.
Specifications of all specimens of the impact tensile test specimens.
| Specimen | Width W (mm) | Width / Grain size W / d |
| A1S1 | 2 | 14 |
| A1S2 | 3 | 22 |
| A2S1 | 2 | 65 |
| A2S2 | 3 | 97 |
The nominal stress -nominal strain graph and the strain velocity obtained from the impact tensile test were obtained from the following equations according to the one-dimensional stress wave propagation theory.28)
where, is the velocity of propagation of the vertical elastic wave in the input and output rods, calculated using ( = 71.6 GPa, 𝜌 = 2.79 kg/m3)29) using the vertical modulus of elasticity and density 𝜌 of the input and output rods. , , and are the initial cross-sectional area of the specimen, the length of the reduced sections, and the cross-sectional area of the input and output rods. is the time at which the stress wave starts to develop, and the subscripts , and denote the incident, reflected, and transmitted waves.
2.3. Tensile test
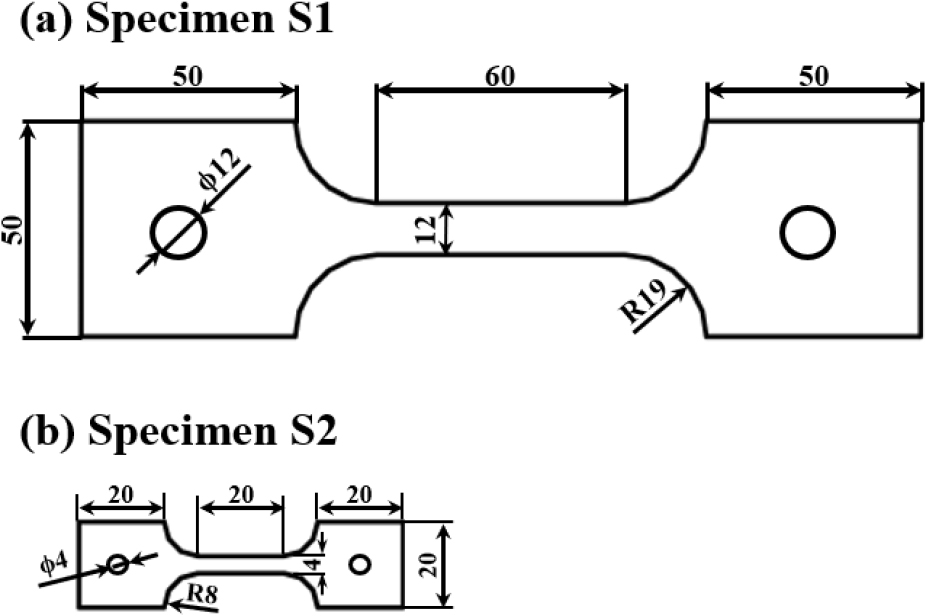
For comparison with specimen S1 of the geometry and dimensions shown in Fig. 2(a), a specimen S2 with a quarter of the specimen dimensions [Fig. 2(b)] was used for comparison with S1. Specimen S2 has a cross-sectional aspect ratio (width/thickness) of 4, which is almost identical to the cross-sectional aspect ratio of 3 of the specimen that exhibited an unusual elongation in a previous study.27) Tensile tests were performed at strain rates of 10-1/s (high speed), 3 × 10⁻³/s (medium speed), and 10-4/s (low speed) at room temperature using an Instron-type tensile testing machine, and three tests were performed for each specimen. The yield stress was calculated by dividing the stress measured by the load gauge by the initial cross-sectional area, and the strain was measured by a dynamic strain gauge with a strain gauge attached to the center of the reduced section. The elongation at break was obtained by inserting a center line into the gauge section of the specimen before starting the test and measuring it with a measuring microscope (MF-UA1720TH, Mitutoyo) after the test.
2.4. Analysis methods
2.4.1. A1 and A2 specimens
The FEM analysis was performed using ANSYS LS-DYNA to analyze the impact tensile analysis and investigate the effect of specimen geometry on the impact deformation process. The constitutive relationships were obtained from static tensile tests of each size specimen of UA material. For alloy A1, the strain-rate dependence was assumed to be independent of the strain rate, and for alloy A2, the Cooper-Symonds relationship was used, considering the strain-rate dependence shown in Eq. (4).
where, is the dynamic flow stress, is the static flow stress, is the strain rate, and C and P are material constants representing strain rate sensitivity. The material constants representing strain rate sensitivity were determined by trial and error so that the transmitted wave obtained from the experiment and the transmitted wave obtained from the analysis were almost the same. The material constants of each test specimen are shown in Table 3. The material constants of the input and output rods were Young’s modulus of 71.6 GPa, Poisson’s ratio of 0.33, and density of 2.79 kg/m3. The boundary condition was a trapezoidal waveform with a time of 30 µs starting at one end of the input rod, with an input value of 84,050 for the input and output rods and an input value of 2,238 for the specimen with a minimum input length of 0.167 mm.
Table 3.
Material constant of each test specimens for FEM analysis.
2.4.2. All specimens
FEM analysis was performed using a simplified grain model to investigate the effect of plane strain restrained or restrained by surrounding grains on grain boundary deformation. The FEM analysis was performed using ANSYS LS-DYNA for two-dimensional elasticity and plasticity analysis. The Young’s modulus and Poisson’s ratio of the grains were set to 70 GPa and 0.3, and the plastic deformation equation was set to 300 MPa yield stress and 1 GPa tangential modulus. The elastic properties of precipitation free zone (PFZ) were the same as those of grains, and the plastic properties were determined from the stress-strain characteristics of Al-6%Mg alloy O material30) with a yield stress of 100 MPa and a tangential modulus of 1 GPa.
3. Results
3.1. Mechanical properties
3.1.1. Specimens A1 and A2
The tensile strength and elongation at fracture 𝛿 of UA and PA materials are shown in Fig. 3. 𝛿 was measured by actually controlling the fracture specimens.
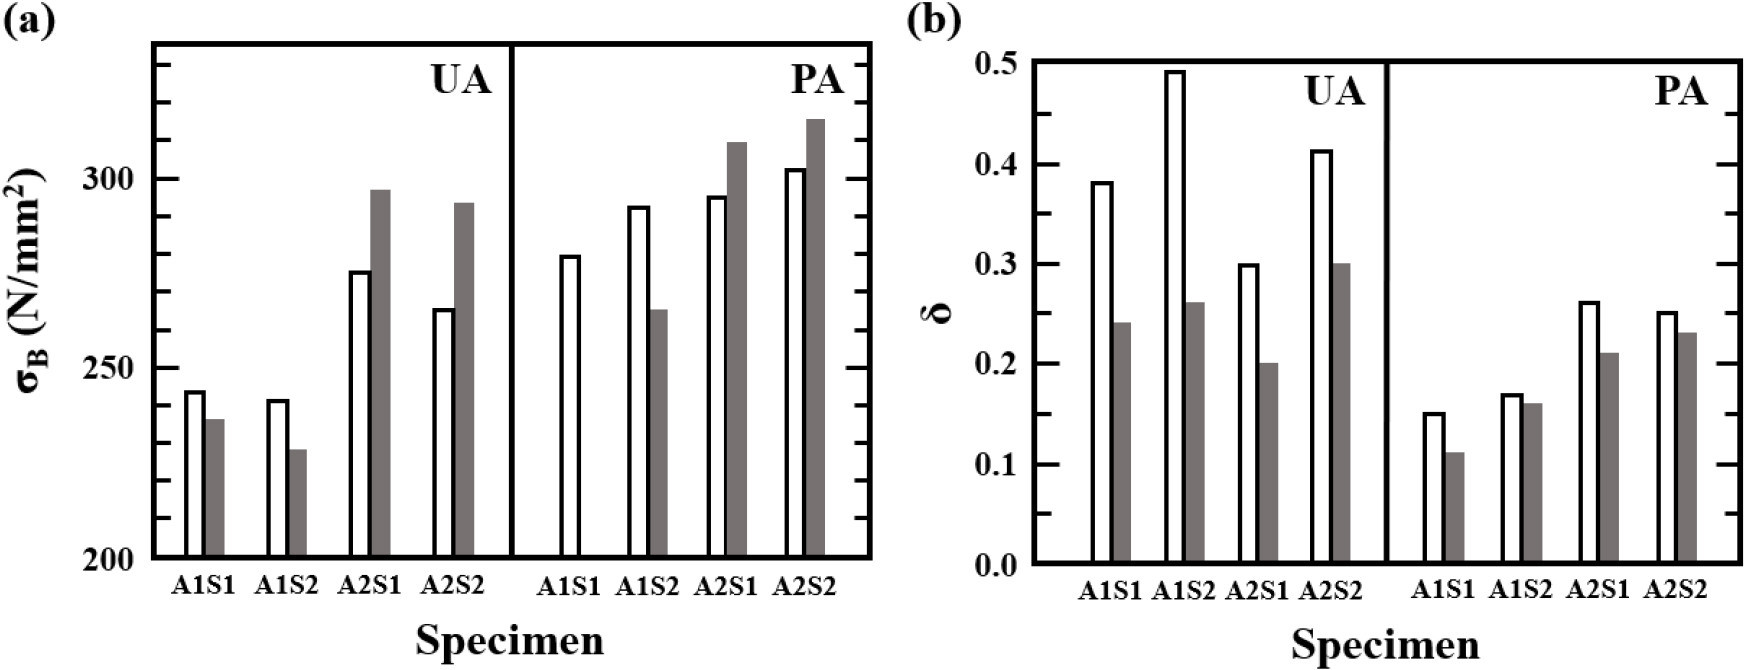
When comparing with the static test values, it can be seen that the UA material decreased by 7 MPa in A1S1 and 10 MPa in A1S2, but increased by 30 MPa in A2S1 and A2S2, which are fine-grained materials. In the case of A1S1, a PA material, it was not possible to measure the initial stress variation due to the large initial stress variation, but a similar trend to that of UA materials was observed, i.e., decreased in A1S2, a coarse-grained material, while it increased by 15 MPa in A2S1 and A2S2, a fine-grained material. The elongation at fracture, 𝜎, decreased for all alloys and specimens of all shapes compared to the static test. In particular, the decrease in UA materials was significant, with 40 % and 50 % decreases for A1S1 and A1S2, respectively, and 25 % decreases for A2S1 and A2S2.
3.1.2. All specimens
Table 4 shows the results of the yield strength and elongation at fracture measurements for all alloys, specimen geometries, and test conditions used in this experiment. The values of yield stress are strongly dependent on the grain diameter, with values around 320 to 340 MPa for fine grains, while 290 to 310 MPa for coarse grains. It can also be seen that for all alloys, the lower aspect ratio S2 specimens have a lower yield strength than S1 specimens.
Table 4.
Mechanical properties and wt/d2 effects of tested all alloys under different strain rates.
This result shows that the yield strength changes due to the binding force between particles, which is the same as previously reported.27) Therefore, the relationship between wt/d2, calculated as (specimen width w)/(grain diameter d) × (specimen thickness t)/(grain diameter d), and yield stress is shown in Fig. 4 to make it easier to see the relationship between each factor and yield stress.
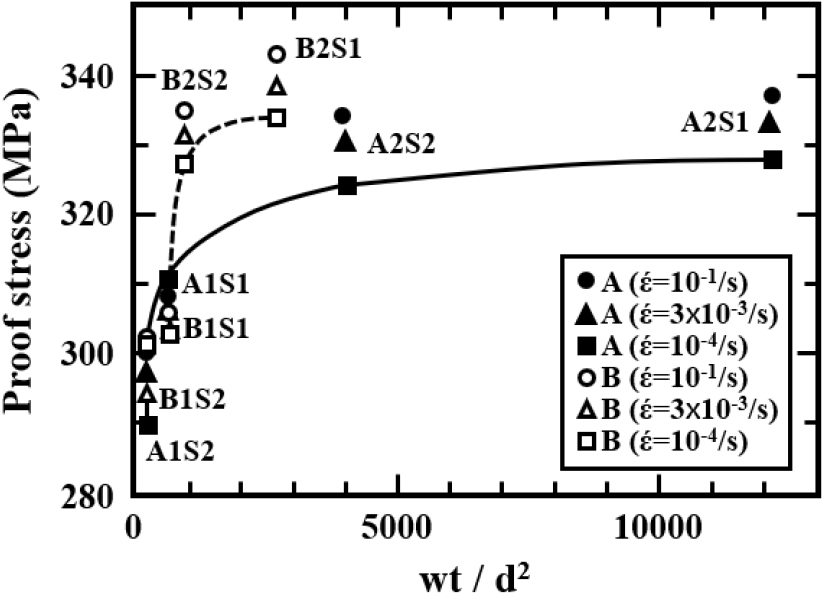
Miyazaki et al.31) used (test specimen thickness t)/(grain diameter d) as a parameter representing the confining force between particles, while the authors used (test specimen width w)/(grain diameter d).21) But, there were cases where it could not be applied to test specimens where the number of particles in thickness and width varied. However, using wt/d2, it was found that there is a certain relationship between the yield strength of all test specimens and the confining force between particles. First of all, for Alloy A, the yield stress increases rapidly with increasing wt/d2 until wt/d2 = 1,500 and then increases moderately thereafter. Alloy A2, with fine grains, shows a positive strain-rate dependence on yield stress regardless of the specimen size, while in alloy A1, with coarse grains, a positive strain-rate dependence was observed only for the small S2 specimen. The relationship between yield stress and wt/d2 for Alloy B does not show a smooth curve compared to Alloy A because there is little difference between the yield stress at wt/d2 = 640 for S1 specimen and the yield strength at wt/d2 = 210 for S2 specimen. The strain-rate dependence also showed a (+) dependence for Alloy B2, but no significant dependence for Alloy B1. When comparing Alloy A and Alloy B with different Si additions, the yield stress of Alloy A2 and Alloy B2 with smaller grain diameters is higher for Alloy B2 with more Si than Alloy A2, but when comparing Alloy A1 and Alloy B1, the yield strength is higher for Alloy A1. Since there is a clear correlation between wt/d2 and yield strength, it is considered that wt/d2 is an appropriate parameter to represent the binding force between particles. Therefore, we next plotted the relationship between wt/d2 and elongation at fracture in Fig. 5, as we believe that there is a relationship between grain boundary fracture and the binding force between grains, as previously reported.27)
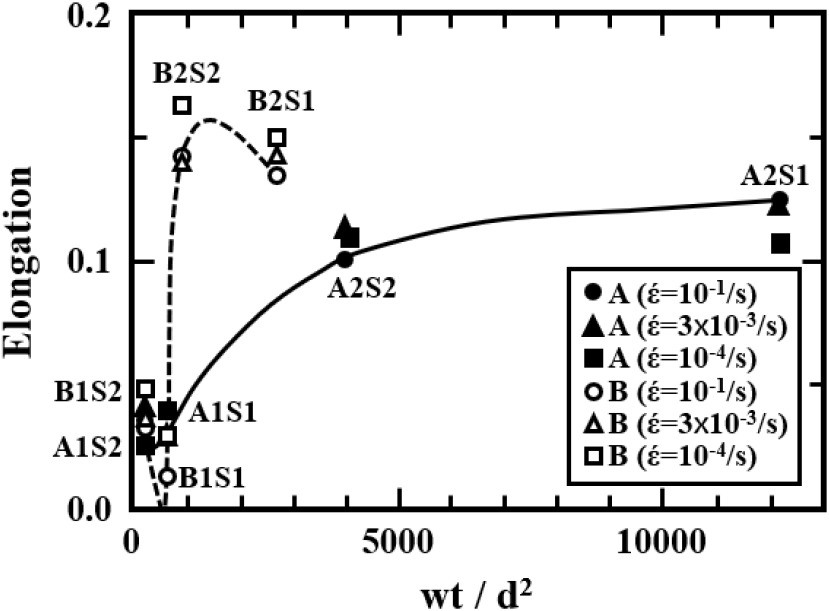
Focusing first on Alloy A, the elongation at break decreased with decreasing wt/d2 in the finer grained Alloy A2, but increased in Alloy A1 with decreasing wt/d2. This is the same trend as the previously reported results,27) but the amount of increase in elongation at fracture with decreasing wt/d2 decreased significantly. In addition, when examining the effect of strain rate, specimen S1 of alloy A1 showed a tendency to decrease the elongation at the fracture with increasing strain rate, and in particular, the elongation at the fracture at high speed decreased by about 20 % compared to that at low speed. However, specimen S1 of alloy A2 showed the opposite trend, with the elongation at fracture increasing with increasing strain rate. In particular, specimen S2 of alloy A1 and alloy A2 showed the highest elongation at fracture at medium speed, and the strain rate dependence of the elongation at fracture was different for alloy A depending on the size of the specimen.
The results for Alloy B show that the elongation at fracture increases with decreasing wt/d2 for both Alloy B1 and Alloy B2, and this tendency is more pronounced than for Alloy A. As for the strain rate dependence, it tends to decrease at higher speeds than at lower speeds, except for specimen S2 of alloy B2, and specimen S1 of alloy B1 has the lowest elongation at fracture of 1.2 % for all specimens and test conditions.
3.2. Observation of the fracture surface
3.2.1. Specimens A1 and A2
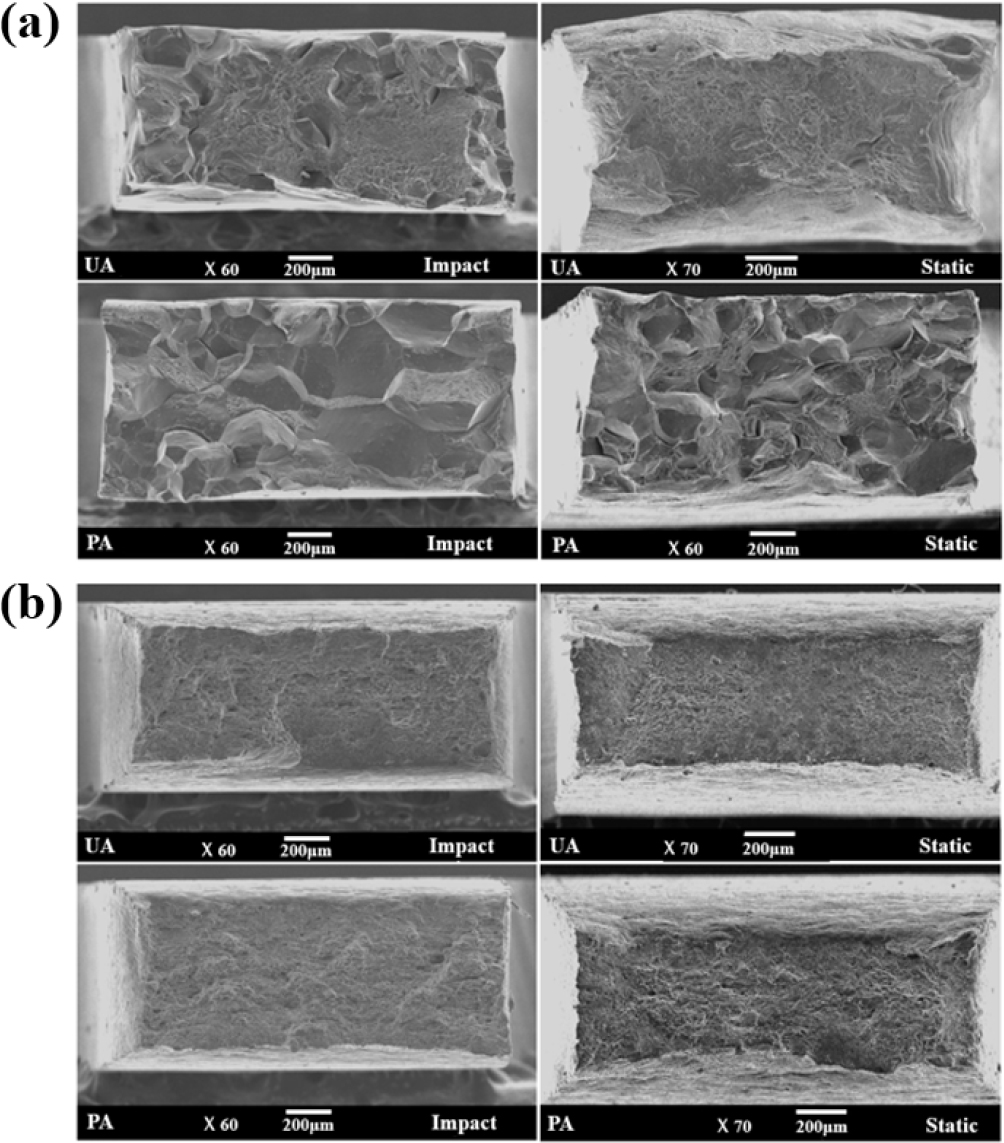
The scanning electron microscope (SEM) images of the fracture surfaces of specimens A1S1 and A2S1 are shown in Fig. 6 and compared to the images from the static test.27) Specimen S2 exhibited almost the same fracture surface morphology as S1. A1S1 [Fig. 6(a)] shows that the UA material in the static test exhibited a total transgranular fracture, while the impact test showed a mixed fracture morphology of transgranular and intergranular fracture. The PA material showed a mixed fracture type of transgranular and intergranular fracture in the static test, but the proportion of intergranular fracture increased in the impact test.
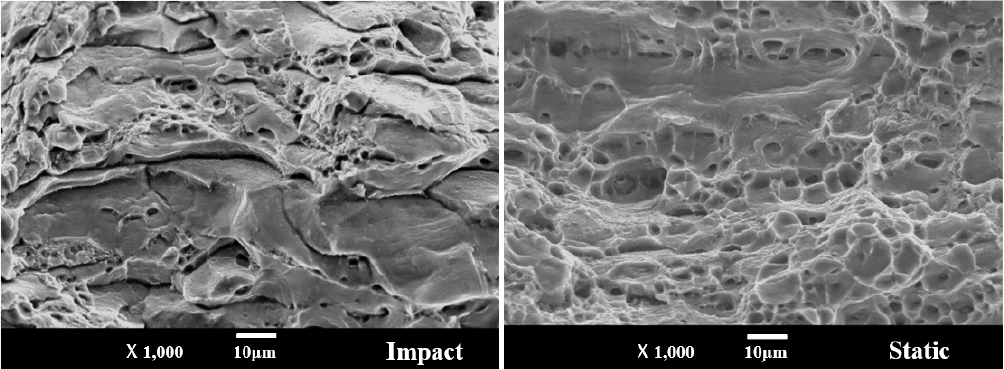
A2S1 [Fig. 6(b)] shows that both UA and PA materials exhibited transgranular fracture regardless of static and impact tests. However, when the fracture surface is magnified for PA material, as shown in Fig. 7, it exhibits a ductile fracture with a general transgranular dimple in the static test, whereas in the impact test, a part of the fracture surface exhibits a intergranular fracture, indicating a mixed transgranular and intergranular fracture surface.
3.2.2. All specimens
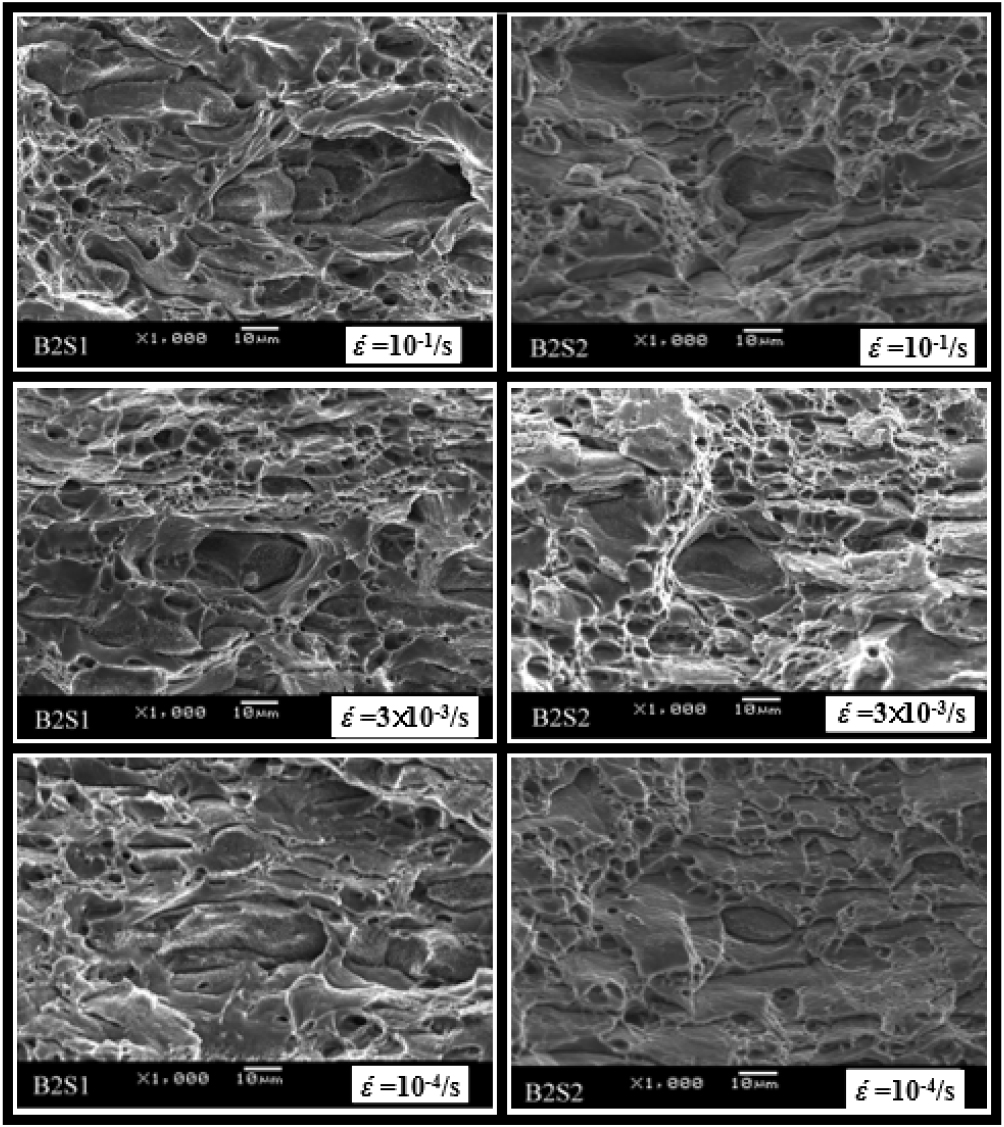
The fracture surfaces observed at low magnification for alloys with coarse grains were all a mixture of intergranular and transgranular fracture, and no difference could be observed. Therefore, the SEM images of the intergranular fracture surface in the center of the specimen section at strain rates of 10-1/s (high speed), 3 × 10⁻³/s (medium speed), and 10-4/s (low speed) for specimen S1 of alloy A1 and alloy B1 are shown in Fig. 8.
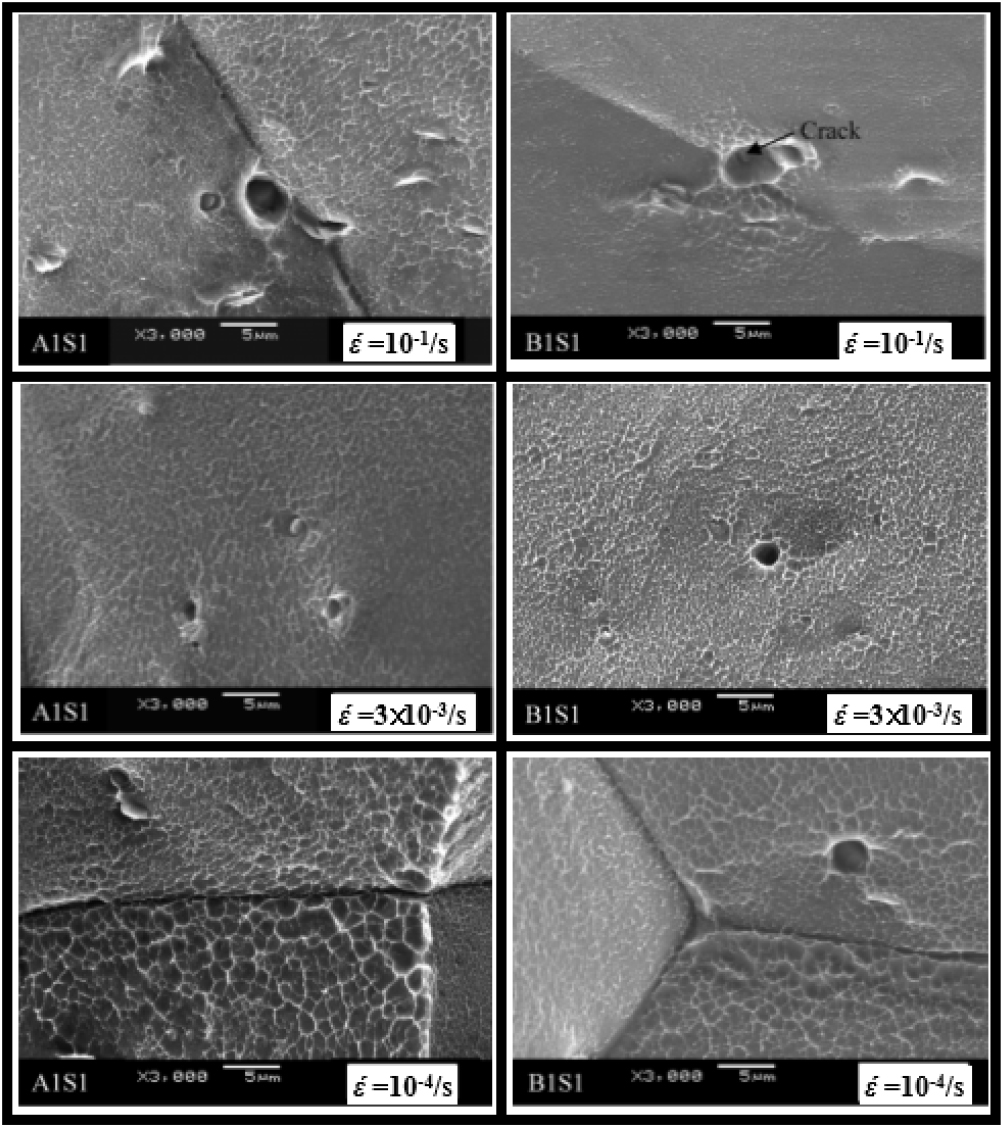
For alloy A1, fine dimples indicating intergranular ductile fracture were clearly observed at low speeds, but as the strain rate increased to medium and high speeds, the dimples became smaller in area and smaller in depth than at low speeds. Alloy B1 shows a more pronounced trend than alloy A1, and at high strain rates, the dimples are not as pronounced and the grain boundaries are brittle. In addition, voids of about 5 µm, which are traces of coarse precipitates, were deformed along the grain boundaries, and the bottom of the voids were observed to have fractured precipitates. At medium strain rates, fine dimples were observed, but no coarse grain boundary precipitates were observed. This tendency was almost identical for specimen S2.
The fracture surfaces of Alloy A2 and Alloy B2 showed transgranular fracture on almost all sides, regardless of specimen dimensions, at low strain rates. However, as the strain rate increased to medium and high strain rates, transgranular fracture surfaces with fine dimples were observed, especially for Alloy B2. Therefore, magnified images of the fracture surfaces for each strain rate for specimen S1 and specimen S2 of alloy B2 are shown in Fig. 9.
Compared to specimen S2, which has a smaller aspect ratio, specimen S1 has many grains with grain boundary cracks, and the grain boundary cracks are more pronounced at higher strain rates.
3.3. FEM analysis results
3.3.1. Specimens A1 and A2
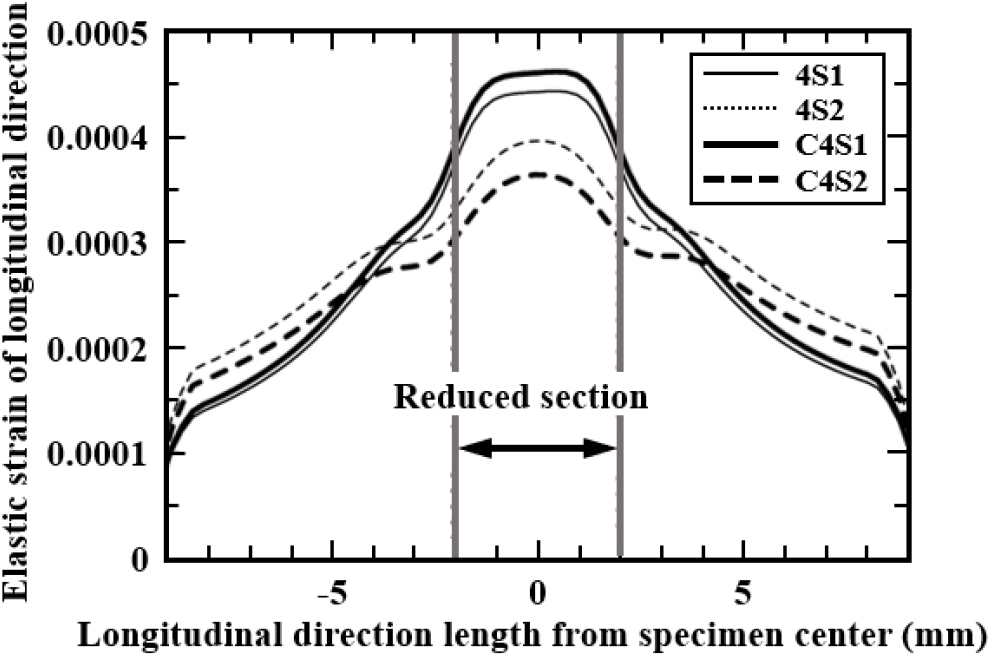
The slope of the elastic region of the stress-strain curve obtained from the impact test, i.e., the longitudinal modulus of elasticity, was analyzed by impact FEM. Fig. 10 shows the analysis results of the elastic strain distribution in the direction of the center tensile axis of each specimen (0.45 ms after the start of the analysis). The strain distribution in reduced section of specimen S1 was very uniform compared to that of specimen S2, regardless of the alloy type. In specimen S2, the strain was maximized at the center of the reduced section (±0 mm), and the difference in strain at the shoulder section (±5 mm) was relatively small. In other words, the stress concentration at the bottom of the fillet from a point with a large width relative to the length of the reduced section caused an uneven strain distribution in the reduced section, and the elastic modulus was degraded because the strain was also applied to the shoulder section.
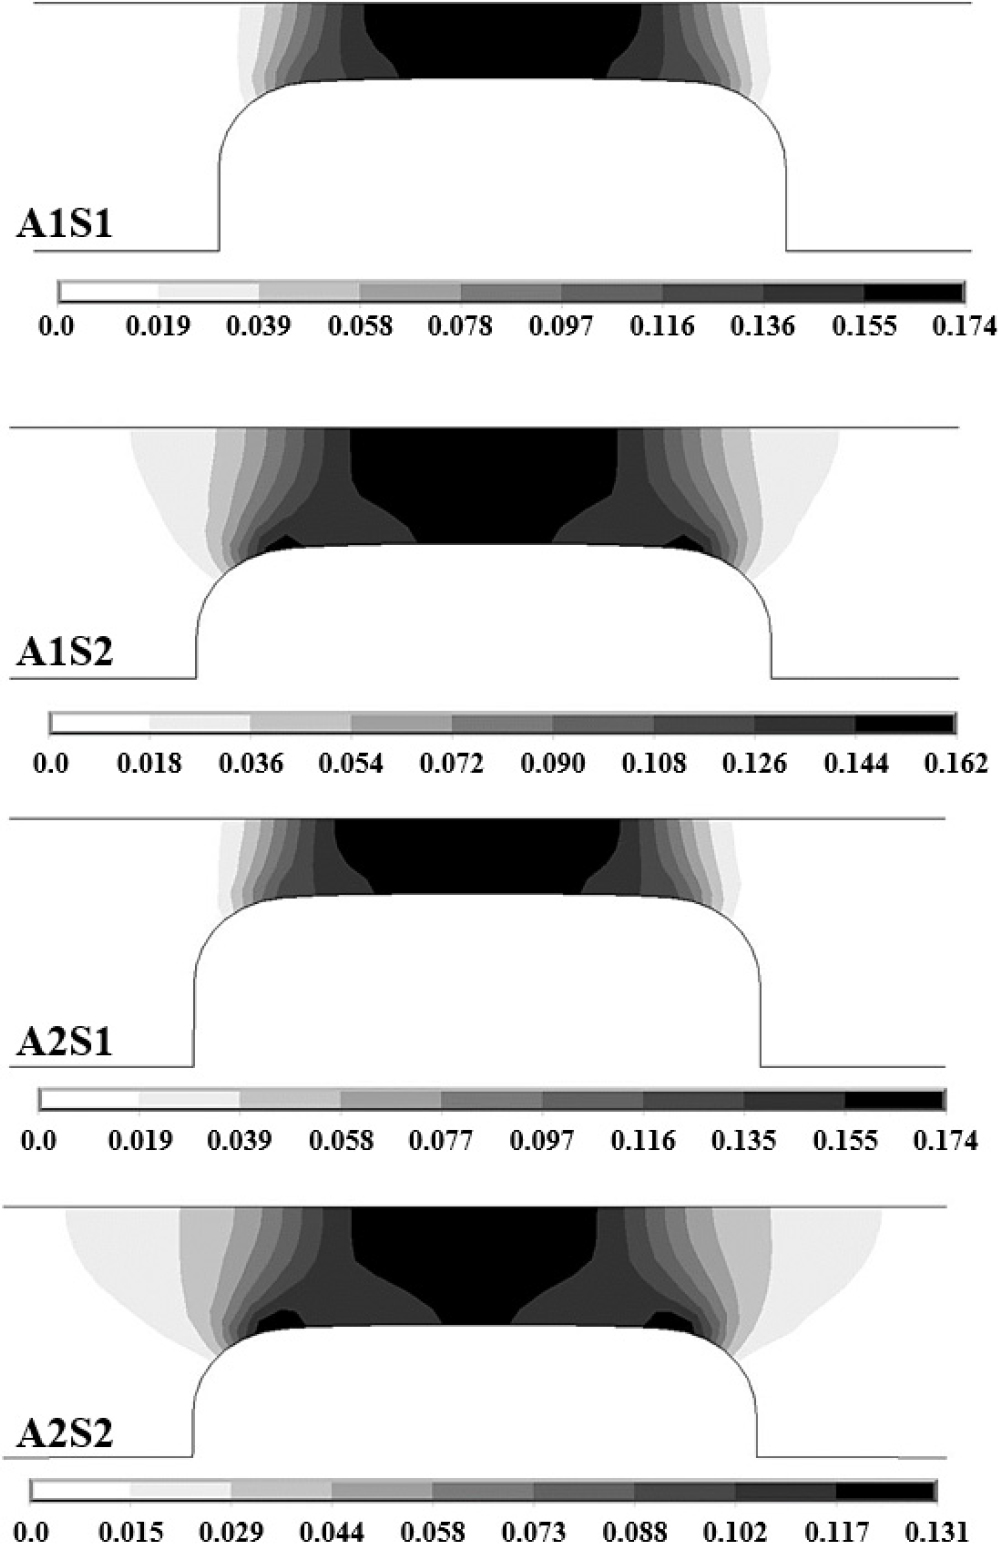
The results of the analysis (0.64 ms after the start of the analysis) for the plastic strain distribution in the reduced and shoulder sections of the specimen in the plastic region are shown in Fig. 11 as contour lines. In specimen S1, there is a relatively uniform strain distribution in the reduced section, with strain concentrated at the bottom of the fillet and no plastic strain propagation toward the shoulder section. However, in specimen S2, especially for alloy A2 with fine grain size, the plastic strain distribution in the reduced section is uneven and plastic strain propagation occurs from the shoulder section to the grip section.
3.3.2. All specimens
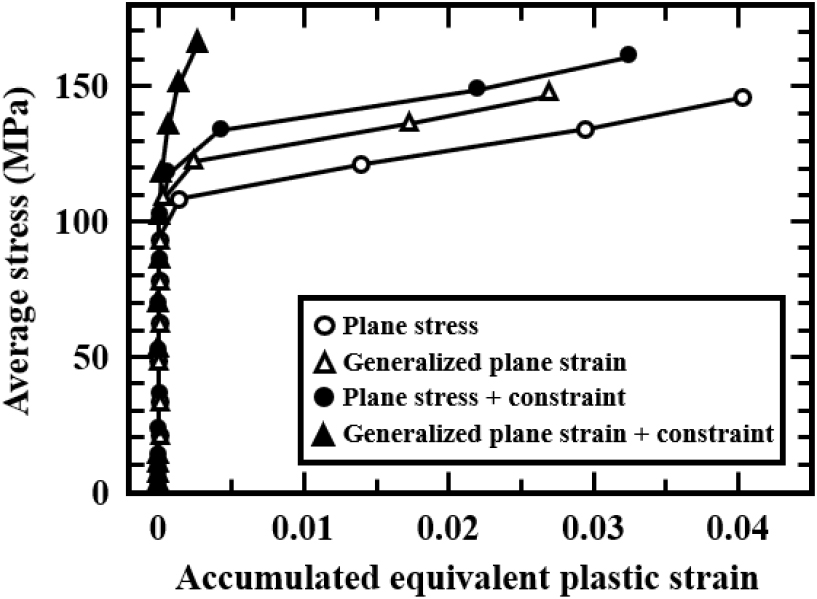
The effect of plane strain constraint, which can be considered as a cross-sectional aspect ratio effect, or peripheral constraint, which can be considered as a wt/d2 effect, on the intergranular strain was investigated by FEM analysis. Fig. 12 shows the relationship between the average stress in the tensile direction and the accumulated equivalent plastic strain in the center of the PFZ for each condition.
Under the condition of plane stress only (○ in Fig. 12), the PFZ showed a significant plastic deformation rate of about 4 %, and a lot of plastic deformation occurred even though the average stress was less than 300 MPa and the transgranular did not reach the yield stress. Even under the plane strain condition (△ in Fig. 12), the plastic deformation rate is about 2.6 %, and it can be seen that the strain constraint on the PFZ by the grain is difficult to act. This is because the shear strain is not related to the Poisson’s ratio, so it is difficult to influence the strain constraint by the grains on the PFZ. Therefore, in the general plane strain rate condition with constraint in the thickness direction, the significant plastic strain rate is about 1.4 % smaller than in the plane stress condition, and it can be seen that the deformation of PFZ is suppressed. In particular, the results of the case where the x-direction constraint is applied to the plane stress and the general plane strain rate condition show that the equivalent plastic deformation rate is reduced by about 1 % when the constraint is added to the plane stress (● in Fig. 12). Also, when the constraint is added to the general plane strain rate condition (▲ in Fig. 12), the significant plastic deformation rate is 0.5 %, which is almost no plastic deformation. The x-directional confinement in the AB plane represents the confinement by the surrounding grains, and it can be said to be in a three-dimensional confinement state under general plane strain conditions. In other words, it is considered that the influence of the confinement is in the order of plane confinement, plane strain confinement, and three-dimensional confinement, and the influence on the deformation suppression of the PFZ becomes larger and intergranular fracture is difficult to be occurred.
4. Discussion
4.1. Impact tensile properties
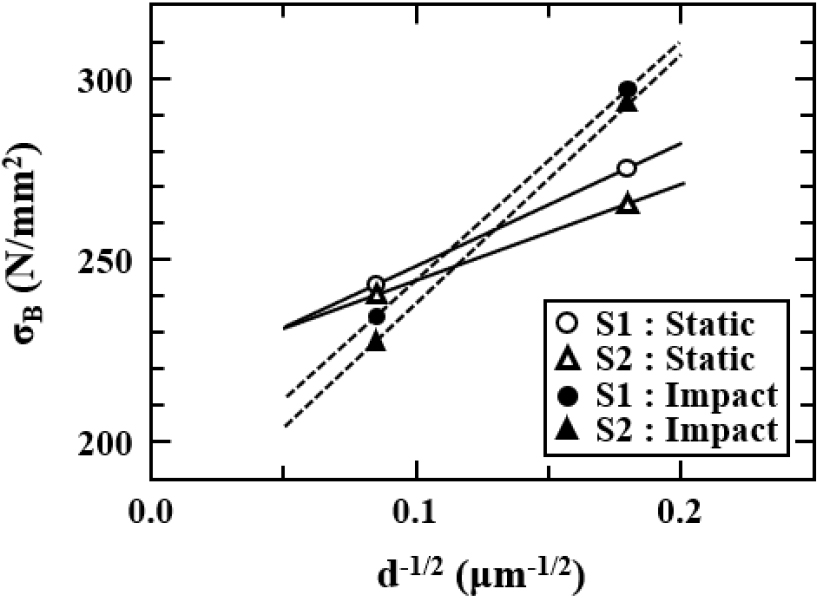
The impact tensile properties measured for plate specimens (S1 and S2) of Alloy A1 and Alloy A2 with coarse and fine grain organization were compared and examined with the static properties. Fig. 13 plots the tensile strength of UA material against the average grain diameter d-1/2 from the Hall-Pitch relationship. S2, which has a larger specimen width W than S1, showed a slight decrease in regardless of static and impact, but the dependence on grain diameter showed the same tendency. Compared to the static strength, of the impact test increased in alloys with fine grains and decreased in alloys with coarse grains. In other words, the strain rate dependence of was confirmed, and the former showed a (+) and the latter a (-) dependency on the increase in strain rate.
The (+) strain-rate dependence of for alloy A2 is consistent with reported results. In addition, the elongation at fracture, 𝛿, was similar to the static test results regardless of alloy and specimen size. In the UA material of Alloy A1 with dense grains, a clear decrease in the value of 𝛿 can be seen for the occurrence of intergranular fracture. Intergranular fracture in these dense grained alloys is typically a intergranular ductile fracture with a ledge or dimple,27,32) and the fracture energy, , can be expressed as follows:33)
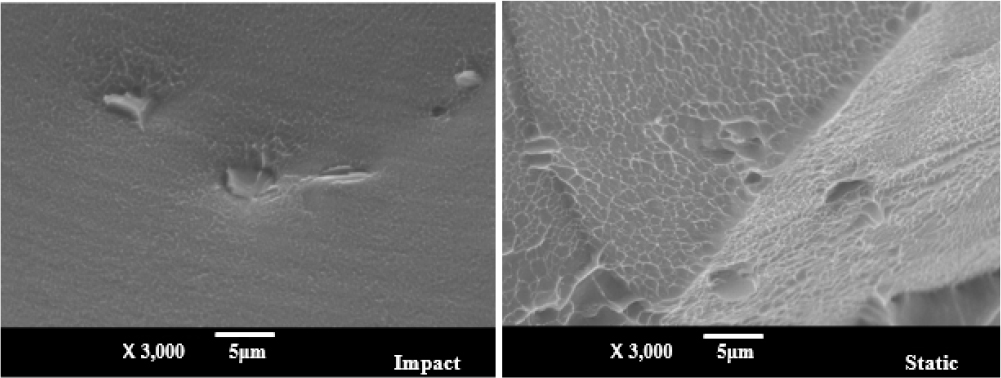
where, : surface energy per unit area, : grain boundary energy, and : work due to plastic deformation. Alloy A1 with coarse grains decreased both and 𝛿 in the impact test compared to alloy A2 with fine grains, i.e., the fracture energy decreased to about 1/2 of the static test. This is explained by the decrease in in Eq. (5), but if the strain rate dependence is due to the thermal activation process of deformation and is not affected by the precipitation organization or grain boundary structure itself, it is in the right term of Eq. (5) that affects the decrease in . Observing the enlarged fracture plane of the static and impact test of PA material of alloy A1 with coarse grains in Fig. 14, it is observed that the depth of the grain boundary dimples in the impact test fracture plane is very shallow compared to the static test. In other words, it is believed that the grain boundary deformation becomes brittle during the impact test and the plastic strain decreases, resulting in a decrease in and .
4.2. Effect of strain rate on intergranular fracture
The effect of strain rate on intergranular fracture showed that the elongation at break tended to decrease with increasing strain rate in specimen S1 of alloy A1, alloy B1 and alloy B2, where intergranular fracture was observed at the fracture surface. This behavior was more pronounced for the higher amount of Si added, especially for alloy B1, where the grain boundary was observed to change to a brittle fracture surface as the strain rate increased. The reason for the change in fracture surface morphology is that when the strain rate becomes high, the voids in the coarse-grained precipitates are deformed along the grain boundary and the depth of the fine dimples decreases, so that the strain in the shear direction is more than the strain in the vertical direction in the deformation of the grain boundary.34)
4.3. Effect of specimen dimensions on intergranular fracture
As for the effect of specimen dimension, it can be considered that the change in the shape of the fracture surface of fine grains leads to a plane strain effect, i.e., a constraining effect in the thickness direction, when the aspect ratio becomes smaller. Therefore, specimen S2 was near the plane strain condition in the FEM analysis, so the deformation localization at the grain boundary was suppressed, and the elongation at fracture was larger than that of specimen S1. However, specimen S1 is considered to be a contradiction because wt/d2 is larger than that of specimen S2 and the restraint by the surrounding grains is also large. This phenomenon is considered to be caused by the fact that the cross-sectional aspect ratio of specimen S1 is in the plane stress state, and t/d, which represents the constraint force by the surrounding grains in the thickness direction, is very small at 7, so the constraint force in the thickness direction was not sufficient. As a result, specimen S1 was in the same condition as the plane stress plus x-direction constraint shown in the FEM analysis results, and it is considered that the localization of PFZ deformation was not suppressed more than that of specimen S2, which is a plane strain rate condition. In addition, the relationship between the elongation at fracture and wt/d2 of alloy B, shown by the dotted line in Fig. 5, does not show a smooth curve, because as wt/d2 decreases, the elongation at failure decreases due to the weakening of the constraint by the surrounding grains, but as the cross-sectional aspect ratio, w/t, decreases, the elongation at fracture increases due to the constraint of the plane strain rate.
5. Conclusion
The impact tensile properties of Si-rich Al-Mg-Si alloys with coarse and fine grains were evaluated using split-Hopkinson bar impact tests on thin plate specimens. The effects of strain rate and specimen dimensions on the intergranular fracture of Al-Mg-Si alloys with excessive Si-addition were also investigated, and the following conclusions were obtained.
(1) The impact test tensile strength of the UA material increased for alloys with fine grains and decreased for alloys with coarse grains compared to the static strength. In other words, the strain rate dependence of was confirmed, and the former was (+) and the latter was (-) when the strain rate increased.
(2) Specimen S2 (aspect ratio W/T = 3, W: width of reduced section, T: thickness) showed a large strain concentration at the bottom of the fillet in both elastic and plastic cases compared to S1 (W/T = 2), resulting in uneven strain distribution at the reduced section and deformation at the shoulder section.
(3) It was found that as the strain rate increases, the elongation at fracture decreases and the fracture surface of intergranular fracture becomes more brittle, and intergranular fracture occurs in the high strain rate region even for materials with small grain size. This tendency became more pronounced as the amount of Si added increased.
