

1. Introduction
2. Experimental Procedure
2.1. The Mathematical model of a PVG
3. Results and Discussion
3.1. Identification of electrical parameters using GA
3.2. Simulation of the PVG
4. Conclusion
1. Introduction
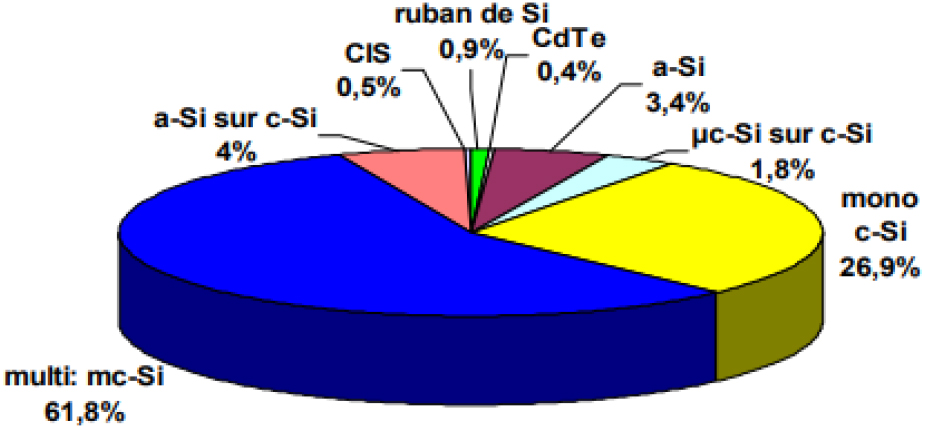
Semiconductors are a well-defined class of materials with specific physical properties. One of these materials is silicon (Si), a chemical element widely present in nature and this based on quartz sand (silicon dioxide). This Si mainly used in the manufacture of solar cells used to capture light and transform it directly into usable energy. The photovoltaic (PV) industry’s remarkable progress is due to the rapid development of optoelectronics, and technological advances in crystalline silicon (c-Si) manufacturing processes, which account for the lion’s share of the global PV module market (nearly 90 %).1,2) Reducing PV module manufacturing costs and increasing conversion efficiencies remain the PV industry’s main challenges. The main stages in the PV module manufacturing process, from Si in its natural SiO2 state to the module, briefly illustrated in Fig. 1. Different technologies used to produce the wafer, so we can distinguish between different types of PV cells.3,4,5)
Genetic algorithms (GAs) are optimization algorithms based on techniques derived from genetics and Darwin’s natural evolution. They are exploration algorithms developed for optimization purposes. Based on the mechanisms of natural selection and genetics, they cause a population to evolve at each generation, reproducing itself through crossover and mutation. We will only concentrate on GAs, which have advanced significantly over the past 20 yr as a result of calculators’ increased power and, more specifically, the emergence of architectures that take advantage of their inherent parallelism. Contrary to classic optimization methods, these algorithms characterized by a great robustness and possess the ability to avoid local minimums to perform a global search. Moreover, these algorithms do not obey the assumptions of which contraindicates classical methods for dealing with real problems.
To implement a GA, you need a scheme to encode the problem’s solutions, an evaluation function, an initialization procedure, a set of operators and a set of parameters that govern the creation of the initial population, the execution of the operators and the stopping of the generation of new populations. Four aspects characterize GAs: the coding of the problem parameters, the search space, and the evaluation function used to select the parent chromosomes, and chance, which plays an important role in the evolution of chromosomes from generation to generation. The right choice of these parameters leads to a better optimization of the GA model. As in our case study, we chose real coding instead of binary or Gray coding, because real representation offers an interesting compromise: it eliminates all conversion operations, but on the other hand, it makes GAs more problem-dependent. Real coding increases the efficiency of a GA and avoids the need for additional decoding operators. Tournament selection increases the chances of low-quality individuals participating in population improvement. The principle is very quick to implement. A tournament consists of a meeting between several individuals taken at random from the population. This technique uses proportional selection on pairs of individuals, and then chooses for these pairs the individual with the best adaptation score. The parameters, which condition the convergence of a GA, are the size of the population of individuals, the maximum number of generations, the probability of crossing and the probability of mutation. The values of such parameters depend on the problem studied. Thus, there are no parameters that are suitable for solving all the problems that can posed by a GA. However, certain values are often used and can be a good starting point for a search for solutions using a GA.
In this work, we used real-encoded GAs to extract the parameters of the single-diode model of a Si-based photovoltaic generator (PVG). We studied the effect of irradiance and temperature on the operation of a PV generator through the (I-V) and (P-V) characteristics obtained by applying the optimization approach with GAs. These were used to determine the values of the solar cell’s saturation current, series, shunt resistance, and other coefficients.
The results indicate that the GA technique is a better conventional parameter extraction strategy in terms of convergence. It provides globally optimal solutions.
2. Experimental Procedure
2.1. The Mathematical model of a PVG
2.1.1. The characteristics of a PVG
The solar cell has non-linear characteristics IV that depend on variant parameters such as temperature and irradiance. This is illustrated in Fig. 2.7)
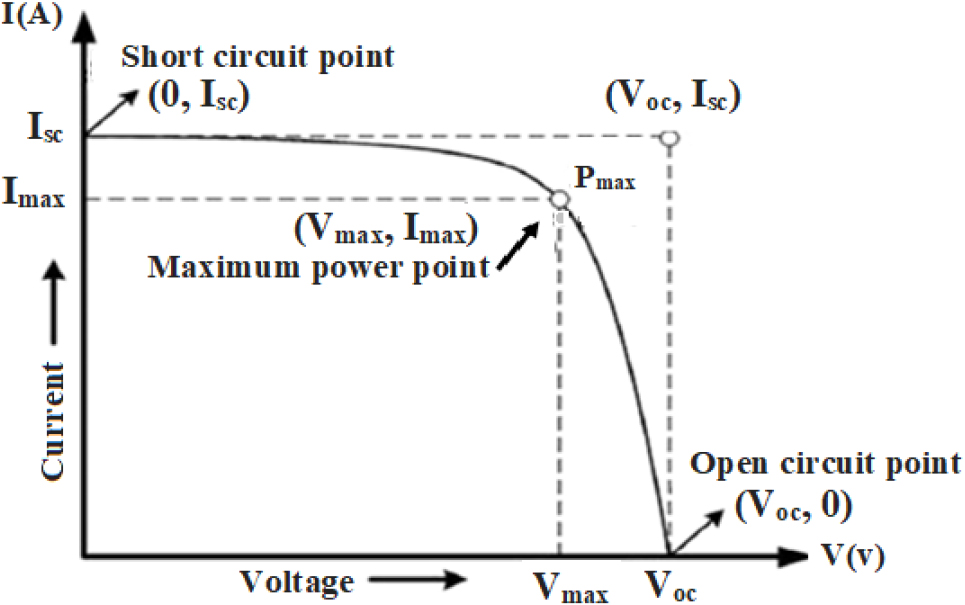
In this characteristic IV there are two important points that we must mention. The short circuit current Isc where the current is at the maximum value and the voltage is zero, the second point is the open circuit voltage Voc where the current is zero and the voltage is at the maximum value.
The experimental data used in our work obtained from the Si PV module. The module consists of 36 solar cells connected in series. The electrical characteristics of the PV panel are given in Table 1.
Table 1.
Electrical characteristics of photovoltaic module (PVM).
| Parameters of PVM | Values |
| Maximum power Pmax (W) | 50 |
| Maximum current Imax (A) | 2.98 |
| Maximum voltage Vmax (V) | 16.75 |
| Open circuit voltage Vco (V) | 21 |
| Short-circuit current Isc (A) | 3.01 |
2.1.2. Modelling the PVG
Its equivalent electrical diagram characterizes the PV cell; see Fig. 3.
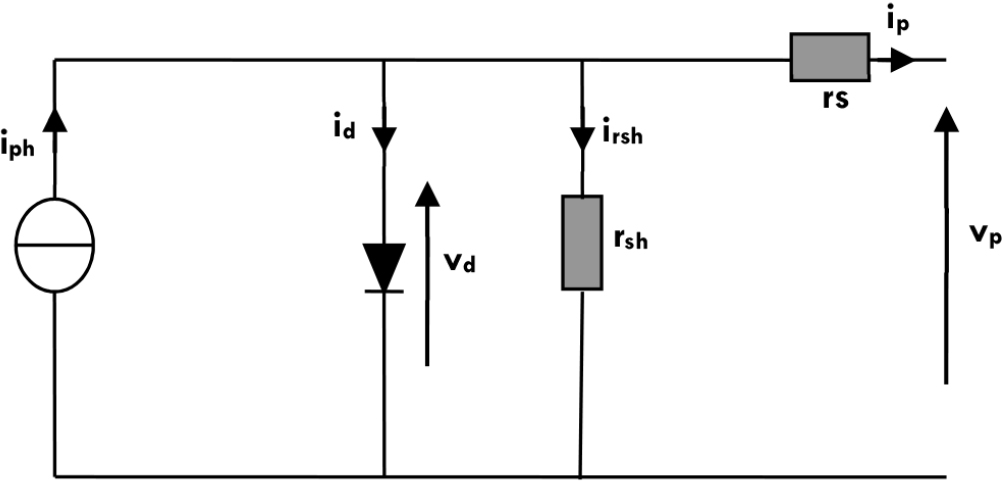
The Shunt Rsh resistance which takes into account the inevitable current leakage between collector grid and return current cells. Series resistance Rs which is essentially due to contact resistance of the collecting grids with the surface of the cells and the resistance of the material making up the cells.
These resistances, Rs and Rsh, are instrumental in accounting for losses attributed to manufacturing imperfections.
We can break down the I(V) characteristic of a PVG into 3 zones Fig. 2:
The first zone comparable to an Isc current generator proportional to the irradiation which can be modeled by (1 / Rsh). The second zone is equivalent to a voltage generator VC0 with internal impedance equivalent to Rs. The third zone where the internal impedance of the generator varies greatly from Rs to Rsh. This is the operating point at which the generator provides maximum power.
By studying the physics of a solar cell, we can obtain the load current Eq. (1):
where,
ip : the current delivered by the solar panel.
iph : photo current, created by solar photons of energy greater than the gap.
id : diode current.
irsh : the current flowing through the shunt resistor.5)
A PVG is a series/parallel combination of ns, np elementary cells, ns being the number of cells in series on a string and np the number of branches in parallel.
This model has four variables, the two input variables are:
Es : sunshine in the plane of the panels (w/m2).
Tj : cell junction temperature (°C).
The two output variables are:
IG : generator photovoltaic current (A).
VG : generator photovoltaic voltage (V).
We then obtain the characteristic Eq. (2) for a PVG deduced from the equivalent electrical diagram:
Photocurrent Iph is a function of solar irradiation and generator temperature and can be expressed as:5)
where,
Eref : reference sunshine (1,000 w/m2).
Tref : reference temperature (25 °C).
P1, P2, P3 : constant parameters.
The cell temperature can be calculated from the ambient and irradiation temperatures as follows:5)
where,
Ta : ambient temperature.
Noct : the nominal cell operating temperature condition given by the manufacturer.
The polarization current of the PN junction, Id, is given by the following expression:
where,
Isat : saturation current.
k : Boltzmann constant (1.38 × 10⁻²³ J/k).
q : elementary charge (1.6 × 10⁻¹⁹ C).
A : ideality factor of the junction.
The saturation current is given as follows:
where,
Eg : gap energy.
P4 : constant parameters.
The shunt current Ish is given by the following expression:
We can therefore write the final Eq. (8) as follows:
Finally, we obtain an implicit function of the form: IG = f (IG, VG, Es, Tj). With 7 parameters P1, P2, P3, P4, A, Rs and Rsh to be determined.
3. Results and Discussion
3.1. Identification of electrical parameters using GA
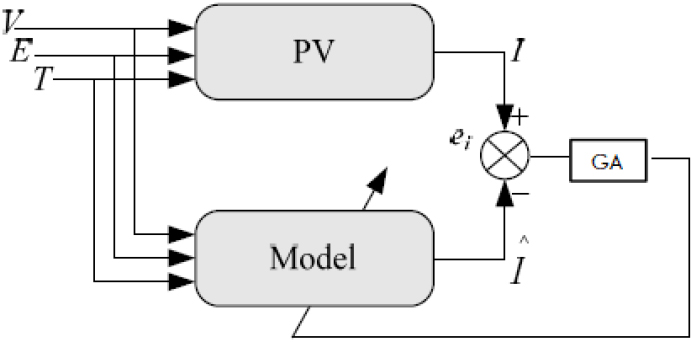
For any PV panel, the mathematical model with a single diode mathematical model is composed of six (6) parameters {P1, P2, P3, P4, Rs and Rsh} and is used to estimate the current (I) of the panel, knowing the voltage (V) at its terminals and the climatic conditions (sunshine and temperature). The role of the GAs is to find model parameters that minimize the prediction error. See Fig. 4 shows the identification structure used in this work. In this figure, the model is placed in parallel with the panel and uses the same input variables (V, E and T). The current I delivered by the panel is compared with the model’s output Î, and the error ei is used by the GA to adjust the model parameters.5,8)
The experimental database of the (I-V) characteristics of this generator is obtained for different illumination values and at ambient temperature. This database will be used to extract the generator’s electrical parameters (P1, P2, P3, P4, Rsh, Rs, A) using real-encoding GAs.
3.1.1. Calculation methodology
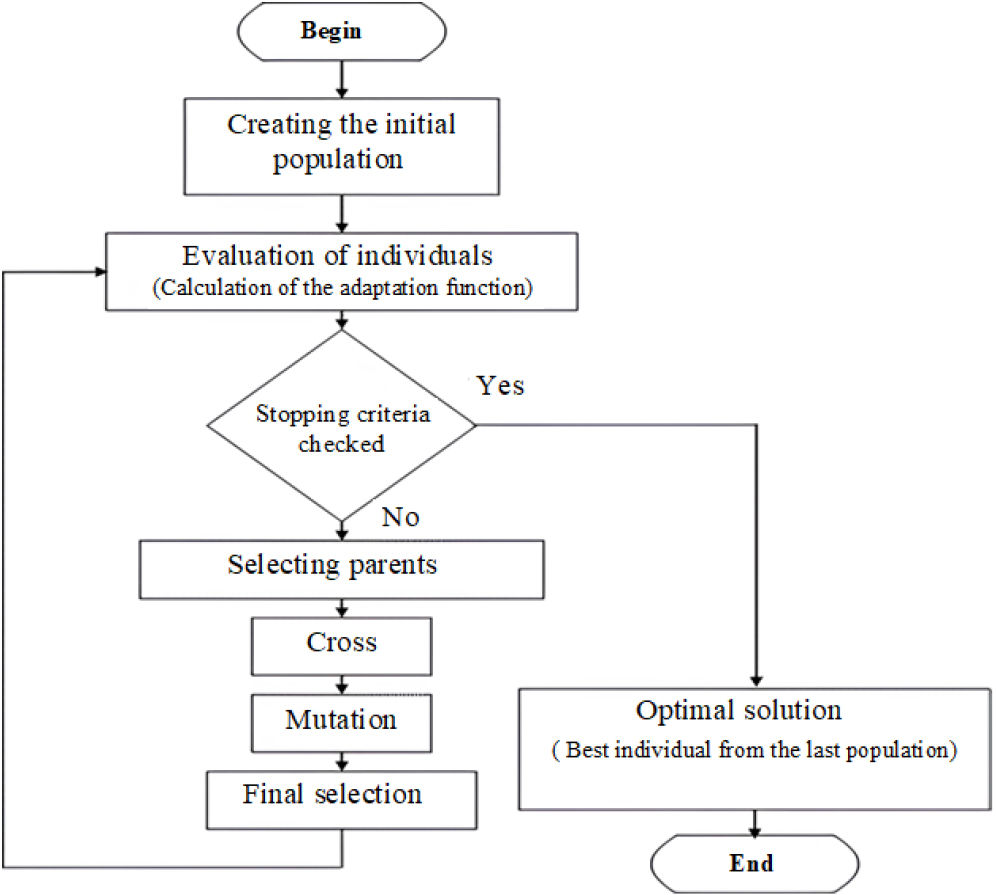
In this application, the applicability of GAs for extracting the parameters of a PV array using the single-diode electrical model of Eq. (8) is presented. Fig. 5 of the evolutionary approach is proposed to find the optimal curves. The optimization process stops the evolutionary calculation when the stopping criterion is satisfied.9,10)

3.1.2. Parameters extraction
Genetic operators are essentially made up of three mechanisms: selection, crossover and mutation. These operators are found in the literature in several variants. The novelty in our work is the choice of these operators, which is based on experimental values and precision. Taking the first operator as an example, we chose selection by tournaments (see Table 2), as this method gives the most satisfactory results. The principle of this method is to draw two individuals with a discount. The one with the best fitness has a probability Pn of between 0.5 and 1. This process is repeated n times to obtain the n P+1 individuals who will serve as parents. The variance of this method is high and increasing or decreasing the value of P reduces or increases the selection pressure respectively.
Table 2.
GA parameters used in this application.
Indeed, the greater the number of crossover points and the higher the crossover probability, the more segments will be exchanged, and therefore the more parameters will be exchanged, and vice-versa. In our case, we’ve chosen a uniform crossover.
The mutation operator therefore modifies the characteristics of a solution in a completely random way. Note that the mutation therefore solves the problem exposed after the crossover.
In this application, the parameters of the one-diode model (7 parameters) grouped together in a vector called the chromosome. Based on the experimental characteristic I(V) of the PVG, it is essential to find the best configuration of parameters to fit the simulated results (implicit expression) to the experimental data. Fig. 6 shows general principle of GAs. The parameters to be adjusted can be defined by considering the minimization of the error associated with the optimization.11)
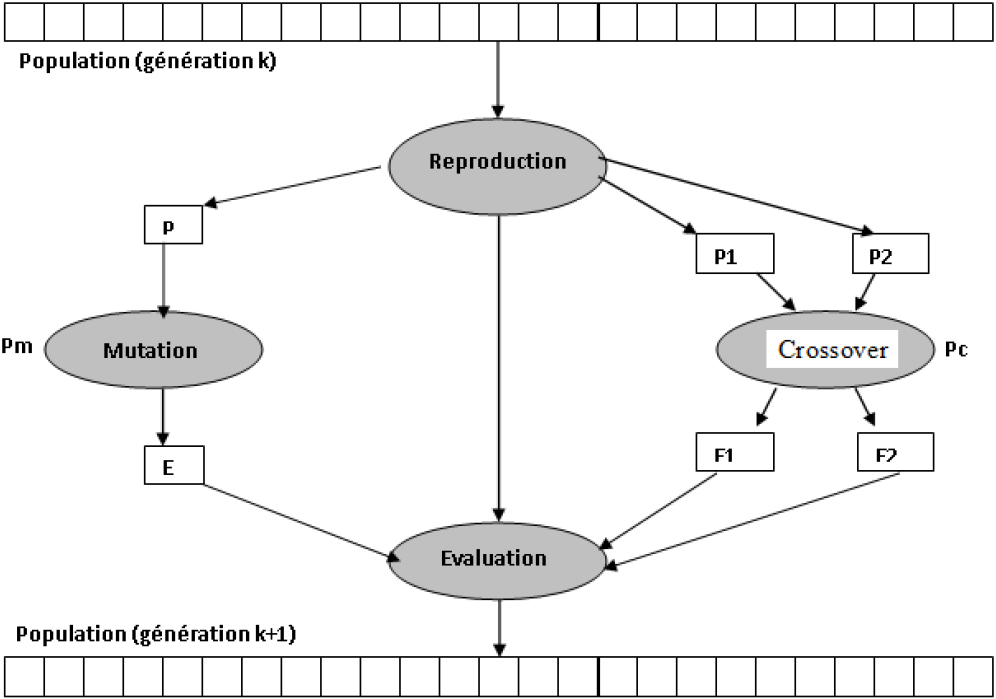
In the simulation of the PVG, the relationship between the input vector (voltage V and chromosome C) and the implicitly adjusted current function (I) is given by the Eq. (9):11,12,13,14)
Fig. 7 illustrates the general structure of the GA.
To calculate the values of these parameters, the fitness function (f) needs to minimize using the GA optimization technique. This fitness function defined by using the Root Mean Square Error (RMSE) method.15,16)
where,
Iexp : the experimental current.
Ical : the current calculated using the AG technique.
The individuals determined by the objective function (fitness) will used to select suitable candidates for reproduction and for the survival of the species. This problem-specific function is often simple to formulate when there are few parameters.
On the other hand, when there are many parameters, as in our case, this function is more difficult to define. In this case, the function becomes a weighted sum of several factors. Adjustment of the coefficients is then necessary, and this is where we see the usefulness of GAs compared with other approaches.
The fitness function used for chromosome evaluation and parameter adjustment. In our case, the fitness function is the cell’s IG current. This requires a set of device simulations for each individual, in order to determine the I(V) characteristic of the corresponding cell.8) The flowchart of our proposed evolutionary approach to finding the optimal parameters suitable to those of the analytics shown in the Fig. 7.
For the extraction of these parameters, we chose an initial population size of 10,000, and we set the stopping criterion for the algorithm to 10,000 generations. The parameters used in this study are summarized in Table 2.
For more details, Table 3 shows the parameter values and the objective function, obtained for a few sample generations.
We note that the results differ from generation to generation. The value of the performance criterion improves rapidly in the first few generations, and reduced from 82.5143 to 32.7316 after just 25 generations. It reaches its optimum value (0.0814) after several generations, since this is the value that always returns until the end of the optimization process.
Table 3.
Parameters values and objective function.
Our result for a Si-based solar panel is as shown in Table 4.
Table 4.
Single diode model parameters for a Si-based solar panel.
| Parameters of model | Values |
| P1 | 0.0035 |
| P2 | 0.00047 |
| P3 | 0.00013 |
| P4 | 86.4544 |
| Rsh | 105.76 |
| Rs | 0.6102 |
| A | 1 |
We used the parameters of the one-diode model as indicated in Table 4, and then we implemented it in the Simulink block for the PV module. The next step is dedicated to studying the influence of temperature and sunlight intensity on the (I-V) and (P-V) characteristics.17,18)
3.2. Simulation of the PVG
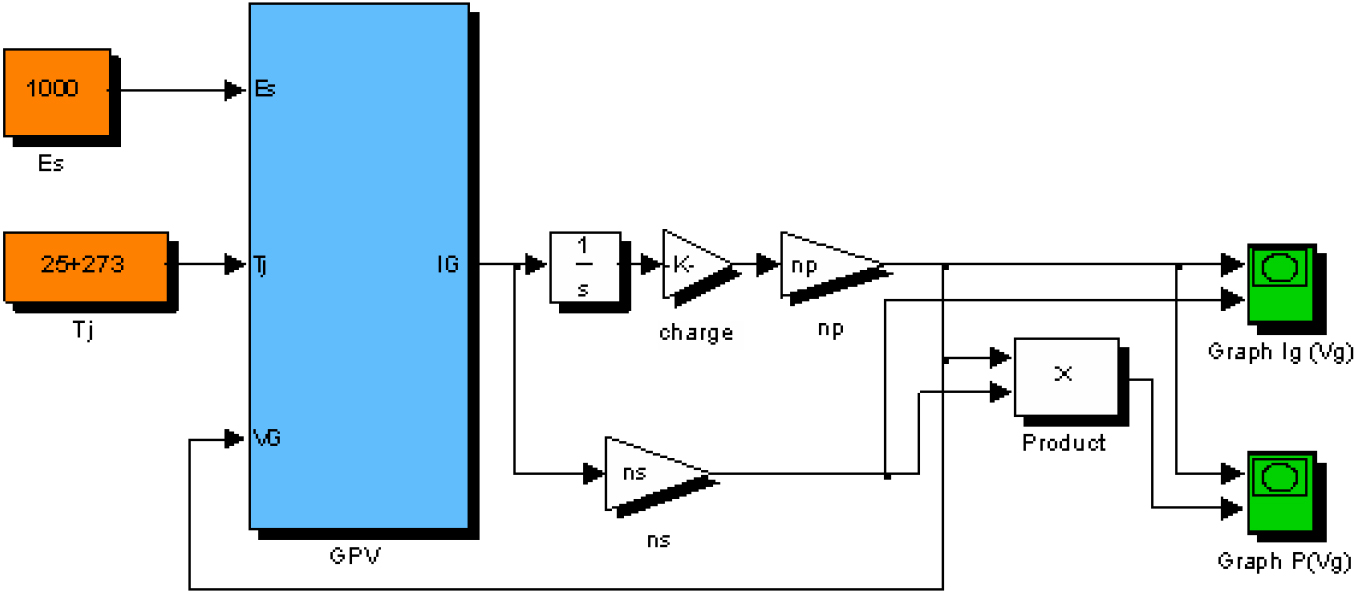
The solar cell model used in our study is depicted in Fig. 8. The equivalent electrical circuit of the PVG is simplified into a block diagram.
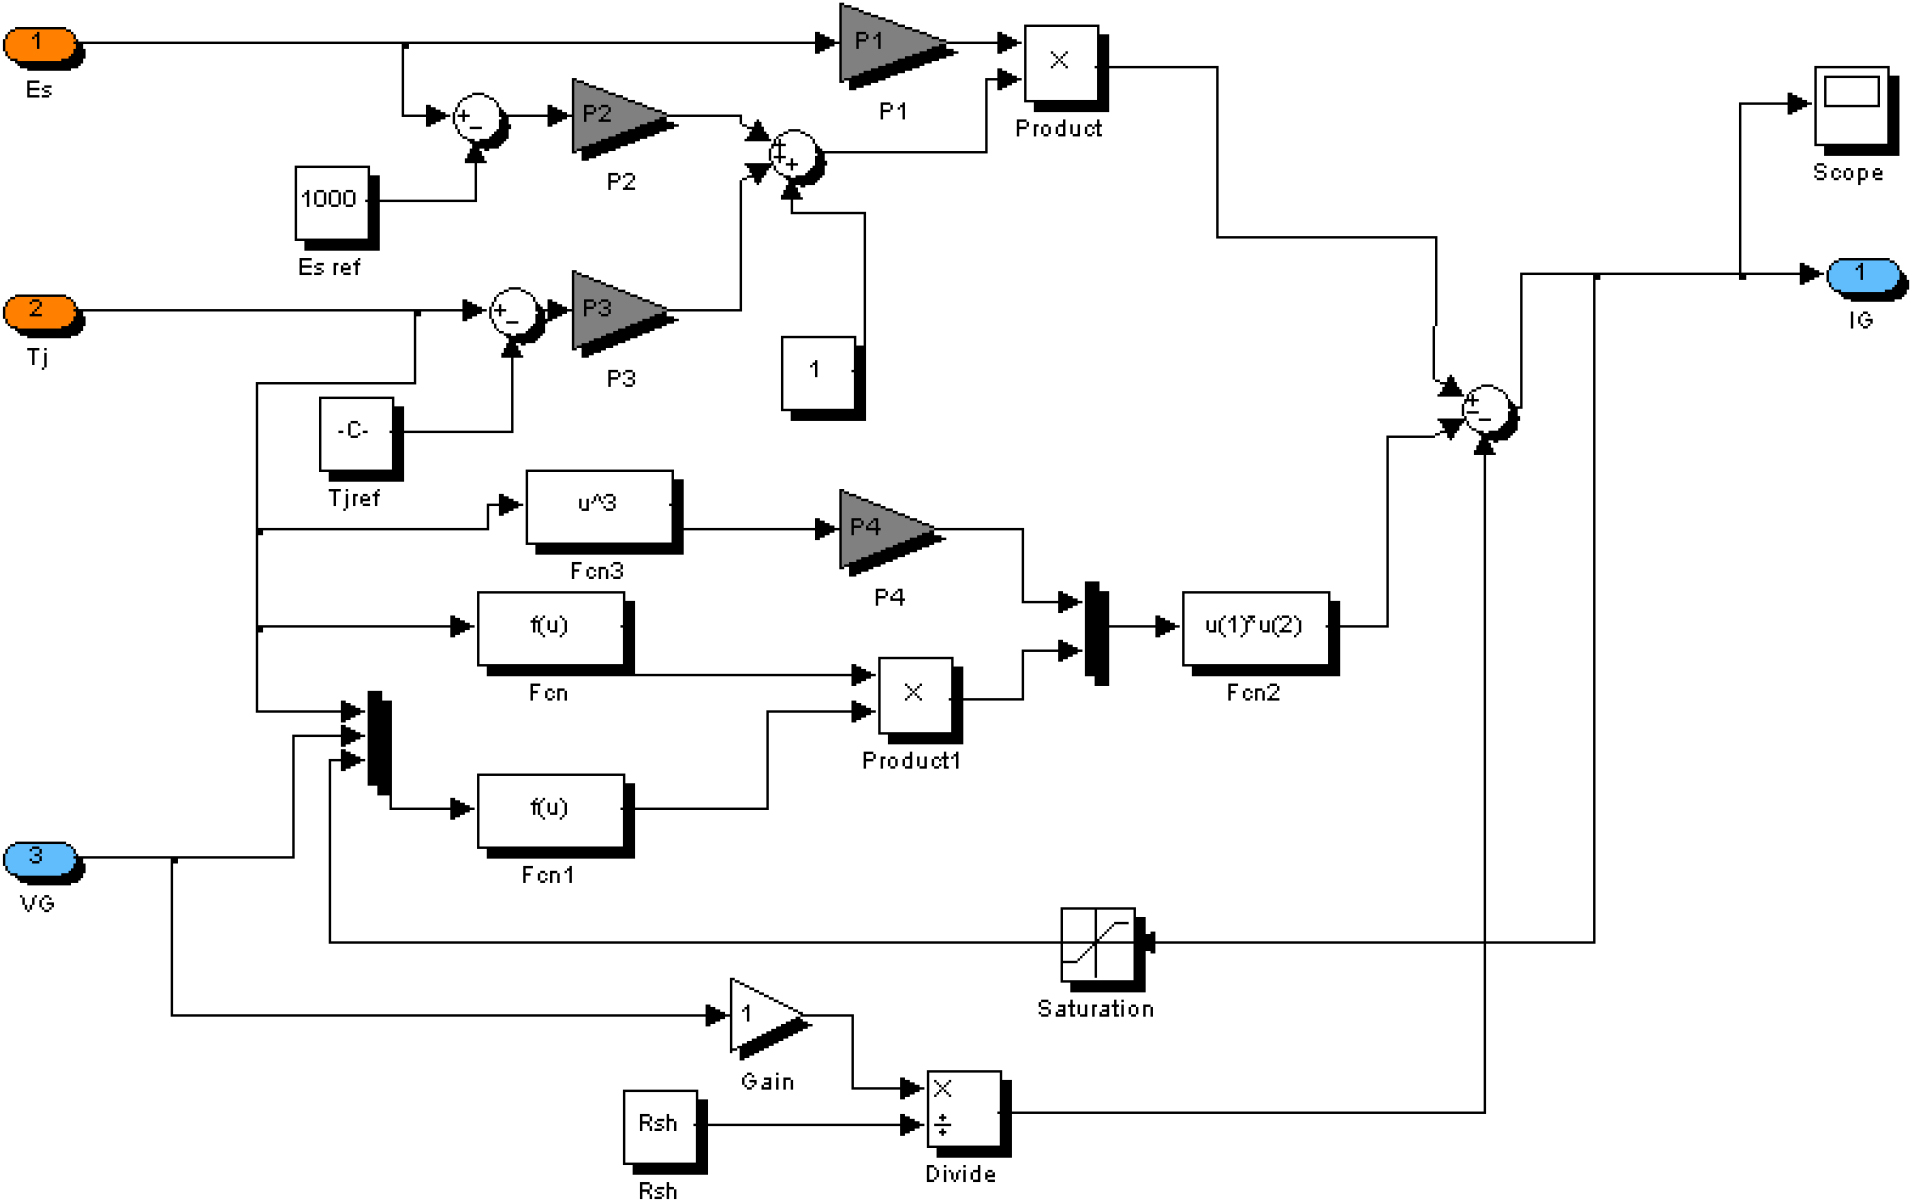
The interpretation of the model equations shown inside the (GPV) block in Fig. 9.
To demonstrate the influence of the different parameters of the GA, we applied it to the same problem, changing the value of one of the parameters each time. In particular, we studied the influence of population size, temperature variation and sunshine variation on GA efficiency.
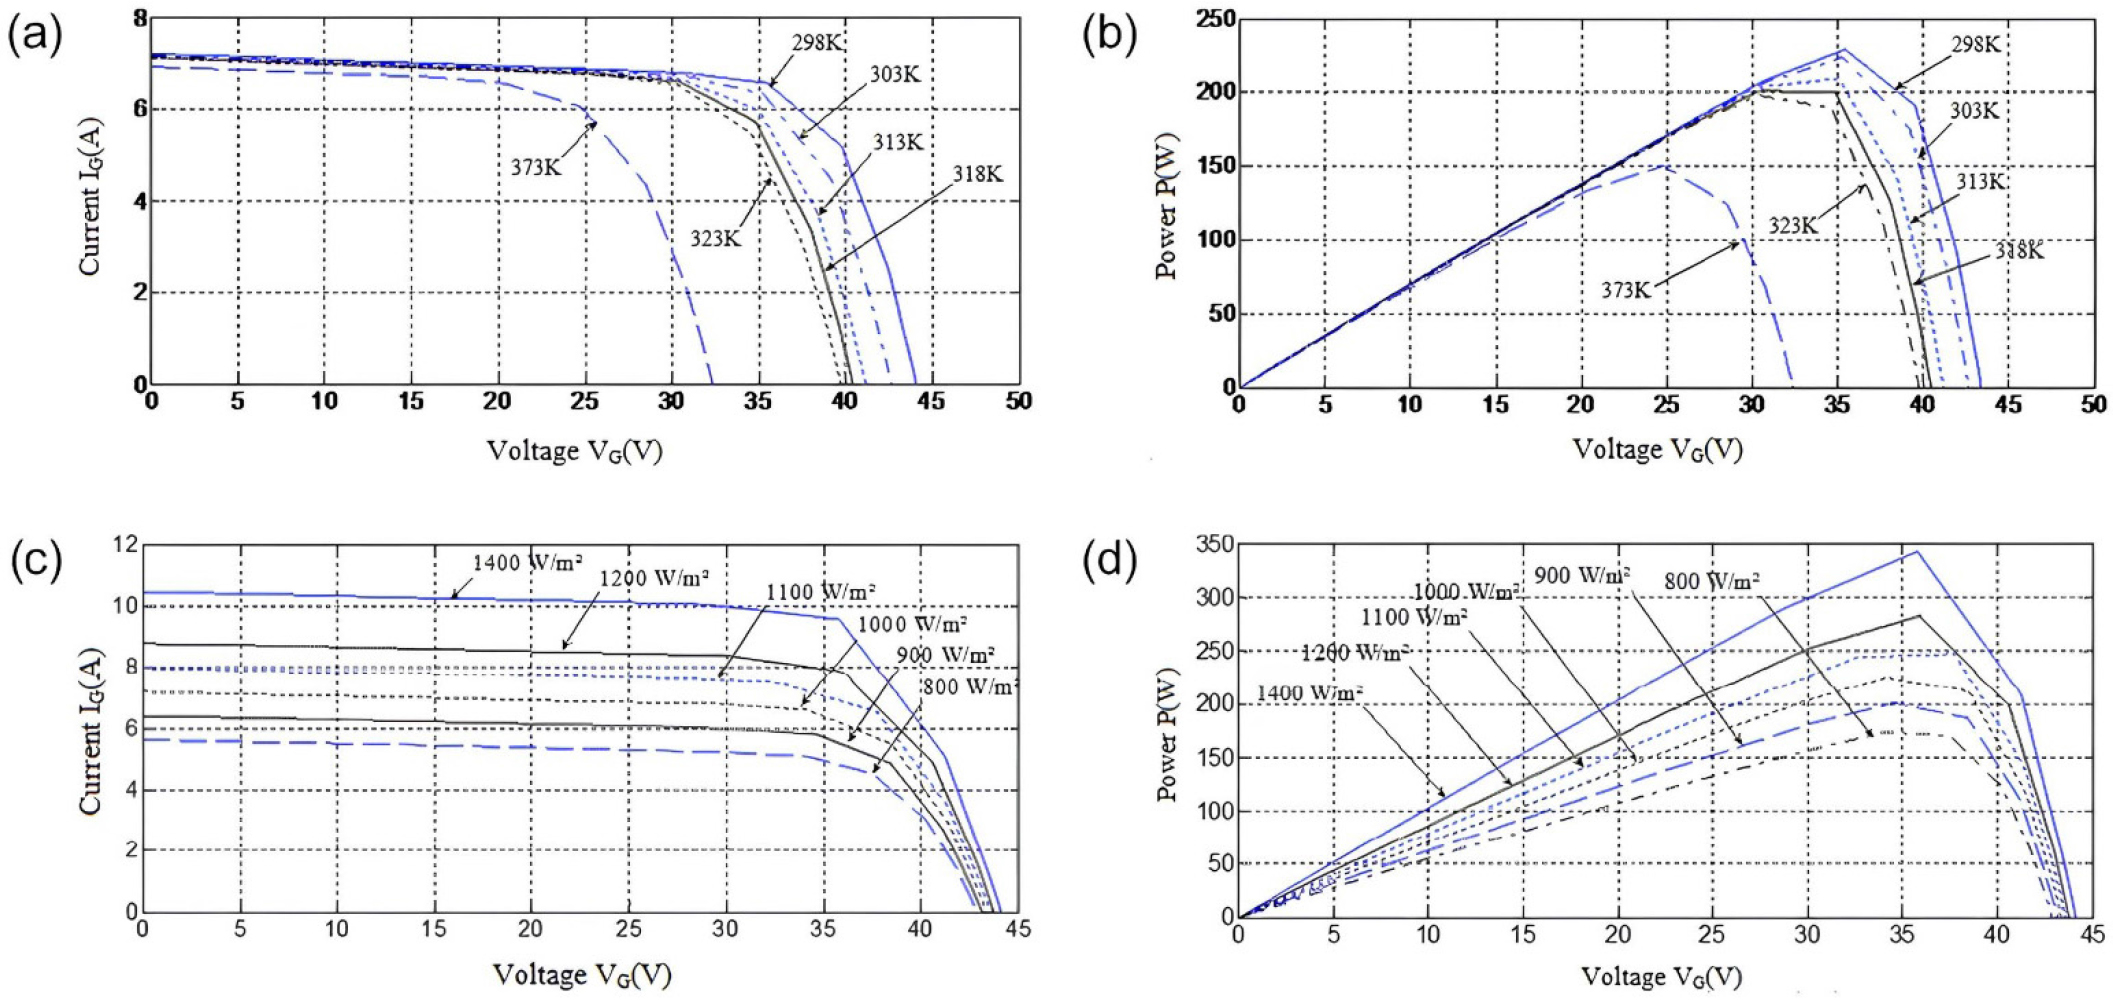
3.2.1. Influence of temperature and sunshine
Fig. 10(a) shows that the voltage Vco of the PVG decreases with an increase in temperature, while the current Icc increases slightly. However, in Fig. 10(b), the maximum power PMPP decreases more rapidly with an increase in temperature.
In Fig. 10(c), the current Icc increases significantly with an increase in sunshine. For the Si-based PVG, the optimal power PMPP increases more rapidly with an increase in sunshine [see Fig. 10(d)].
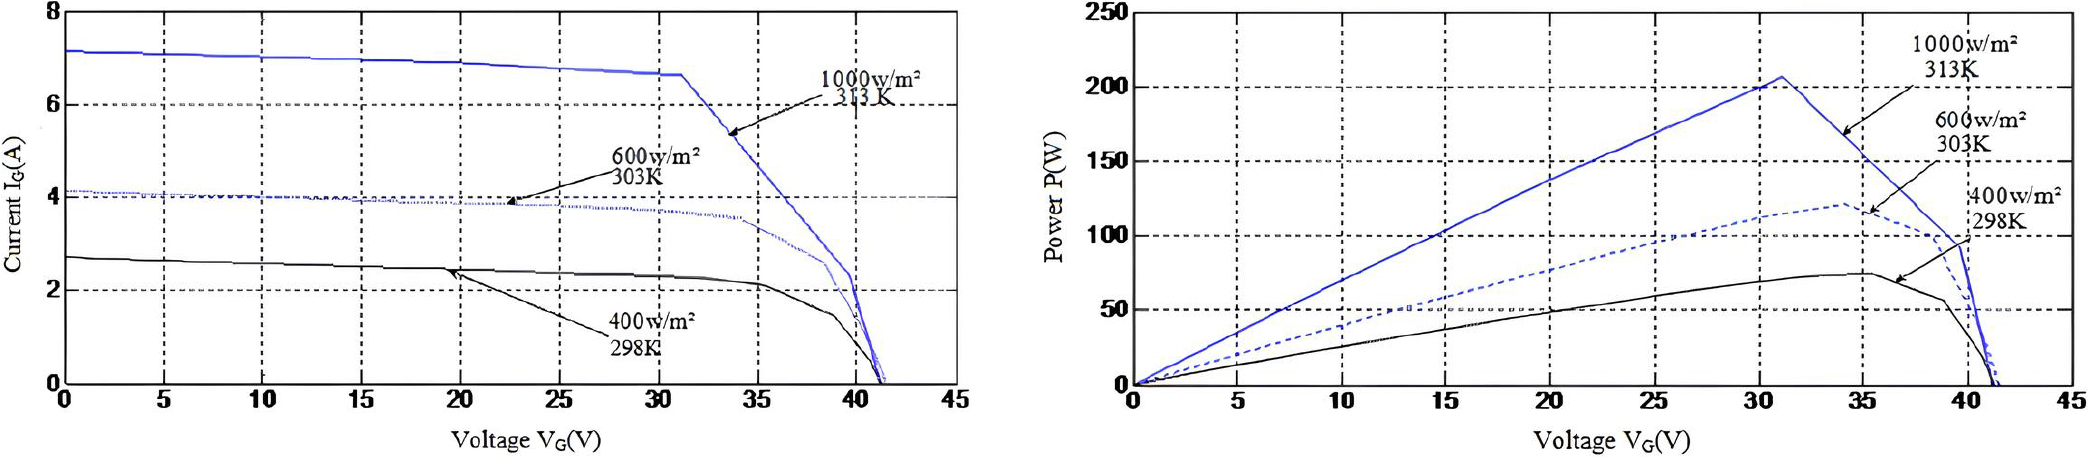
3.2.2. Influence of simultaneous variation in sunshine and temperature
Fig. 11 illustrates the simultaneous variation of sunshine and temperature on the current, voltage, and power. We observe a significant increase in both the current and voltage, while the voltage varies only slightly in the Si-based solar generator. The optimal power also shows the same behavior, increasing with an increase in sunshine and a decrease in temperature.
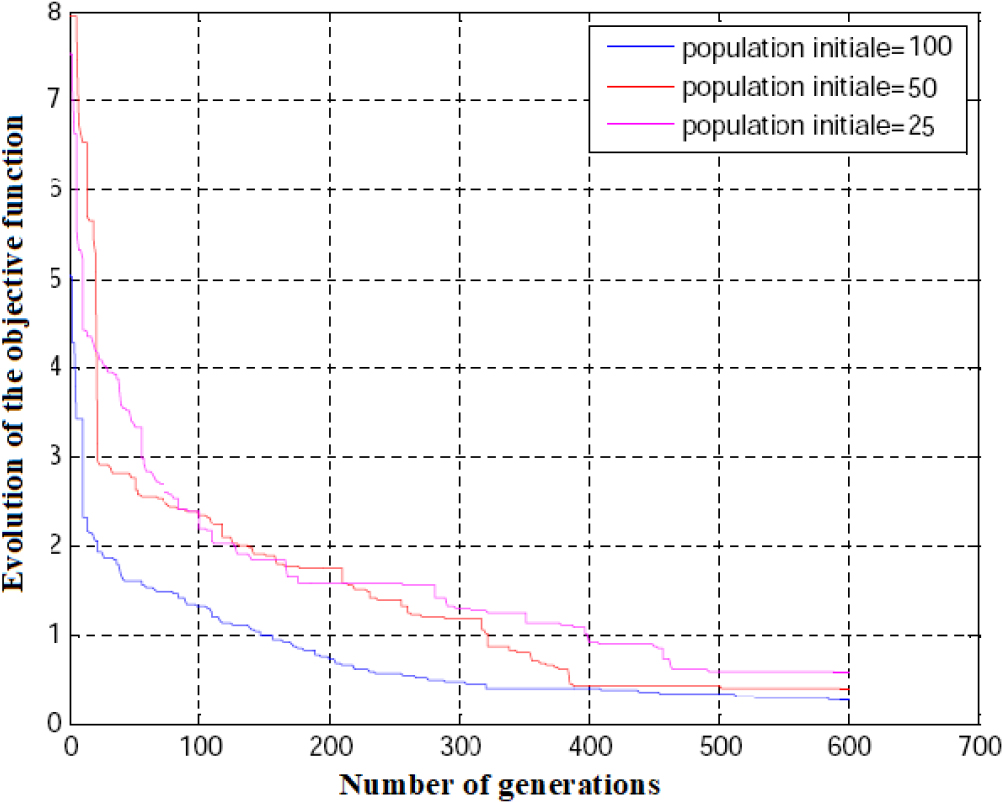
3.2.3. Influence of population size
Changes in population size have a considerable influence on the evolution of the best solution through the generations. See Fig. 12, which shows the evolution of the best chromosome in each generation: the larger the population, the faster the best solution in each generation converges towards the global optimum. This is quite logical, since it should be remembered that the GA starts with an initial population made up of individuals taken at random from the search space, and the greater the number of individuals, the greater the chances of being close to the optimal solution.
4. Conclusion
The analysis of the different results has allowed us to observe that the variation in temperature mainly affects the voltage of our designed model, and the optimal power decreases with an increase in temperature. On the other hand, the variation in sunlight intensity mainly influences the current of the PVG.
The GA’s performance in terms of convergence speed and location of the optimal solution depends heavily on the right choice of a set of parameters such as population size and crossover and mutation rates.
In conclusion, we hope that our work contributes to the study and mastery of renewable energy, specifically in the field of photovoltaic technology. It is an environmentally friendly, cost-effective, and highly reliable technology that requires no fuel or transportation. Unfortunately, it remains a pioneering technology in the world, but we believe that continued research and development in this area will help promote its wider adoption and further enhance its benefits for a sustainable future.
