

1. Introduction
Effluent from the textile industry contains excessive amounts of dyes that cannot be removed by conventional biological treatment methods, and their discharge can cause long-term environmental problems.1) As reported in many papers, photocatalysis is a viable option for the complete degradation of dye molecules into products that pose no threat to the environment.2,3) Bi2MoO6 has attracted extensive attention due to its excellent photocatalytic performance in visible light.4-7) A major limitation to achieving higher photocatalytic efficiency is the rapid recombination of photogenerated carriers.The kinetics of the complex reaction is faster than that of the surface REDOX reaction, which greatly reduces the quantum efficiency of photocatalysis.
Graphene is a two-dimensional carbon material which has a strong and flexible structure with high carrier mobility. Graphene has high mechanical strength, huge specific surface area, excellent adsorption and excellent electrical and thermal conductivity.8) There are many studies on the preparation and properties of graphene-based hybrid materials,9,10) and they found the hybrid photocatalyst shows enhanced photocatalytic activity for organic degradation. In Zhou’s research11) enhancement of visible light catalytic activity was related to the dosage of graphene, and the optimal dosage was about 1.0 wt%. Zou12) reported heterostructured graphene-Bi2MoO6/Bi3.64Mo0.36O6.55 composites with high photocatalytic activity. Wang reported a graphene- Bi2MoO6 hybrid photocatalysts synthesized by simple one-step process, in which the reduction of graphene oxide (GO, 2.5 %) and the growth of Bi2MoO6 crystals occurred simultaneously.13)
With a range of synthetic procedures and process methods having found, ultrasonic catalytic degradation is a new wastewater treatment technology.14) In the process of sonoluminescence of aqueous solution, cavitation phenomenon and “hot spot” phenomenon occur, leading to dissociation of water molecules. During ultrasonic treatment, hydroxyl radicals are solidified and have high oxidation activity, which can degrade toxic dyes and industrial dyes. One application of ultrasound is the degradation of polymers.15) On the other hand, ultrasonic technology as an advanced oxidation process to treat pollutants in water has been widely concerned. Comparing with some traditional methods, after introduction of ultrasound some complex reactions can be performed with inexpensive equipment and usually with fewer steps.16) Al-musawi evaluated the acousto-photocatalytic degradation of AO7 dye using titanium dioxide nanoparticles/graphene oxide (TiO2/GO) nanocomposites and sono-photocatalysis degradation of AO7 dye was 100 %.17) Khairy fabricated a series of ZnO nanospheres-carbon nanotubes and reduced graphene oxides (Z/GO) nanocomposites at different weight % ratios of both. The synergistic percentage induced by acousto-optic coupling irradiation is 30, which proves the degradation effect of the method and catalyst in the degradation of 4-NP.18) Khataee synthesized a NiFe- LDH/rGO nanocomposite was in a hydrothermal method. Under the condition of pH 8, 150 W, 1.0 g/L catalyst, 20 mg/L MOX, the best sonophotocatalytic efficiency of 90.40 % was achieved within 60 min.19) Mohamed prepared ZnO/CNT and ZnO/GO nanohybrids via ultrasonication/ hydrothermal approach. ZnO(70 wt%)/CNT shows significant enhancement for sonophotocatalytic activity of MB degradation.20) To the best of our knowledge, few reports were studied about the sono-photocatalysis of graphene- Bi2MoO6 composites under photolysis combined with sonolysis although some related photolysis researchs were studied as mentioned above.
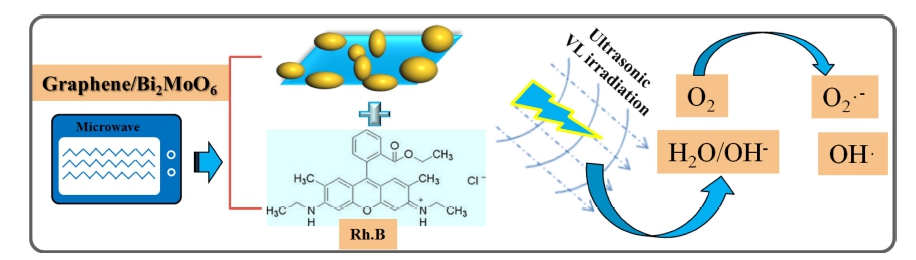
In the present work, we have investigated the application of ultrasound combination with photocatalysis operated using 10W LED irradiation. Herein, this is the first report for the synthesis of graphene nanosheet coated with nanoscale Bi2MoO6 obtained directly via a facile microwave assisted synthesis method in a domestic microwave oven without using a surfactant to form a novel visiblelight responded sono-photocatalyst for decolorating Rh.B.
2. Experimental
2.1. Materials
Bi(NO3)3·5H2O, (NH4)6Mo7O24·4H2O, Rhodamine B (Rh.B), anhydrous alcohol (EtOH) were purchased from Aladdin Chemical Co. Ltd., China. Titanium oxide nanopowder (P25, Evonik, ex-Degussa) with was purchased from Sigma-Aldrich Chemistry.
2.2. Synthesis of graphene oxide
Graphene oxide (GO) was prepared from graphite according to the Hummers-Offeman method.21) In brief, 10 g of natural graphite powder were mixed with conc. H2SO4 (230 mL) at 0 °C with vigorous magnetic stirring. In the next step 30 g of KMnO4 was slowly added to the flask and the temperature was kept below 15 °C. The resulting mixture was stirred at 35 °C until it browned, then diluted to 150 mL with de-ionized water and stirred to keep it below 90 °C. Add water to the container and keep it sealed and stirred at 100 °C for 30 min followed by 20% hydrogen peroxide drop by drop for five minutes. The mixture was then washed several times with water, acetone and 10 % HCl solution to eliminate residual metal ions and then heated in a drying oven at 90 °C for 12 h. 200 mg of graphite oxide was added to deionized water (200 mL) under stirring for 30 minutes follow by ultrasonicated for 2 h. The resulting solution was filtered and washed several times with hot water and kept in an oven for 6 h to obtain GO powder.
2.3. Synthesis of graphene-Bi2MoO6 nanocomposite
The graphene-Bi2MoO6 hybrid photocatalysts were prepared by a one-pot microwave assisted hydrothermal method in a domestic microwave oven as follows: GO (25 mg, 3.0 wt%) and Bi(NO3)3·5H2O (2.6 mol) were dispersed in 30 mL ethylene glycol, and then appropriate amount of (NH4)6Mo7O24·4H2O (2 mmol) was then added to the suspension under vigorous stirring, After mixing and stirring for 50 min, it was transfered to a 100 mL reaction container which placed in a conventional microwave oven (Samsung, RE-406B 700 W). The solution is then heated at 700 W for 5 sec on and 5 sec off for 300 seconds, washed several times with hot water and transferred into a dry oven for 6 hours to achieve graphene- Bi2MoO6 nanocomposite. For synthesis of pure Bi2MoO6, the similar method was used without addition of GO.
2.4. Characterization
To determine the crystal phase and components of the as-prepared samples, XRD characterization was carried out at room temperature using XRD (X'Pert3, PANalytical) with Cu Kα radiation (λ=1.54056 Å) in the range of 2θ = 10-80° at a scan speed of 1.2° m-1. The morphology and microstructure of the compounds were characterized by Scanning Electron Microscopy (SEM, Nova 450) with an energy dispersive analysis system of X-ray analysis (EDX). Transmission electron microscopy (JEM-2010, Japan) was used to examine the size and distribution of graphene-Bi2MoO6. The decomposition kinetics for the sono-photocatalytic activity was measured by using a spectrometer (UV-2450, SHIMADZU).
2.5. Photoelectrochemical measurements
Photoelectrochemical (PEC) tests were carried out in a conventional three-electrode system using a potentiostat (CHI 660E, China). To prepare the working electrode, 4 mg of prepared samples and 30 mL of Nafion solution were put into 1 mL of water-ethanol solution followed by sonicating for 2 h. Then 5 mL of this mixture was transferred onto the GCE electrode, and was thorough dried under an infrared light. The photocurrent was collected and measured under the irradiation of Xe Lamp (500 W, NBET Company) by electron shuttle on an inert platinum electrode in 0.1 mol/L Na2SO4 solution.
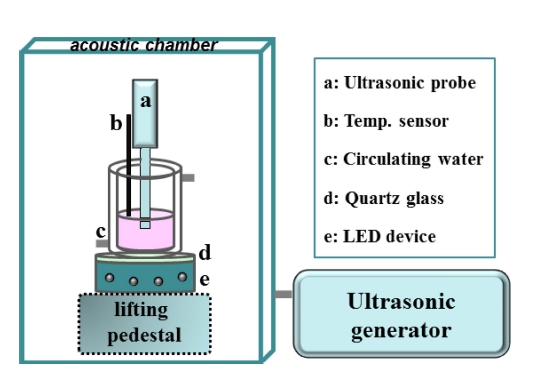
2.6. Visible light sono-photocatalytic properties
Controllable Serial-Ultrasonic apparatus (Ultrasonic Processor, UH600, China) was adopted to irradiate the Rhodamine B solution, while it was operation at ultrasonic frequency of 20 kHz and output power of 120 W through manual adjusting. A visible light illuminate from a 10 W LED lamp (λ = 400-840 nm, brightness 1,400-1,500 lm, Pauray America) was installed at the bottom of the reactor as shown in Schematic 1. The intensity of the light source was controlled as 100 mW/cm2 and detected by optical power meter (FZ400, NBeT Company). The initial concentration of the Rh.B was set at 15 mg/L in all experiments. 50 mg of the sonophotocatalysts was added in the reactor and kept vigorous stirring in the dark for 30 min to achieve the equilibrium of dye adsorption/desorption. Controlling the temperature around room temperature, the reactor was treated by water bath. Ultrasonic irradiation of the reactor was done for each 10 min, 1 mL of the dye is then extracted periodically from the reactor and the dispersed powder is removed through a centrifuge before analyzed by UV-vis spectrophotometer (UV-2450, SHIMADZU). At the end of each cycle, the catalyst was collected by centrifugation and washed three times with deionized water and ethanol. The collected catalysts were dried for 6 h at 80 °C for the next sonophotocatalytic cycle.
3. Results and Discussion
3.1. Characterization
Fig. 1 shows the XRD peak patterns of control samples and graphene-Bi2MoO6 composites. It is obvious that the characteristic diffraction peak of GO locates at 10.7°, which corresponds to a d-spacing of approximately 7.984 Å,22) while typical (002) and (100) peaks of graphene [Fig. 1(b)] were observed at 2θ of ~26° and ~43°.23) As shown in Fig. 1(c) and (d), the main characteristic peaks (131), (002), (060), (331), (262) and (282) plane reflections of koechlinite Bi2MoO6 (JCPDS 84-0787), which was agreed with Wang’s report.13) It illustrates that the samples are all with pure phase structures because no other peaks are found. Moreover, no typical diffraction peaks belonged to GO or graphite can be found in these curves, indicates that the GO has been reduced to graphene during the hydrothermal reaction, which is in agreement with early reports.24-26)
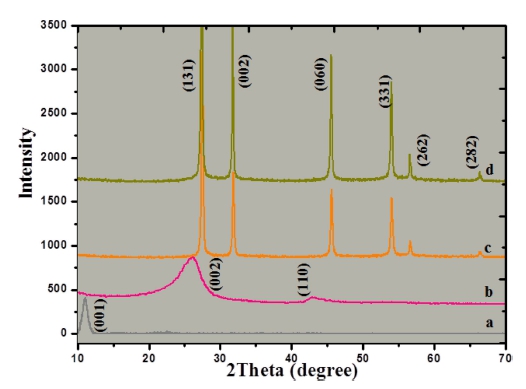
Fig. 1
XRD patterns of as-prepared samples: (a) GO, (b) graphene, (c) Bi2MoO6 and (d) graphene-Bi2MoO6.
Fig. 2 shows the characterized results of the microsurface structures and morphology of graphene, Bi2MoO6 and graphene-Bi2MoO6 nanocomposites. The morphology of GO is lamellar texture, reflecting its lamellar structure .It can be clearly seen in Fig. 2(a, b) that the layer spacing of GO is large and the layer edge is thin. Simultaneously, it is worth noting that when we used sonochemical method to synthesize control sample Bi2MoO6, it is clear that the prepared nanoscale pure Bi2MoO6 observed in Fig. 2(c, d) show us its morphology with a little tendency to agglomerate. Compared (e, f) with (c, d), it is suggested that the graphene introduction contributed the uniform dispersion of particles on graphene nanosheet. After microwave-assisted treatment, the morphology of graphene flakes remained unchanged, and the surface was covered with Bi2MoO6 nanoparticles. Graphene sheets act as bridges for Bi2MoO6 particles and may be beneficial in providing pathways for light-generated electrons, thereby improving catalytic performance.11)
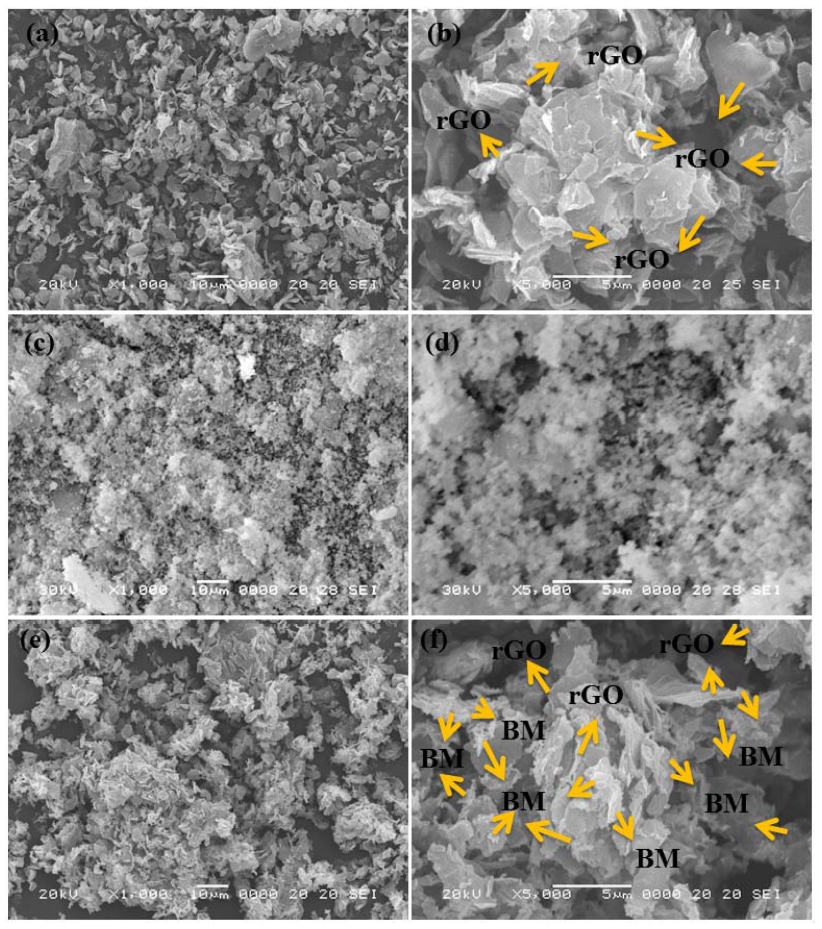
Fig. 2
SEM micrographs of as-prepared samples: (a,b) graphene, (c,d) Bi2MoO6 and (e,f) graphene-Bi2MoO6.
To obtain the microscopic structure information we have carried out the transmission electron microscopy with high resolution as shown in Fig. 3(a-c). It can be seen that the two-dimensional structure of graphene sheet is preserved after microwave treatment, which is consistent with SEM results. In Fig. 3(a), high resolution TEM image from different zones of the graphene- Bi2MoO6 nanocomposite reveal that graphene sheet is well decorated with Bi2MoO6 nanoparticles. Nanoscale Bi2MoO6 are well dispersed On the edges and on top of the graphene nanosheet with an average size of around 150 nm can be clearly seen in Fig. 3(b and c). From Fig. 3(b), it is clear to see that the Bi2MoO6 particles of hundreds nanometers are randomly dispersed on the edges of the 2D graphene sheets. While some little aggregated Bi2MoO6 particles was growing tighter on the surface of 2D graphene sheets. From the TEM images we get into a close insight that less agglomeration of Bi2MoO6 which can be ascribed that microwave synthesis techniques own several advantages over other synthesis method and will be beneficial for nanomaterials.27) Hereby, the microwave synthesis technique provides a very short reaction time and high purity method which is suitable for the preparation of Bi2MoO6 nanoparticles due to it can be obtain smaller particle size and inhibited particle agglomeration. Fig. 3(d) and (e), EDS spectra and quantitative result of BMG was carried out to investigate their component, which determine the Bi, Mo, C and O levels as major elements.
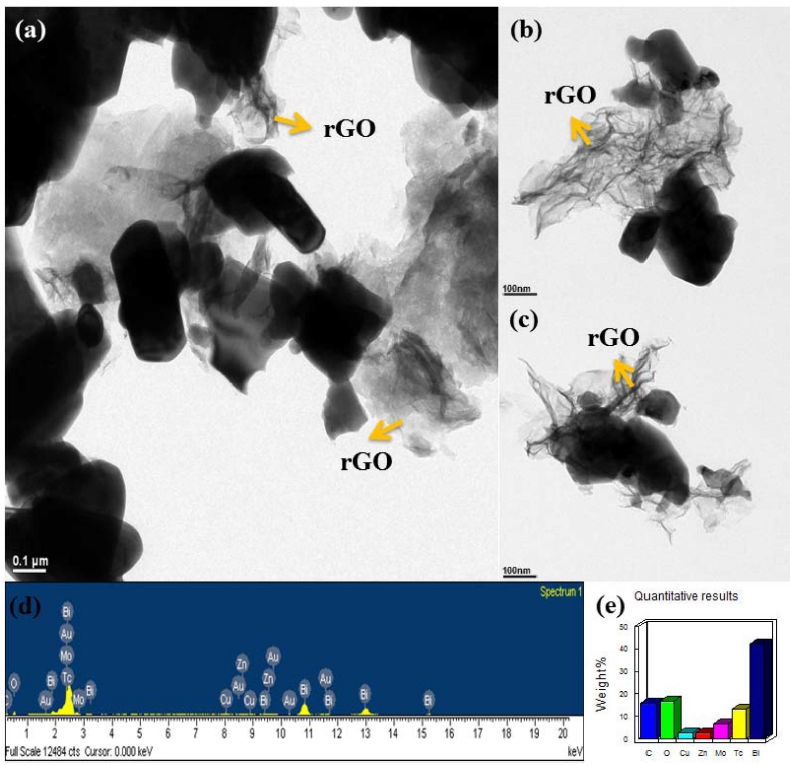
Fig. 3
(a, b, c) TEM micrographs from different area of BMG and (d, e) EDX spectrum and elemental microanalysis of as-prepared graphene-Bi2MoO6.
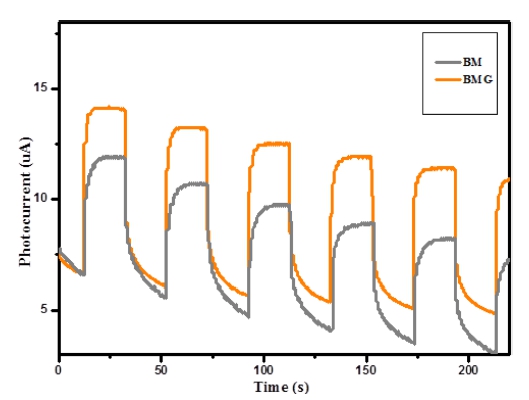
As shown in Fig. 4, the photoresponses for both Bi2MoO6 and graphene-Bi2MoO6 were reproducible during the repeated on/off cycles under visible light irradiation, suggesting efficient visible light harvesting. The slight decreasd photocurrent was detected which can be attributed to the less amount of graphene used in the nanocomposite and 5 mL of this mixture deposition on GCE electrodes as mentioned above. In spite of this, the photocurrent of the graphene-Bi2MoO6 electrode was about two times higher than that of the Bi2MoO6 electrode, indicating a much more enhanced separation efficiency of photoinduced electrons and holes between graphene and Bi2MoO6.
3.2. Sonophotocatalytic activitys
In order to evaluate the photocatalytic, sonocatalytic, and sonophotolysis activity for the degradation of Rh.B, the typical photocatalytic material P25 was used as the main control object. As shown in Fig. 5 depicts the obvious degradation efficiencies of Rh.B follow the order: sonophotodegradation > sonodegradation > photodegradation, which is similar with Sun’s report.28) and the Rh.B sonophotodegradation (under both ultrasound and visible light irradiation) efficiency of P25 is 21 %. Based on this pre-study result, sonophotocatalysis was selected as the main object research contents in this work. There are two steps during the decontamination process, one is adsorption, and another one is degradation. Fig. 6(a) shows the relative yields of the degradation produce formed at different irradiation time conditions are shown for the products. The dye concentration then continued to decline at a relatively gentle slope due to ultrasonic irradiation. The concentration of Rh.B is 15 mg/L, the absorbance of Rh.B decreases with the extension of ultrasonic irradiation time. Obviously, the sonophotocatalytic performance of BMG samples is much better than that of BM and pure P25, which is due to the improved light response and electron-hole separation ability. As shown in Fig. 6(b), the degradation efficiencies of Rhodamine B are 21 %, 30 %, and 72 % for sonophotocatalysis, respectively. Sonocatalysis is believed to be based on three ideas, namely sonoluminescence, “hot spot” and oxygen atom escape.28) For sonophotodegradation, sonocatalysis and photocatalysis plays a synergistic role in the degradation process, mainly in the following aspects: I) activating the photocatalytic surface, II) improving the mass transfer rate between the catalyst surface and the liquid phase, and iii) destroying the aggregate.29)
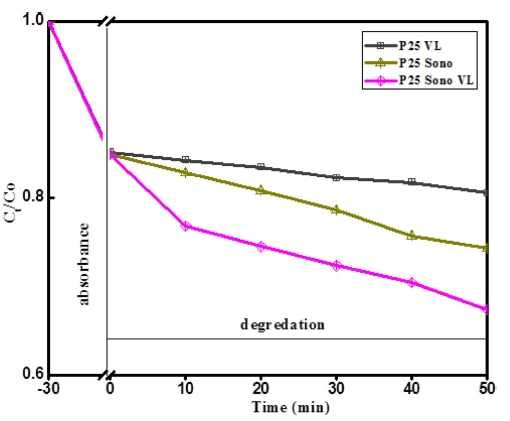
Fig. 5
The comparison of photocatalytic, sonocatalytic, and sonophotocatalytic degradation of Rh.B by P25.
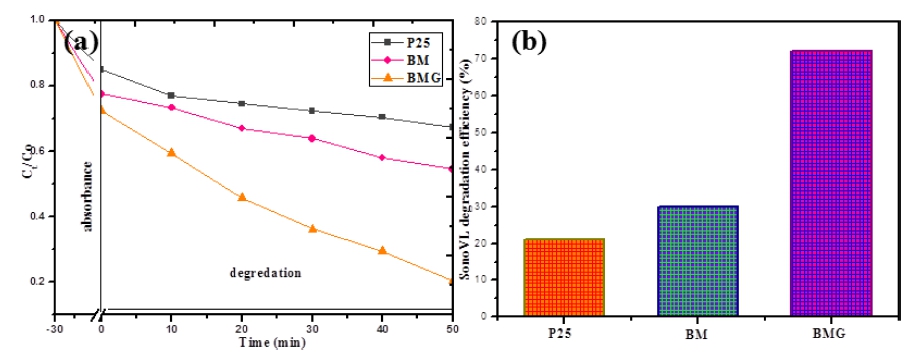
Fig. 6
(a) Relative concentration of Rh.B (Ct/C0) for adsorption and degradation; (b) Sonophotocatalysis degradation efficiency.
All calculated -ln(Ct/C0) values were approximately linear with the sono-photocatalysis time as shown in Fig. 7(a). Therefore, the degradation process of Rh.B on these six sonophotocatalytic points obeys first-order kinetics. Irradiation under visible light combing with ultrasound for 50 min, caused a significant decrease, which indicates that the degradation rate was quite rapid. On the other hand, the degradation rate in the presence of bare P25 was lower than that of the BMG composite catalyst. The degradation rate constant for BGM composites reaches 6.2 × 10⁻⁴ min-1, while degradation rate constant is 3.8 × 10⁻⁴ min-1 for P25. Fig. 7(b) reveals that BMG maintained its sono-photocatalytic activity after four runs of Rhodamine B degradation. These results indicate that the prepared BGM nanocomposites have high stability and no photocorrosion during the sono-photocatalytic oxidation of Rhodamine B. Graphene modification not only improves the photocatalytic performance of Bi2MoO6 nanoparticles, but also improves their long-term stability. These results are important from a practical point of view, as the enhanced sono-photocatalytic activity and stability of BGM will lead to more economical operation.
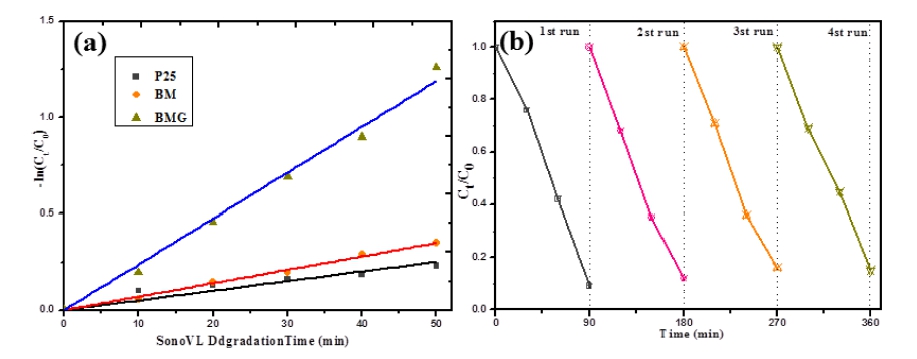
Fig. 7
(a) Apparent first order kinetics of RhB degradation against P25, Bi2MoO6 and graphene-Bi2MoO6; (b) Cycling runs about the sonophotocatalytic degradation of RhB with graphene-Bi2MoO6.
Sono-photocatalytic degradation of the dyes in presence of nanomaterials has been reported in several papers. The OH• is depended in oxidation process, which can be explained by the well-known hot spot sonoluminescence mechanism as follows.30,31) Firstly, the non-uniform nucleation of bubbles will increase cavitation and lead to hot spots in the solution. These hot spots can cause the pyrolysis of water molecules to produce •OH. Second, sonoluminescence involves intense ultraviolet light that excites semiconductor particles as photocatalysts during the sonoluminescence process. Sonochemical reaction is usually a reaction pathway in which organic compounds are degraded by decomposition in collapsed cavitation bubbles using water as the solvent under extremely high temperature and pressure [Eq. (1)].32,33) When combined with photocatalysis, the ultrasonic dynamic system can not only decompose water acoustically, but also produce electron-hole pairs coupled with photocatalysis [Eq. (2)]. The electron–hole pairs can produce •OH radical and superoxide anion •O2−, which can decompose the dyes to CO2, H2O and inorganic [Eqs. (3)-(5)].34)
We propose a mechanism for the degradation of pollutants on BMG nanocomposite under visible light combining with ultrasonic irradiation as shown in Fig. 8.
4. Conclusions
To summarize, the graphene nanosheets were deposited with Bi2MoO6 nanoparticles to improve the chemical stability and dispersion of the Bi2MoO6 which introduced as an effective sonophotocatalyst. The adsorption and surface properties as structural and chemical composition of the BMG were investigated. The loading of Bi2MoO6 nanoparticles on surface of graphene nanosheets helps to effectively separate the generated support and improve the surface properties of the catalyst, thus improving the catalytic efficiency of the catalyst. In this work, the Rh.B (15 mg/L) degradation rate constant of as-prepared BMG nanocomposite is 1.6 times as much as that of P25.
