

1. Introduction
Recently, upconversion (UC) phosphors, due to their unique emission properties and stable crystal structures, have led to the highly attractive characteristics in such important fields of optoelectronics as laser materials, display devices, 3D-assisted LED, solar cell structures and biological sensors.1-5) The double alkaline-earth tungstates with general composition MLn2(WO4)4 (M: alkaline-earth bivalent metal ion, Ln: trivalent rare-earth ions) belong to scheelite structured compounds. Recently, the related double molybdates have been considered for their highly modulated structures and specific spectroscopic characteristics, including excellent UC emissions.6,7) In particular, the Na-containing double tungstates NaLn(WO4)2 (Ln3+ = Gd3+, Y3+, La3+) crystallized in tetragonal phase with the space group I41/a, belong to the scheelite-type structure family. It is well known that the Ln3+ ions in the disordered tetragonal structure can be partially substituted by Yb3+ and Ho3+ ions in Ln3+ sites. Lanthanide trivalent ions could be partially incorporated into the tetragonal scheelitetype structure due to similar ionic radii and that provides a great potential for UC properties in the stable phase.8-10)
Concerning the lanthanide activator doping for the creation of UC phosphors, Ho3+ ions are extremely promising as luminescent centers, while Yb3+ ions can be employed as a helpful sensitizer due to their appropriate energy level structure. The Yb3+ and Ho3+ co-doped UC phosphors are characterized by their substantially enhanced UC efficiency because of the efficient energy transfer (ET) process from the sensitizer to activator, namely, from Yb3+ to Ho3+. In the UC process, Ho3+ exhibits the intense 5S2/5F4 → 5I8 transitions in the green emission range and strong 5F5 → 5I8 transitions in the red emission range enhanced at optimal x = Yb3+/Ho3+ values.11-13) In the past, rare-earth doped double tungstates NaLn(WO4)2 were synthesized by several processes.15-17) To have a possibility for an optimal material selection in laser and photonic fields, it is required to design and synthesize new complex tungstate compounds with stable crystal structures and excellent UC luminescent properties. However, the known triple tungstate spectrum is relatively narrow and the active search for new materials in this field is topical. Among the present technological methods, microwave-assisted synthesis has its advantages of a very short reaction time, homogenous particles, narrow particle size distribution and high final product purity.18,19) The microwave assisted sol-gel (MAS) process can provide efficient results in the synthesis of complex oxide compounds, providing a highly homogeneous particle morphology and very stable structures.
In the present work, the triple tungstates based on NaPbLa(WO4)3 with the proper doping by Yb3+ and Ho3+ at x = 7, 8, 9, 10 were successfully fabricated by the MAS-based process in the air. The crystal structures of NaPbLa(WO4)3:Yb3+,Ho3+ solid solutions were obtained by Rietveld analysis for the first time. X-ray diffraction (XRD) and scanning electron microscopy (SEM) were employed to evaluate the microcrystal morphology. The pump power relationship and Commission Internationale de L'Eclairage (CIE) chromaticity parameters of the UC emission were comparatively evaluated in detail. The optical characteristics were examined using the photoluminescence (PL) emission and Raman spectroscopy.
2. Experimental Procedure
In this experiment, the fabrication of triple tungstates of NaPbLa(WO4)3 with the proper doping of Yb3+ and Ho3+ at x = 7, 8, 9, 10 was carried by the MAS method. Na2WO4·2H2O, Pb(NO3)2, La(NO3)3·6H2O, (NH4)6W12O39· xH2O at the purity of 99.0 %, and Ho(NO3)3·5H2O Yb(NO3)3·5H2O at the purity of 99.9 % were received from Sigma-Aldrich, USA. In addition, citric acid at the purity of 99.5 % was purchased from Daejung Chemicals, Korea. Besides, distilled water, ethylene glycol (A.R.) and NH4OH (A.R.) were used to prepare the triple tungstate compounds.
The compounds of Na2WO4·2H2O, (NH4)6W12O39·xH2O and Pb(NO3)2 were dissolved in 450 mL Pyrex glass with the addition of 20 mL of ethylene glycol and 80 mL of 8M NH4OH, and stirred vigorously under heating. Subsequently, Ho(NO3)3·5H2O, Yb(NO3)3·5H2O and La(NO3)3 · 6H2O were dissolved in 450 mL Pyrex glass, with addition of citric acid (the molar ratio for citric acid to total metal ions is 2:1) and 100 mL of distilled water, and stirred vigorously under heating. The reagents were precisely weighed in accordance with the sample nominal composition. The abbreviated notations of NaPbLa(WO4)3: Yb3+/Ho3+ samples are given in Table 1.
Table 1
Abbreviation of the sample notations for NaPbLa(WO4)3:Yb3+/Ho3+ and Yb3+/Ho3+ ratio of 7, 8, 9, 10.
 |
Then, the two solutions were combined together and stirred vigorously under the heat-treatment at 80 ~ 100 °C. After few minutes, the transparent pure solutions indicated the formation of perfect sol state. It should be adjusted to pH = 7-8 by the addition of NH4OH. Then, the stirring was performed under the heat-treatment at 80 ~ 100 °C. For the efficient MAS process in 450 mL Pyrex glass, the appropriate solution amount is 180 ~ 200 mL. The final solutions were highly transparent. For the MAS process, a unique microwave oven was operated at the frequency of 2.45 GHz with the maximum output power of 1,250 W for 30 min. The prepared solutions were inserted into the oven with two kinds of cyclic working steps. At the first step, the microwave process was controlled by the cyclic regime of 40 s on and 20 s off for 15 min. At the second step, the further treatment was followed by the cyclic regime of 30 s on and 30 s off for 15 min. After the MAS process, the resultant sols were treated under ultrasonic radiation for 10 min to reach light yellowish transparent sols. Then, the sols were dried at 120 °C in a dry oven for one week. The resultant black dried gels were ground and annealed at 850 °C for 16 h in the air. After the annealing process, white particles were obtained for the pure sample of NaPbLa(WO4)3 and pink particles were obtained for the doped compositions of NaPbLa(WO4)3:Yb3+/Ho3+.
The X-ray diffraction patterns for the synthesized powder samples were recorded using XRD (D/MAX 2200, Rigaku, Japan). The microstructural morphology of the synthesized particles was observed using SEM (JSM- 5600; JEOL; Japan). The PL spectra were recorded using a spectrophotometer Perkin Elmer LS55 (UK) at room temperature. The pump power relation of the UC emission intensity was measured at the working power from 20 to 110 mW. The Raman spectra measurements were carried out using a LabRam Aramis (Horiba Jobin-Yvon; France) with the spectral resolution of 2 cm−1. The 514.5-nm line of an Ar ion laser was used as an excitation source and the power on the samples was kept at the 0.5 mW level to avoid the sample decomposition.
3. Results and Discussion
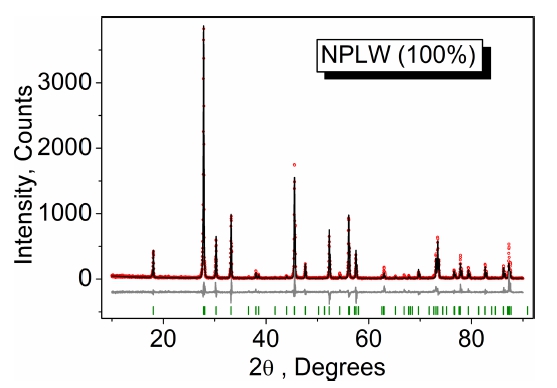
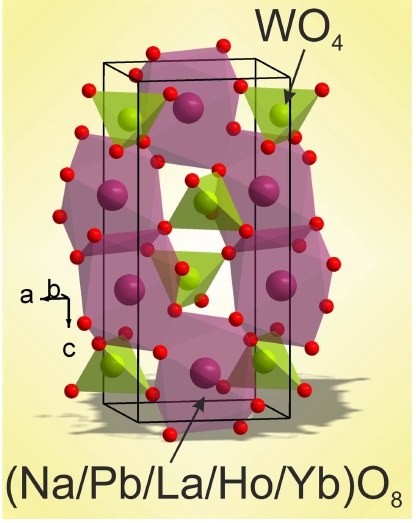
The XRD pattern measured for NPLW is shown in Fig. 1 and the patterns of doped samples are shown in Figs. S1-S4 (Supporting Information). All peaks of the powder patterns recorded from NaPbLa1-x-y(WO4)3:xHo3+,yYb3+ (x = 0, 0.05; y = 0, 0.35, 0.4, 0.45, 0.5) compounds were successfully indexed by the tetragonal cell (I41/a) with cell parameters close to those of PbMoO4.20) Therefore, the crystal structure of PbMoO4 was taken as a starting model for Rietveld refinement. The Pb2+ ion site was considered as occupied by Pb, Na, La, Ho and Yb ions (Fig. 2) with fixed occupations according to the suggested formulas. The refinements were stable and gave low Rfactors (Table S1, Figs. 1, S1-S4). The coordinates of atoms and the main bond lengths are summarized in Tables S2 and S3, respectively. The crystallographic data are deposited in Cambridge Crystallographic Data Centre (CSD # 1948871-1948872 and 1966002). The data can be downloaded from the site (www.ccdc.cam.ac.uk/data_ request/cif).
The cell volume dependence on the average ion radius of big cations IR(Na/Pb/La/Ho/Yb), excluding W6+, in the NPLW:Ho3+,Yb3+ compounds is shown in Fig. S5. The IR values were calculated on the base of nominal compositions and the known system of ion radii.21) It is evident that the cell volume linearly decreases with the IR(Na/Pb/La/Ho/Yb) decrease or the (x + y) increase. This clearly proves the suggested chemical formulas of solid solutions NPLW:Ho3+, Yb3+. Besides, it is very interesting to see the position of NPLW:Ho3+,Yb3+ compounds among other known scheelite-type tungstates. In Fig. S6, the cell volume of selected simple and complex scheelite-type tungstates is shown as a function of big cation ion radius (IR), where, for the complex tungstates, the average big cation radius is calculated on the base of available structural information [1-15 Supporting Information]. From Fig. S6 and Table 4S, it is evident that the unit cell volumes of NPLW:Ho3+,Yb3+ compounds are in excellent relation to the general trend in scheelite-type tungstates.
The SEM images of synthesized (a) NPLW, (b) NPLW: Yb0.35Ho0.05, (c) NPLW:Yb0.40Ho0.05, (d) NPLW: Yb0.45Ho0.05 and (e) NPLW:Yb0.50Ho0.05 particles are shown in Fig. 3. Most of the synthesized samples show similar morphological features with a particle size of 2 ~ 5 μm. No difference was observed in the particle morphologies shown in Fig. 3(a)-(e) and that shows the homogeneous crystallization. Commonly, the agglomerated particles seem to be induced by the atomic interactions between the grains. Therefore, the MAS method, employed to the triple tungstates in the present experiment, provides the efficient energy transfer to synthesize the uniform NPLW:Ho3+,Yb3+ triple tungstate compounds and the homogeneous particles with a fine morphology can be efficiently fabricated.
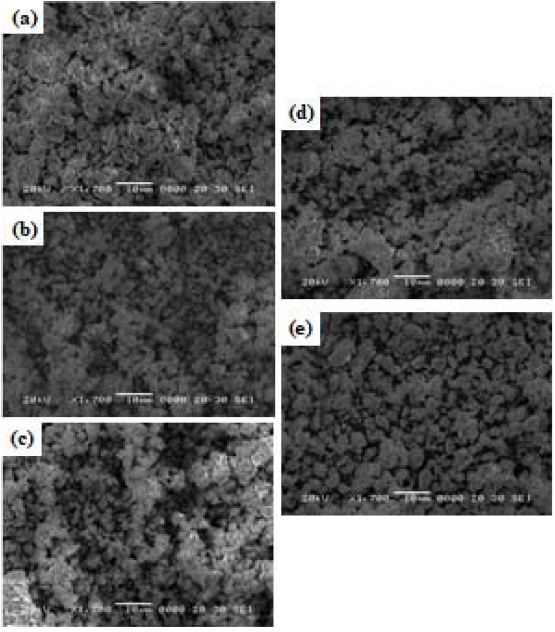
Fig. 3
SEM images of synthesized (a) NPLW, (b) NPLW:Yb0.35Ho0.05, (c) NPLW:Yb0.40Ho0.05, (d) NPLW:Yb0.45Ho0.05, and (e) NPLW:Yb0.50Ho0.05 particles.
In Fig. 4, the UC emission spectra of NPLW:HoYb samples are shown. Under the excitation at 980 nm, the NPLW:HoYb doped samples exhibited a yellowish green emission composed of red and green emission bands. At the red and green wavelengths, the Ho3+ ions show strong transitions 5F5 → 5I8 and 5S2/ 5F4 → 5I8, respectively. In the UC intensity competition between the samples, the NPLW:Yb0.45Ho0.05 particles provide the strongest 545-nm and 655-nm emission bands. Other samples are in the order of NPLW:Yb0.35Ho0.05, NPLW:Yb0.40Ho0.05 and NPLW:Yb0.50Ho0.05 in the emission intensity. Thus, the optimal Yb3+:Ho3+ ratio is revealed to be 9:1, which is attributed to the quenching effect of Ho3+ ions at y > 0.45. The logarithmic dependences of the UC intensities at 545 and 655 nm as a function of working pump power over the range of 20 ~ 110 mW in the representative sample of NPLW:Yb0.45Ho0.05 are shown in Fig. 5. As for the UC process, the slope value (n) for the irradiation pumping power is proportional to the UC emission intensity, where n is the pumping photon number, which is required for the development of UC emission. The UC intensity (I) is proportional to the nth power of input pump power (P), which is ascribed as I∝Pn. Concerning the dependences given in Fig. 5, the calculated slope value is n = 1.87 in the green emission at 545 nm, and n = 1.91 in the red emission at 655 nm. Consequently, these dependences could be ascribed to the multi-step energy transfer process, more specifically, twostep process, for the UC mechanism in NaPbLa1-x(Ho,Yb)x (WO4)3 phosphors.22-24)
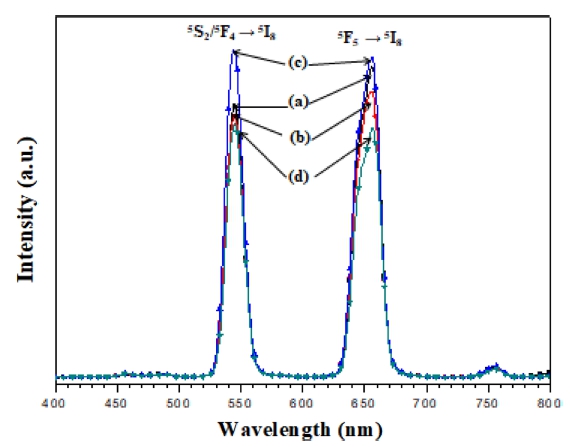
Fig. 4
The UC photoluminescence emission spectra of (a) NPLW:Yb0.35Ho0.05, (b) NPLW:Yb0.40Ho0.05, (c) NPLW:Yb0.45Ho0.05 and (d) NPLW:Yb0.50Ho0.05 particles excited by 980 nm at room temperature.
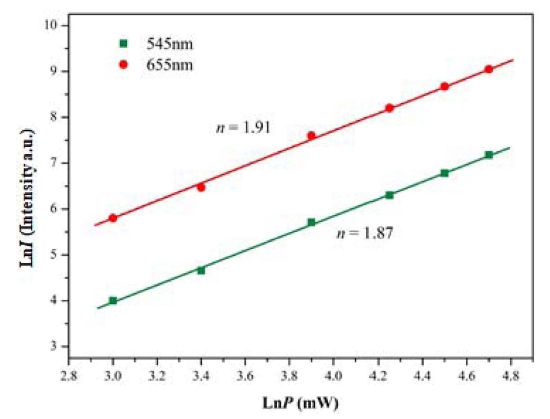
Fig. 5
Logarithmic scale dependence of the upconversion emission intensity on the pump power in the range of 20 to 110 mW at 545 and 655 nm in the NPLW:Yb0.45Ho0.05 sample.
In Fig. 6, the calculated chromaticity coordinates (x, y) and chromaticity locations in the CIE map are shown for the synthesized NaPbLa1-x(Ho,Yb)x(WO4)3 phosphors. The individual emission chromaticity points in the CIE map are related to the (a) NPLW:Yb0.35Ho0.05, (b) NPLW:Yb0.40Ho0.05, (c) NPLW:Yb0.45Ho0.05 and (d) NPLW:Yb0.50Ho0.05 samples, as defined by the color legend given in Fig. 6(B). The calculated chromaticity coordinates x = 0.359 and y = 0.491 for (a), x = 0.357 and y = 0.471 for (b), x = 0.355, y = 0.561 for (c), and x = 0.352 and y = 0.389 for (e) are correspondent to the yellowish green emissions attributed to the intense 5S2/ 5F4 → 5I8 and 5F5 → 5I8 transitions of Ho3+ ions in the NPLW host.
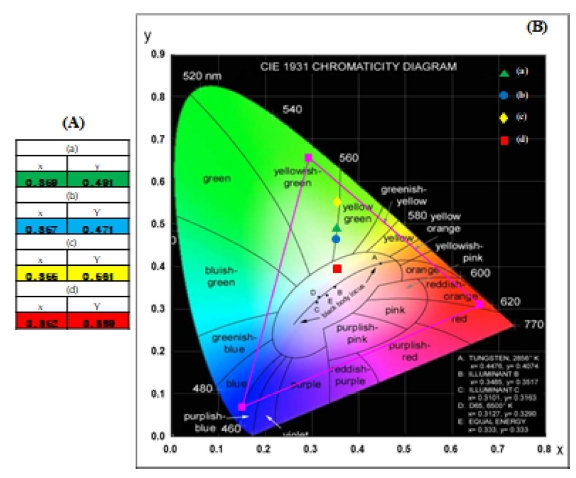
Fig. 6
CIE chromaticity diagram showing the color co-ordinates of the NPLW:YbHo phosphors. The inset shows the yellow emissions for the synthesized samples: (a) NPLW:Yb0.35Ho0.05, (b) NPLW:Yb0.40Ho0.05, (c) NPLW:Yb0.45Ho0.05, and (d) NPLW:Yb0.50Ho0.05 particles.
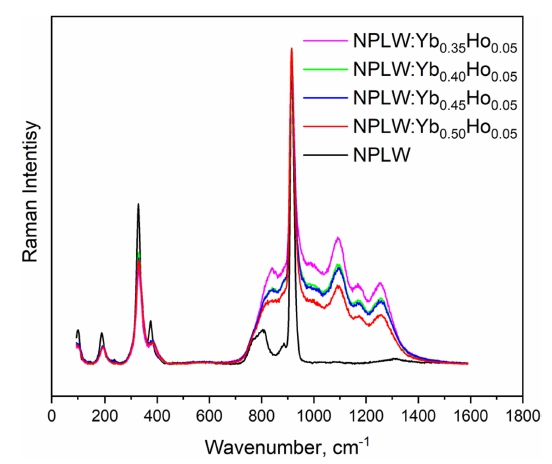
The unpolarized Raman spectrum obtained at room temperature from the NPLW sample is shown in Fig. S7. It can be divided into three parts: 950 ~ 700 cm−1, 425 ~ 275 cm−1 and the region below 275 cm−1. As it can be seen in Fig. 2, the W6+ ions are of tetrahedral coordination. The free [WO4]2− ion has the Td symmetry and, when it placed into the scheelite structure, its point symmetry reduces to S4. The correlation between the free [WO4]2− ion, site symmetry and factor group symmetry of unit cell is given in Table S5. The high frequency part of spectrum (above 700 cm−1) is related to the stretching vibrations of [WO4]2− ions. The strongest band at 915 cm−1 is a ν1 symmetric stretching vibration of the tungstate tetrahedron and the lines at 769 and 806 cm−1 are ν3 antisymmetric stretching.25) Both bands at 327 and 375 cm−1 consist of a couple of spectral lines and are related to ν2 and ν4 bending vibrations of [WO4]2− ions, respectively.25,26) The spectral bands around 200 cm−1 are the free rotational modes of [WO4]2− ions.27,28) The Raman spectra obtained from NPLW, in comparison with the NPLW doped with Yb3+ and Ho3+, are shown in Fig. 7. The spectral bands below 425 cm−1 can be interpreted as Raman-active vibrations, however, the stretching vibration region is covered with the Ho3+ luminescence and only the strong intensity line related to the WO4 symmetric stretching vibration is visible. The broad multi-component structure appearing in Ho-doped samples in the range 700 ~ 1,500 cm−1 is the contribution of the luminescence at the 5S2/ 5F4 → 5I8 transition after the off-resonant excitation of 5S2/ 5F4 states by the 514.5 nm radiation.
It is of interest to estimate the possibilities to control the spectral distribution in the UC luminescence by the chemical content of the host. The comparison of the UC spectra of NaSrLa(WO4)3:Ho3+/Yb3+ investigated in22 and those of NaPbLa(WO4)3:Yb3+/Ho3+ (present work) reveals that the intensities of UC luminescent transitions at 5S2/ 5F4 → 5I8 and 5F5 → 5I8 channels are almost equal in the latter case, while in strontium-based crystal, the latter channel prevails. In view of the two-step nature of the UC process established in Fig. 5, the excitation of 5F5 state is due to the relaxation from the upper states that are directly excited by the UC energy transfer. The vibrational cutoff frequencies are close to each other in both hosts and are weakly influenced by a heavy doping with rare earth ions. Therefore, the above mentioned effect must be ascribed to the influence of crystal field engineering, namely, to the modification of wave functions of rare earth ions (either in a configurational space or via a variation of Judd-Ofelt intensity parameters) that happens in case of the change from strontium to lead and controls either non-radiative or radiative relaxation to the 5F5 state.
4. Conclusions
The MAS based yellowish green phosphors of NaPbLa(WO4)3:Yb3+/Ho3+ new triple tungstates were successfully fabricated under the variations of x = Yb3+/Ho3+ (x = 7, 8, 9, 10), showing the homogeneous crystallizations with the particle size of 2 ~ 5 μm. Under the excitation derived from 980 nm, the consequent phosphors led to the formation of yellowish green emissions with the intense transitions of Ho3+ from 5S2/ 5F4 → 5I8 in the green emission area, as well as the strong transitions from the 5F5 → 5I8 in the red emission area. The optimal Yb3+:Ho3+ ratio was revealed to be 9:1. The chromaticity coordinates in the CIE diagram corresponded to yellowish green emissions. The strongly dominant Raman spectra were attributed to the concentration quenching effect of Ho3+ ions and to the superimposition by intense Ho3+ luminescence lines showing drastically longer wavelengths.
