

1. Introduction
2. Experimental Procedure
3. Results and Discussion
3.1. Evaluation of a marble glass
3.2. Continuous spinning system
3.3. Observe the fiber diameter depending on the winding speed
3.4. Observe the fiber diameter depending on the fiberizing temperature
3.5. Observe the fiber surface after an alkali treatment
4. Conclusion
1. Introduction
The glass fibers are formed from melts and manufactured in various compositions by changing the amount of raw materials like silica, alumina, calcium oxide, and boron oxide.1) These are fabricated by the rapid attenuation of many drops of molten glass exuding through a nozzle under gravity and suspended from it.2) Therefore, different types of glass fibers show different performances like alkali resistance or high mechanical properties using various amounts of silica or other sources.1)
They can be divided into continuous glass fibers and discontinuous glass fibers according to their shape. These products are classified according to the type of composite at which they are utilized. The chopped strands, rovings, yarns and mats are one of the products to form glass fiber-reinforced composites.1) The glass fiber can be classified into E (electric)-glass, D (dielectric)-glass, S (strength)-glass, and AR (alkali resistant)-glass depending on the use purpose.2) Of these, AR-glass fiber is currently used for alkali material reinforcement such as cement.3,4) Commercial AR-glass fibers have zirconia content of 15 % by weight. However, because the melting temperature of zirconia is very high (2,700 °C), its fiberizing temperature is also high, which makes it difficult for AR-glass fibers with a large zirconia content to undergo fiberizing processes. Fabrication of AR-glass fibers is very difficult and very expensive.5) Very few companies are making AR-glass fiber these days. Plus, there is no company in the domestic area.6) That’s why there have not been published studies that deal with the change of the physical properties depending on the continuous fiber spinning conditions. By recycling raw materials, glass fibers can get the benefits of reducing costs. Recently, refused coal ore has become an environmental risk factor due to its neglected long-term environmental exposure around collieries.7,8,9) Therefore, research studies on the applications of refused coal ore have been carried out in the civil and materials engineering fields, and in the raw materials industry. However, with the exception of some experiments carried out in Korea involving artificial light-weight, ceramic aggregates,10,11,12) there have not been many studied published that deal with the practical applications of refused coal ore.13,14,15) In this study, we have chosen AR-glass fiber with 40 wt% refused coal ore content in the preceding study.16) We applied the continuous spinning for the AR-glass fiber with 40 wt% refused coal ore content. AR-glass fiber was also measured for the mechanical propertie.
2. Experimental Procedure
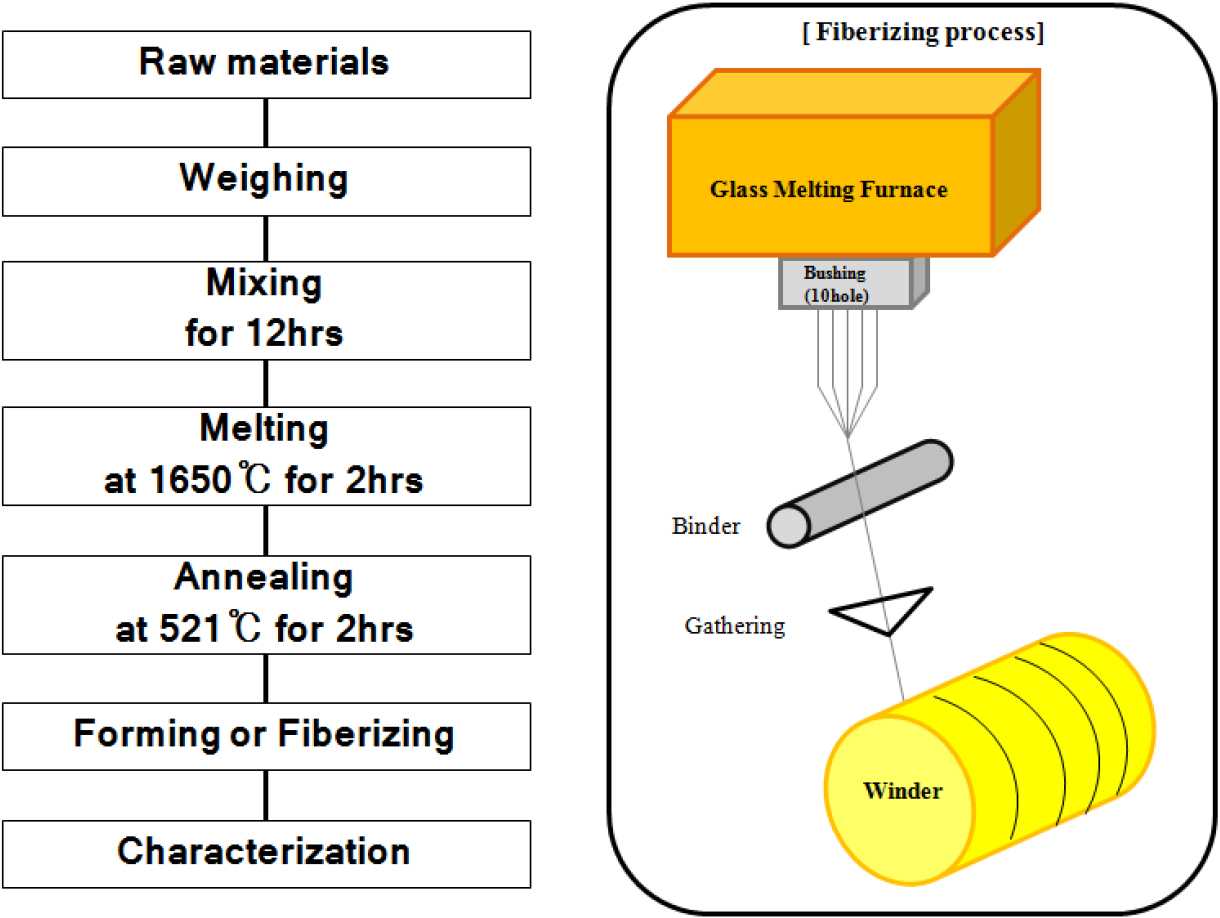
In this experiment, AR-glass composition was chosen in the results of a previous paper.16) AR-glass composition with 40 wt% refused coal ore was shown in Table 1. The sample name was ARGF_CN40. The sample name was ARGF_CN40. Fig. 1 shows the glass fabrication process and continuous fiberizing equipment. The raw materials were placed into a platinum (Pt) crucible, and melted in a box furnace at 1,600 °C for 2 h. Some of the melted glass was then poured into a graphite mold to fabricate the marble glass. To remove any stress, the glass was annealed into the box furnace at 521 ± 10 °C for 2 h.17) As shown in Fig. 1, the filaments were made by the 10-nozzle continuous fiberizing equipment. The bushing kept the fiberizing temperature by the range of 1,240 to 1,340 °C. The melted glass was drained through the bushing nozzle. The end of the fiber that is coated with binders on the surface is attached to the winder drum. The fiber is wrapped at the speed range of 100 to 700 rpm. The fiber diameters were measured at least 40 times using an optical microscope (Olympus, Japan), and the results were reported as the mean ± standard deviation. To measure its surface, a field emission scanning electron microscope (FE-SEM, JSM 6700, JEOL, Japan) was utilized. The tensile strength of glass fibers was determined by following the ASTM D3379-75 standard, using an Instron 5544 universal materials testing machine with a 10 N load cell (2712-013) and a gauge length of 20 mm, at a testing speed of 0.5 mm/min. The tensile strength was measured at least 30 times, and the results are reported as the mean ± standard deviation to improve the reliability of the data. To test their chemical properties, the glass fibers were immersed in a 12.5 p H solution of 0.88 g/L NaOH, 3.45 g/L KOH, and 0.48 g/L Ca(OH)2.18) The treating time ranged from 0 to 72 h and the experimental solution was maintained at 80 °C during the process. After treatment, the state of the glass fiber surfaces was observed using an FE-SEM.
3. Results and Discussion
3.1. Evaluation of a marble glass
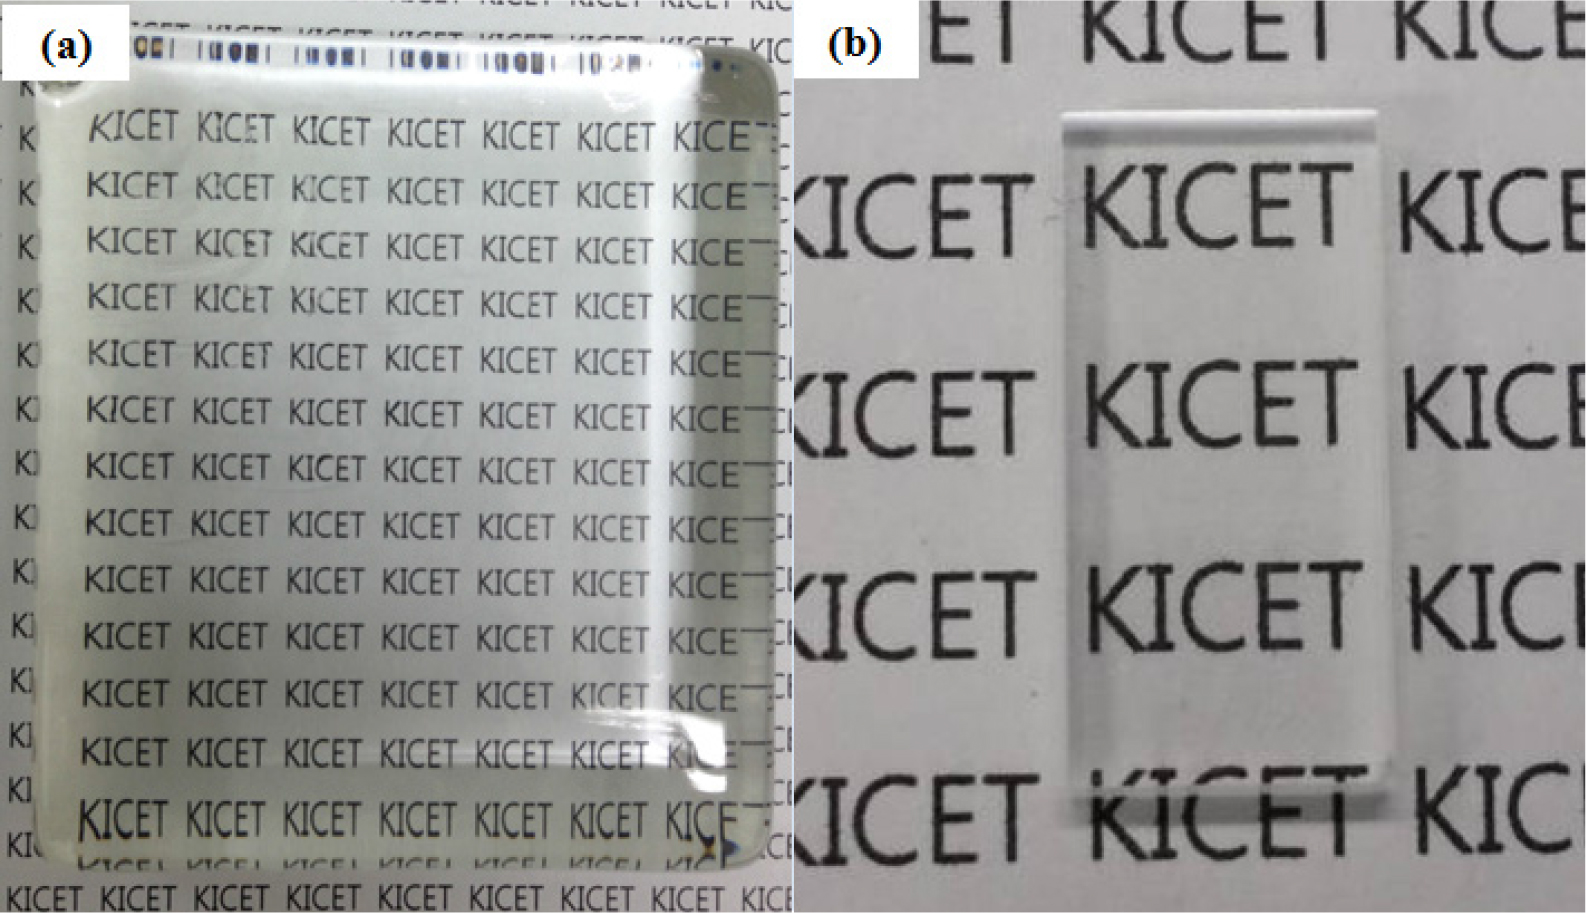
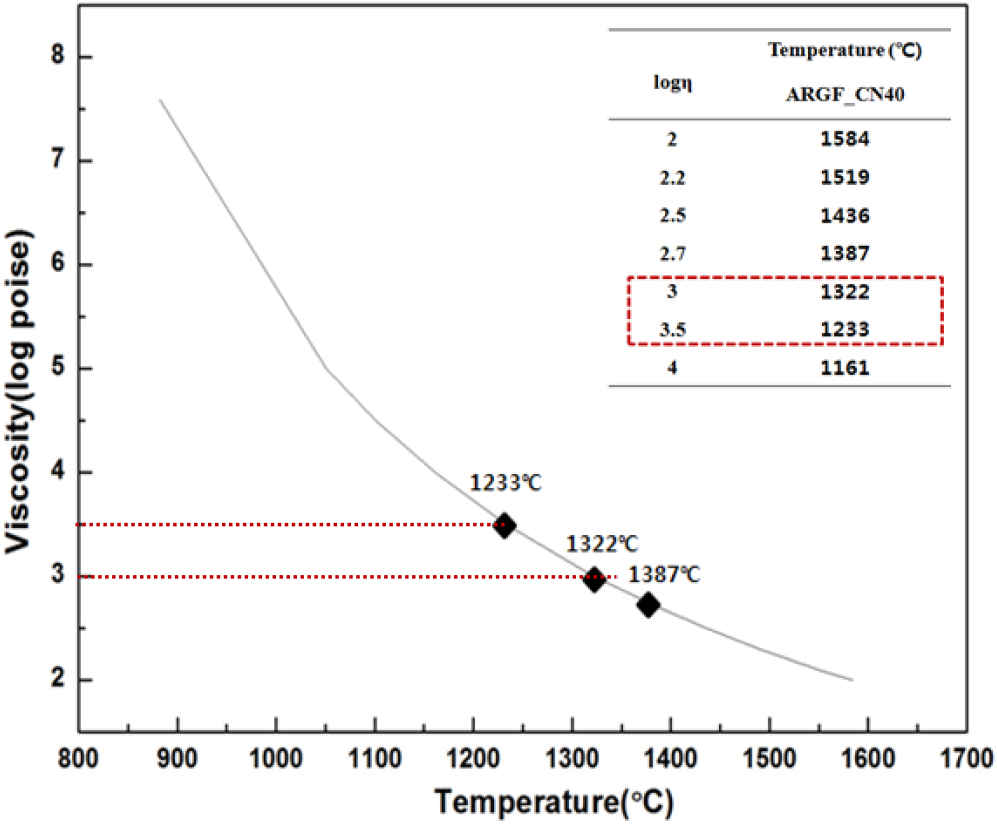
When fiber has voids, spinning the fiber continuously is very difficult. That’s why, checking optical properties of melted glass is very important. Fig. 2 is a marble glass of the before polishing (a) and after polishing (b). We can find that there was no void in the glass at before polishing the sample, and the visible light transmittance can be checked at about 87.4 % in the proceeding study.16) This shows higher transmittance than the commercial plate glass. The viscosity of the molten glass is significantly influence by the change in the chemical composition of silica glass and the temperature. The fiberizing temperature of glass fiber was universally applicable at Log3 forming temperature (TF). For successful drawing, the glass viscosity has to be within a range of 600 to 1,000 poise.18,19)Fig. 3 is a graph of high viscosity. The viscosity of ARGF_CN40 is 1,387 °C, 1,322 °C, 1,233 °C at Log 2.7, Log 3, and Log 3.5, respectively.
3.2. Continuous spinning system
As shown in Fig. 1, the fiber spinning system consists of 10 nozzle bushing, a binder roller, winding part, and temperature controller. As shown in Fig. 1, 10 nozzle equipment did the melting and the spinning at the same time. So, a nonhomogeneous glass can cause a problem for fabricating the fiber.20) That’s why the raw materials used the marble glass fabricated clear glass. From the results of viscosity test, it was concluded that a continuous spinning is possible at fiberizing temperature above 1,240 °C. Fibers are fabricated from a temperature ranging from 1,240 to 1,340 °C, and from a winding speed of 100 to 700 rpm.
3.3. Observe the fiber diameter depending on the winding speed
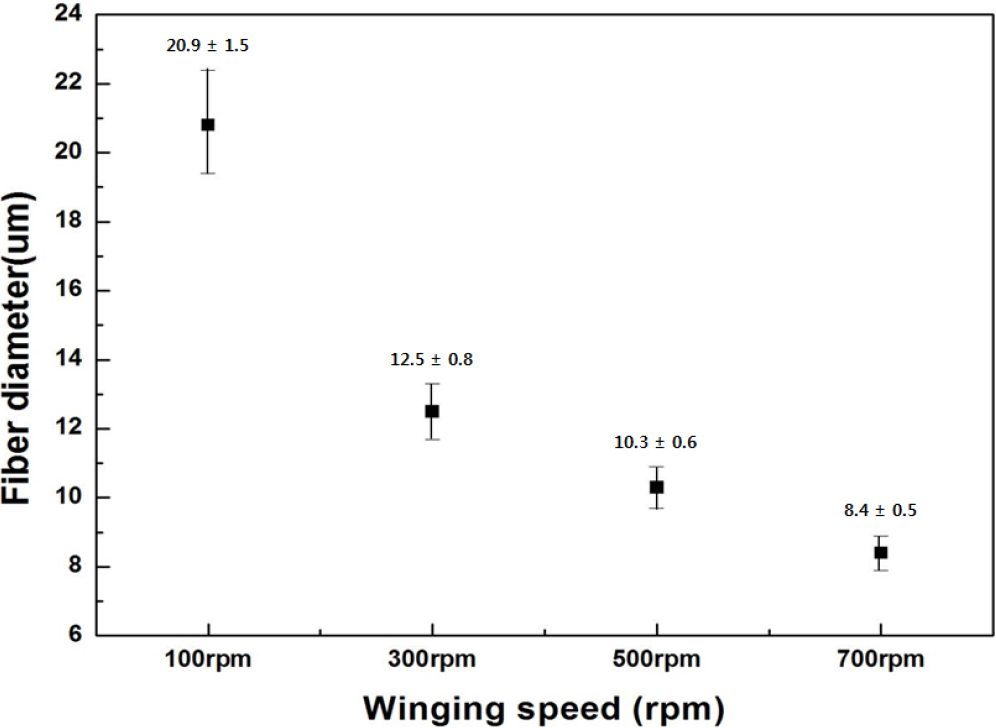
The speeds of winder, the bushing temperature, the glass viscosity are very important factor to decide the fiber diameter. Fig. 4 shows the fiber diameter depending on the winding speed. Glass fiber was fabricated in the winding speed range of 100 to 700 rpm at 1,240 °C. As the winding speed increased at a constant temperature, fiber diameters tended to decrease.
The flow rate of molten glass through a nozzle can be described in relation to Poiseuille’s equation.21)
where, F is the rate of flow in g/h, ρ is specific gravity of molten solution, g is gravitational acceleration, h is the height of glass above the nozzle, η is the viscosity of the glass, and l is the length of the bushing tip.
The diameter of the fiber depends on the fiberizing temperature and winding speed [Eq. (1)]. As winding speed increased by the range of 100 to 300 rpm, the fiber diameter decreased to about 40 %. However, as winding speed increased by the range of 300 to 500 rpm, the fiber diameter only decreased to about 17 %. We confirmed that the fiber diameter with the interval of 200 rpm was reduced to about 17 % over 300 rpm. As a result, it was judged that the fiber diameter drop decreased above a constant winding speed. Furthermore, the fine fiber (≤8 um) was fabricated at 700 rpm of winding speed.
3.4. Observe the fiber diameter depending on the fiberizing temperature
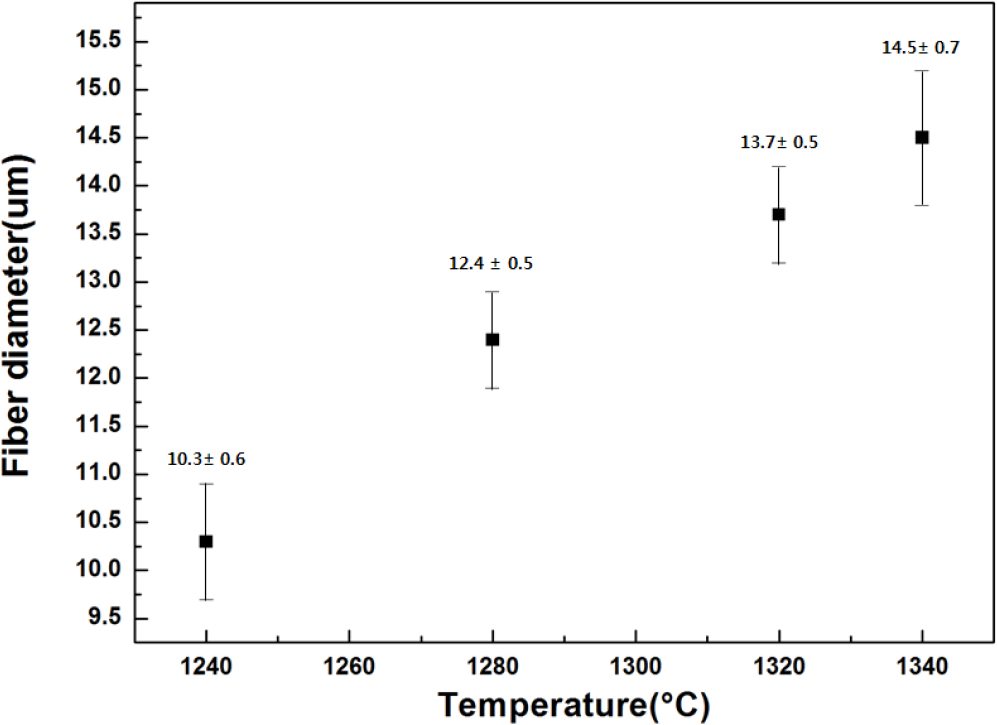
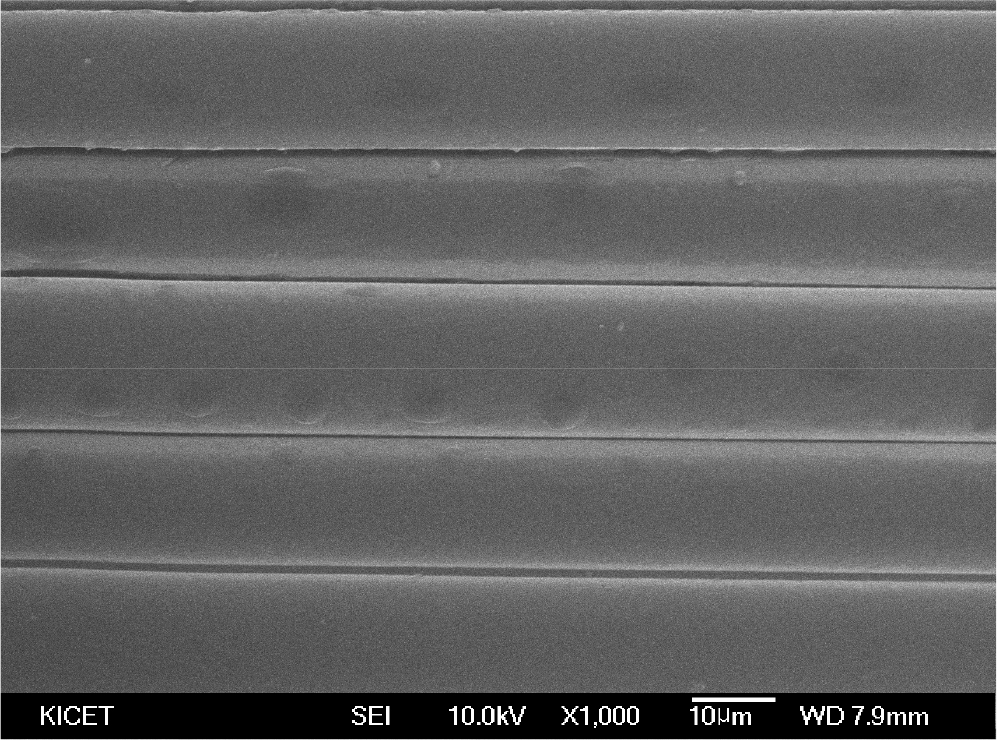
Fig. 5 is the result of fiber diameter according to change of fiberizing temperature. When the winding speed was constant at 500 rpm, the effect of the fiberizing temperature on the fiber diameter was confirmed. As shown in Fig. 5, the average fiber diameter was about 10 um at 1,240 °C, 12 um at 1,280 °C, and 13 um at 1,320 °C, respectively. The average diameter of the spinning fibers was increased to about 12 um at 1,280 °C and 13 um at 1,320 °C. As the fiberizing temperature became lower, the viscosity of melting glass became higher. At higher viscosities, the tension in the fiber during attenuation is too high. That’s why, the glass flow rate through a nozzle can be become too low to maintain a stable meniscus. At lower viscosities the glass is too fluid and falls away from the nozzle as drops. The rate of attenuation is decreased the fiber will simply assume a large diameter.22) In essentials, it’s evaluated the fiberizing trend shows depending on Poiseuille’s equation. Fig. 6 is glass fiber shapes at a continuous spinning. As shown Fig. 6, the fibers had almost similar diameter. A binder was also uniformly coated on the fiber surface. It was confirmed that fibers also were fabricated without a crack.
3.5. Observe the fiber surface after an alkali treatment
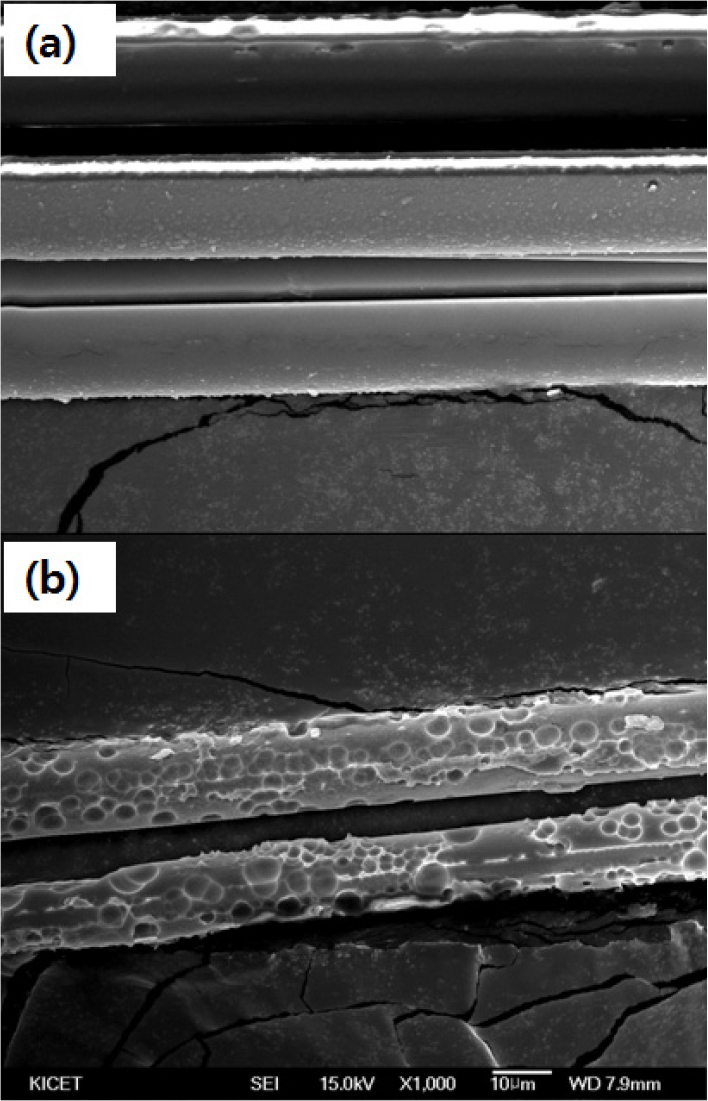
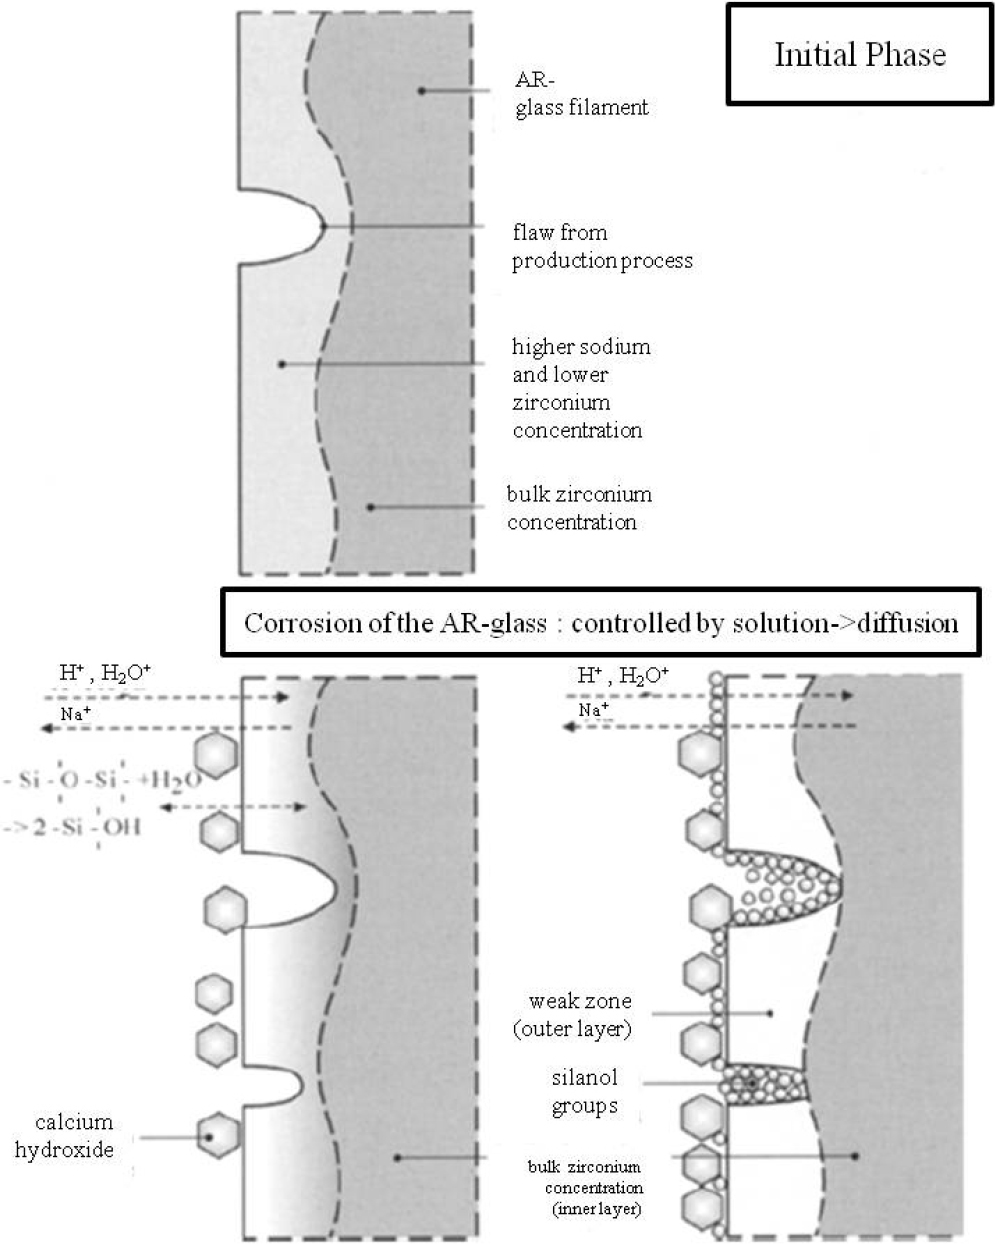
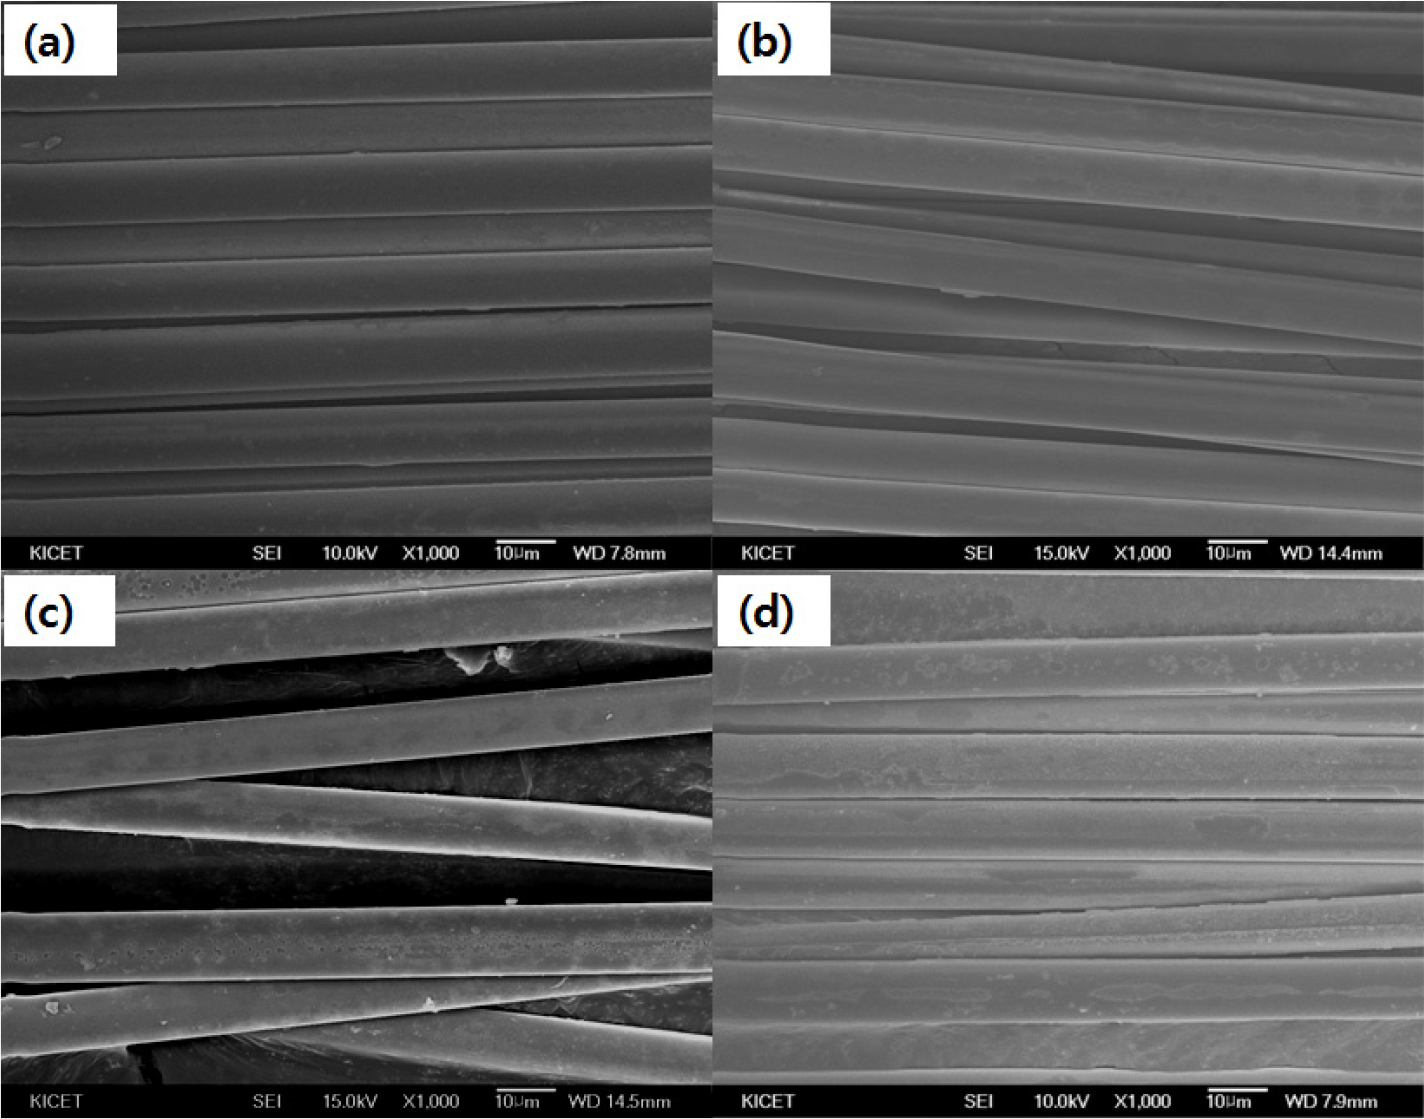
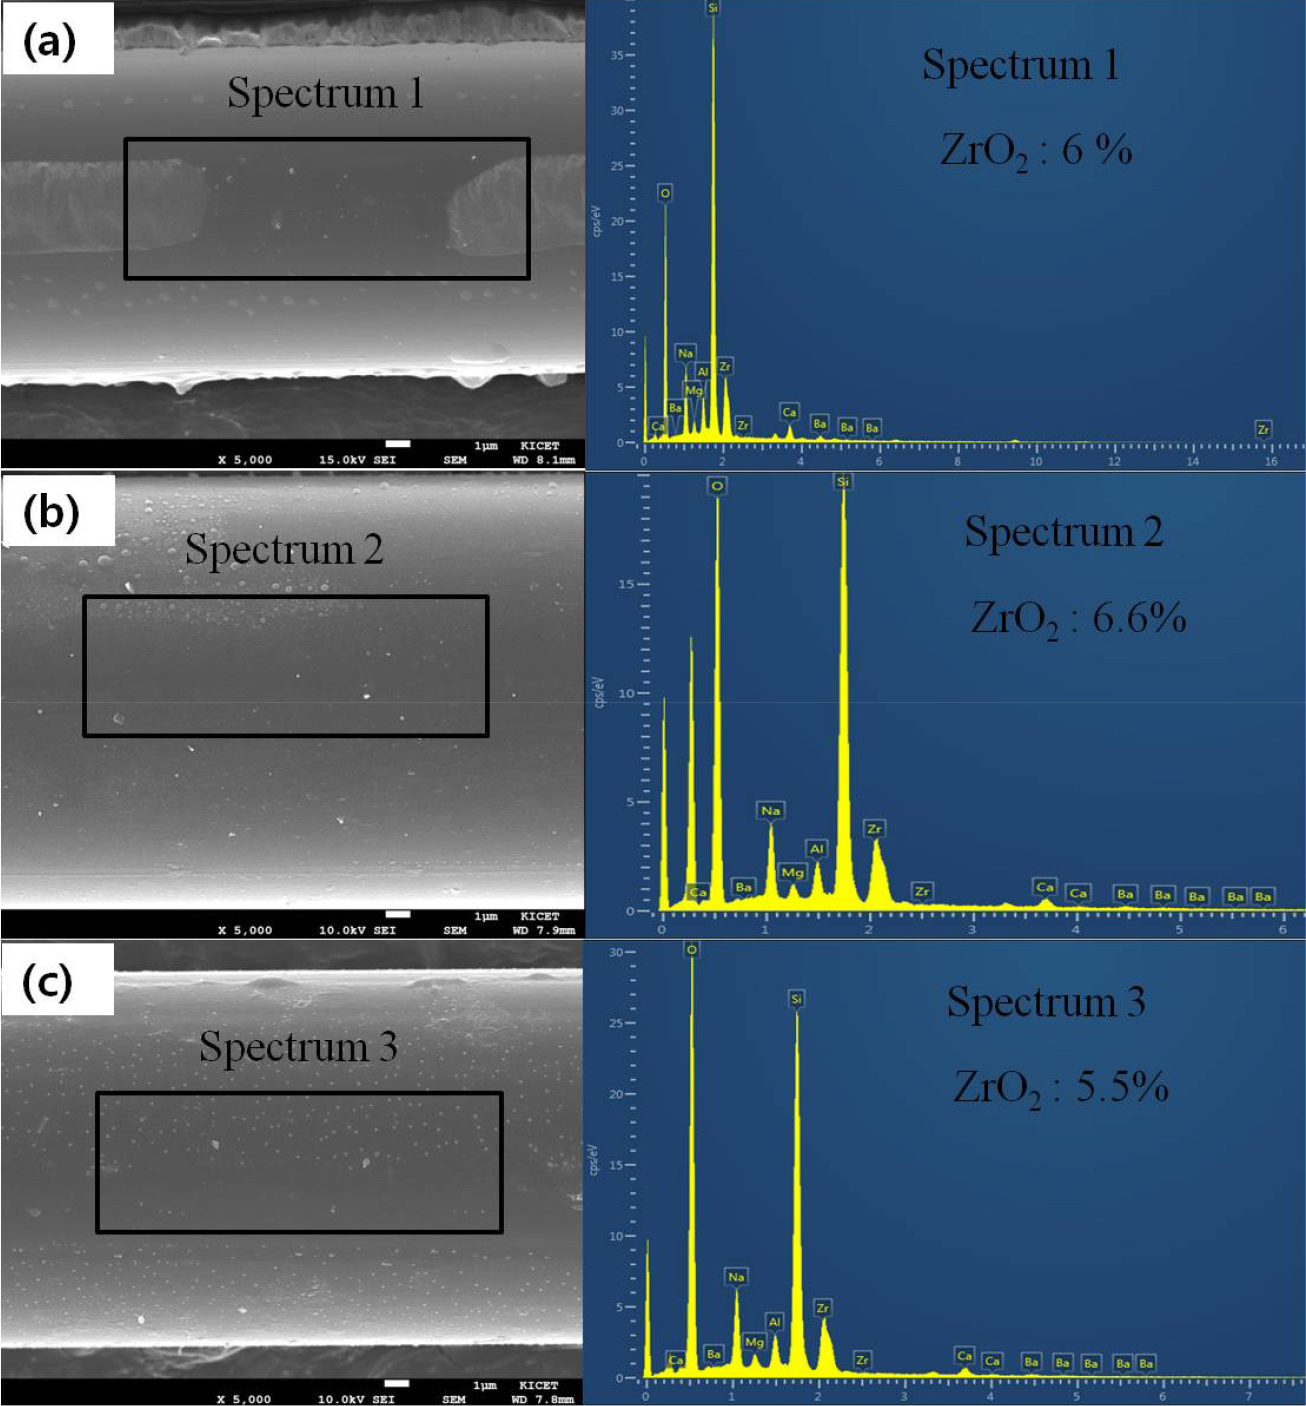
An AR test was conducted in extreme environments of a strong alkali at 80 °C. Fig. 7 shows the FE-SEM images of surface morphologies of E-glass fiber (EGF) sample after 48 h in alkaline solution. The EGF sample was severely attacked by the alkaline solution after 48 h. There are many dents on the fiber surface. An alkaline solution may penetrate into the net structure of the glass fiber and cause reactions that destroy the original structure. Fig. 8 shows schematically the evolution of different layers, which influence the main degradation process. The main component in the glass is SiO2. During chemical treatment in the alkali solution, the Si-O bond will be broken by the hydroxyl ion. The element concentrations are not evenly distributed, which leads to evaluations of different depth of the layers along the glass fiber surface. These results show that weak point and defects will grow notably due to chemical attack leading to reduction of strength, without application of any mechanical load.23)Fig. 9 shows the FE-SEM images of surface morphologies of ARGF_CN40 sample after 72 h in alkaline solution. As shown Fig. 9, it was confirmed that the ARGF_CN40 surface was not carried out after 72 h except that some precipitate from the alkali solution was attached to the fiber surface. Comparing to its state 24 h earlier, it was confirmed that the difference in the process speed of surface change was also not much different after 72 h. Fig. 10 shows SEM images and EDS spectra of the ARGF_CN40 before and after alkali treatment. After 48 h, it didn’t also show obvious signs of corrosion on the glass fiber [see Fig. 7 (a, b)]. After 72 h, it did show some obvious signs of corrosion on the glass fiber. However, ARGF_CN40 wasn’t even found with a large difference compared to its earlier after 24 h of alkali testing. The EDS spectra are presented here to indicate the composition change of the ARGF_CN40 surface after alkali treatment, and the microanalysis results are shown in Table 2. As seen, the concentrations of the elements in fiber aren’t found. Hydration of ZrO2 cannot occur at pH values between 0-14. Stable ZrO2 surface retards the diffusion of other ions through this ZrO2 network. Through this, it was shown that the ARGF_CN40 fiber had excellent AR properties. So, the reinforced fibers can be considered superior to normal EGF.
4. Conclusion
In this study, the fiberizing properties for AR-glass fiber with a low zirconia was confirmed. Glass fibers were fabricated and evaluated in continuous spinning conditions. As the winding speed increased in the range of 100 to 700 rpm at 1,240 °C, the fiber diameters tended to decrease. However, it has been confirmed that the decrease rate in fiber diameters were reduced above a constant speed. As fiberizing temperature increased in the range of 1,240 to 1,340 °C at 500 rpm of winding speed, fiber diameters tended to increase. The fiber diameter was influenced by the viscosity differences of the molten material at a constant speed. The result of alkaline test, it was confirmed that the difference in the process speed of surface change was also not much different after 72 h. Through this, fiber with a low zirconia content can be fabricated to have an excellent AR properties. They are also determined that they can be used sufficiently for composite materials because it is easy to fabricate AR-glass fibers.
