

1. Introduction
Titanium is widely used in various electrochemical and energy-related applications because of its excellent corrosion resistance, mechanical stability, and electrical properties.1,2,3) A porous structure changes the conduction pathway and the effective conduction area, thereby significantly influencing electrical conductivity and interfacial charge transfer behavior.4,5,6) Porous titanium sheets fabricated by tape casting and sintering are used as porous transport layers (PTLs) in fuel cells and water electrolysis systems.7,8,9) They perform distribution and filtration functions for gases and electrolytes, while also serving as current collectors and mechanical supports.8,9,10) Therefore, the pore characteristics and surface condition of titanium sheets are important factors affecting overall system performance.5,8) In general, surface roughness is an important factor affecting contact resistance, passive film stability, and current distribution.11,12) For titanium, the formation and growth behavior of the passive TiO₂ film are sensitive to the surface condition,3,13) suggesting that changes in surface roughness may directly affect both the electrical properties and electrochemical behavior. In addition, the electrical resistance of metals can be described as the sum of electron-scattering contributions arising from impurities, crystal defects, and geometrical factors, based on Matthiessen’s rule,14,15) and these scattering mechanisms may become more complex in porous structures.4,5) Furthermore, the electrochemical behavior of metals is determined by charge transfer reactions at the electrode/electrolyte interface and by the stability of the passive film. Polarization resistance (Rp) is widely used as an important indicator of interfacial reaction resistance and the protective characteristics of the passive film.16) However, systematic studies on how surface roughness affect the electrical and electrochemical properties of non-porous and porous titanium sheets remain limited. Therefore, this study comparatively investigated the dependence of the electrical and electrochemical properties of non-porous and porous titanium sheets on surface roughness.
2. Experimental Procedure
The non-porous sheet used in this study was fabricated from CP-Ti Grade 4, whereas the porous sheet was prepared from TiH2 powder through reduction, tape casting, and sintering processes. Using the interplanar spacings of several diffraction planes obtained from X-ray diffraction (XRD) analysis (Table 1), the oxygen content was estimated using the lattice expansion-oxygen concentration relationship expressed by Eq. (1).17)
Table 1.
Miller indices hkl and d-spacing (Å) of α phase in non-porous sheet and porous sheet obtained from Fig. 2.
| α-Ti (hkl) | d-spacing (Å) | |
| non-porous sheet | porous sheet | |
| (100) | 2.5565 | 2.5574 |
| (002) | 2.3432 | 2.3445 |
| (110) | 1.4755 | 1.4772 |
| (101) | 2.2457 | 2.2457 |
| (102) | 1.7269 | 1.7275 |
| (103) | 1.3329 | 1.3332 |
The oxygen contents of both specimens were in the range of 0.2-0.4 wt%, showing no significant difference between the two specimens. The microstructures were examined using scanning electron microscopy (SEM) and optical microscopy (OM). To investigate the effect of surface roughness, the surface condition was gradually controlled using SiC sandpapers with grit sizes ranging from 100 to 1,200. Sheet resistance (Rs) was measured for specimens polished with grit sizes from 100 to 1,200, whereas corrosion and electrochemical properties were evaluated using specimens polished with grit 100 and 1,200. The polished specimens were designated as G100 and G1200 according to the grit size. After polishing, the specimens were ultrasonically cleaned in deionized (DI) water for 10 min. Surface roughness was quantified using the arithmetic average roughness (Ra) measured by a surface profiler (DektakXT). The sheet resistance (Rs) was measured using a four-point probe. Potentiodynamic polarization and electrochemical impedance spectroscopy (EIS) were performed in 0.5 M H2SO4 solution using a three-electrode system. The exposed area of the working electrode was 1 cm2. A saturated calomel electrode (SCE) and a Pt wire were used as the reference electrode and counter electrode, respectively. Prior to polarization testing, the open-circuit potential was allowed to stabilize for 30 min. The polarization test was then run at 3 mV・s-1. EIS measurements were taken at open-circuit potential (OCP) using a 10 mV AC perturbation in the frequency range of 100 kHz to 10 mHz.
3. Results and Discussion
Fig. 1 shows SEM images of the surface and cross-sectional morphologies of the non-porous and porous sheets. The non-porous sheet exhibited dense surface and cross-sectional morphologies without observable pores, whereas the porous sheet showed an interconnected network of irregular pores formed during the tape-casting process. The thicknesses measured from the cross-sections of the non-porous and porous sheets were 100 and 160 µm, respectively, and the porosity of the porous sheet measured by the Archimedes method was approximately 36 %. Thickness and porosity differences may also be relevant to the interpretation of the electrical and electrochemical properties.
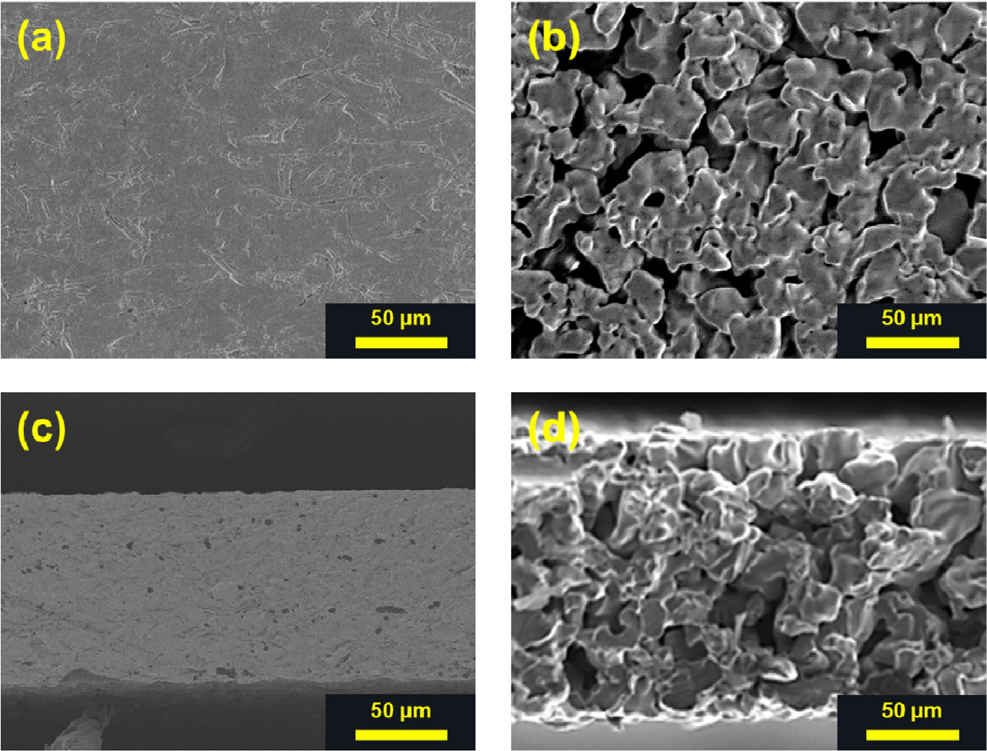
Fig. 2 shows the XRD patterns of the two sheets. Diffraction peaks corresponding to the α-Ti phase were observed in both sheets, and no secondary phases were detected.
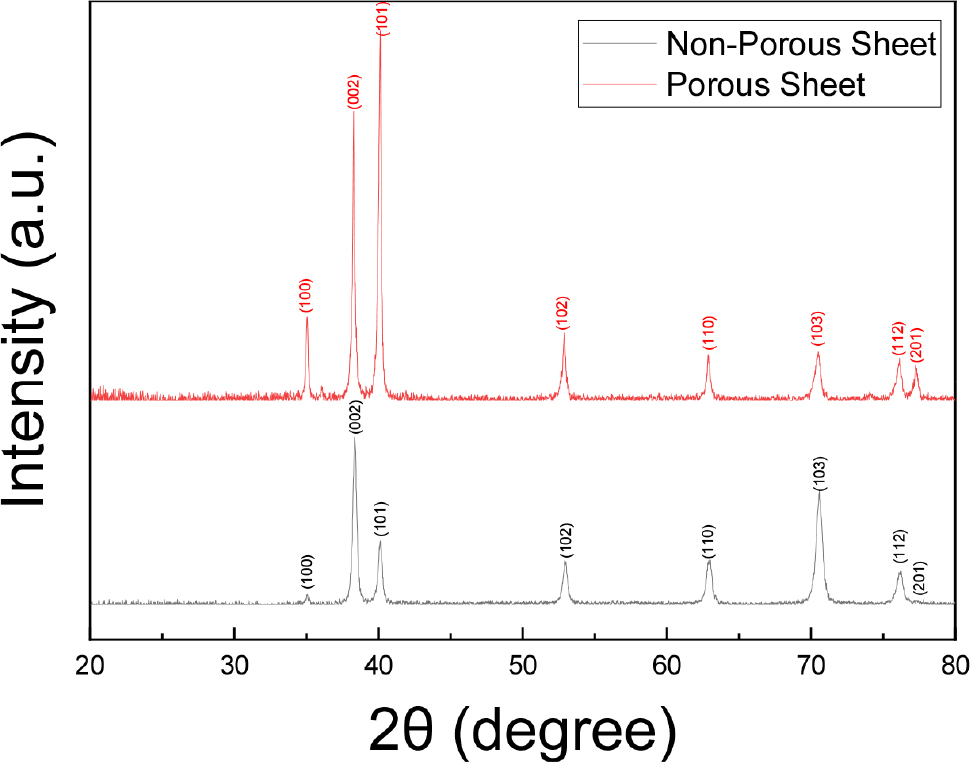
Fig. 3 presents the surface roughness (Ra) and sheet resistance (Rs) measured in the as-received condition. The non-porous sheet exhibited a surface roughness of 0.06 µm and a sheet resistance of 4.82 mΩ/□, whereas the porous sheet showed a much higher surface roughness of 2.41 µm and a correspondingly higher sheet resistance of 10.62 mΩ/□. Previous studies have shown that the electrical conductivity of porous metals decreases with increasing porosity because of the reduced effective conduction area and tortuous conduction pathways.4,5)
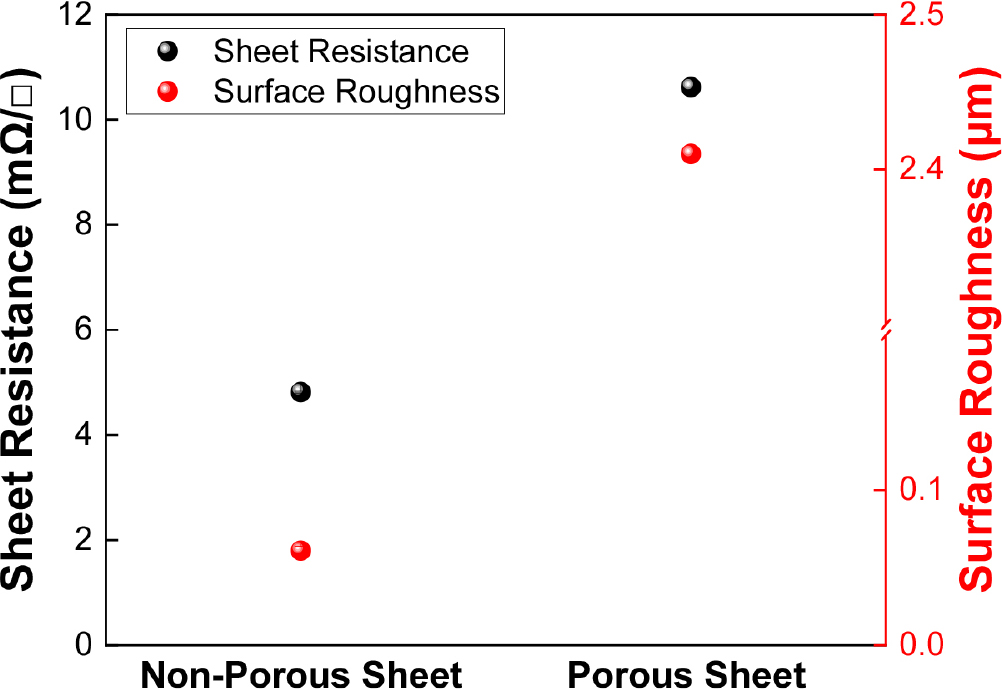
Fig. 4 shows the potentiodynamic polarization curves measured in 0.5 M H2SO4 solution. The porous sheet exhibited a more negative corrosion potential (Ecorr) and a higher corrosion current density (Icorr) than the non-porous sheet. This behavior is considered to be related to the porous structure, in which the high porosity increases the actual reaction area and the number of locally active sites.
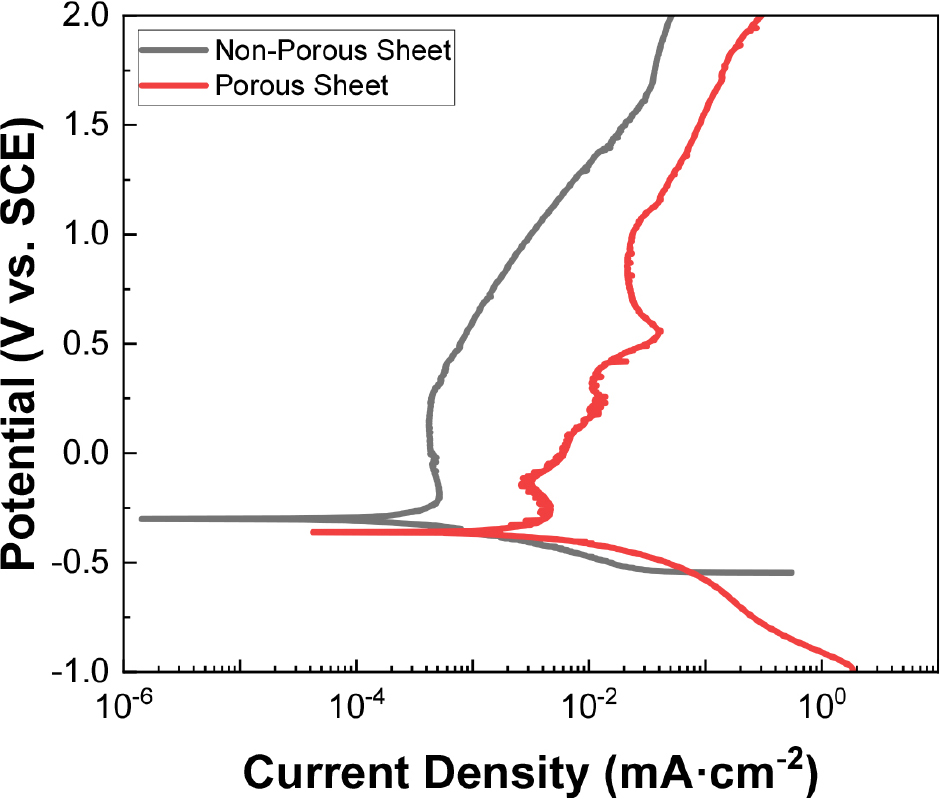
Fig. 5 presents OM images of the surface after polishing them with SiC sandpapers of different grit sizes. At G100, pronounced polishing traces and deep directional scratches were visible. At G1200, the surface became more uniform and smoother. In the non-porous sheet, Ra decreased from 0.798 µm at G100 to 0.246 µm at G1200. In the porous sheet, Ra also decreased, from 2.22 to 1.65 µm, but the values remained higher than those of the non-porous sheet under the same polishing conditions.
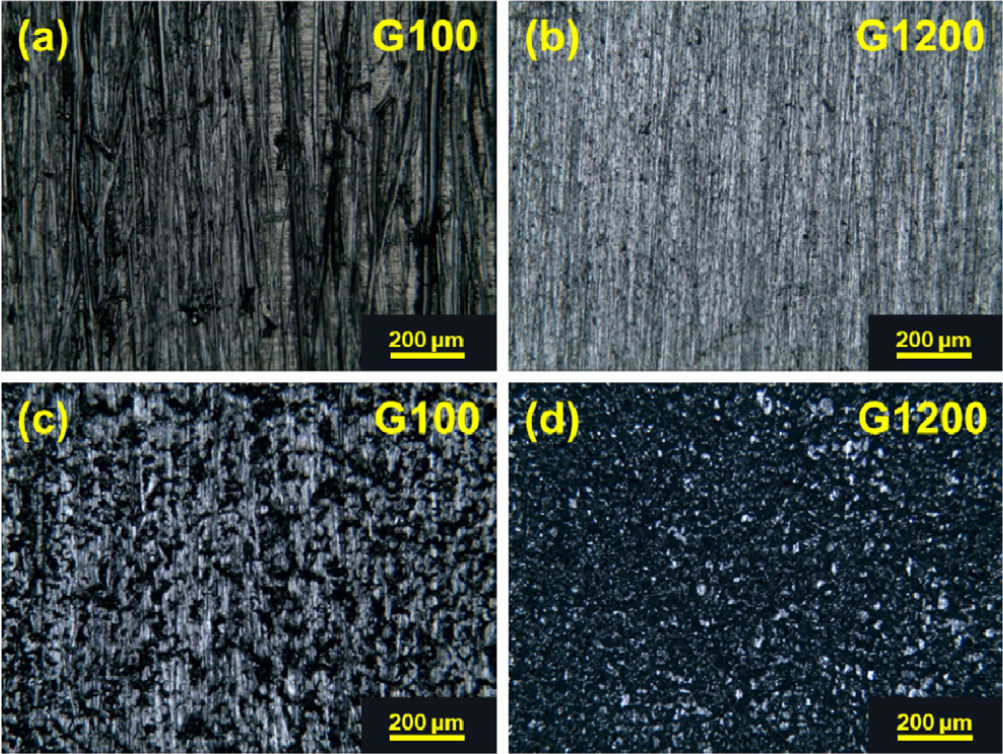
Fig. 6 shows the correlation between surface roughness (Ra) and sheet resistance (Rs). In both sheets, the sheet resistance increased linearly with increasing surface roughness. In particular, the porous sheet exhibited a larger slope than the non-porous sheet, and the slopes of sheet resistance with respect to surface roughness were calculated to be 0.74 and 1.49 mΩ/(□・µm), respectively. This indicates that the same increase in surface roughness leads to a larger change in sheet resistance in the porous structure. The increase in surface roughness is considered to result in the combined effects of increased non-uniformity in the current path and a reduction in the effective conduction area.
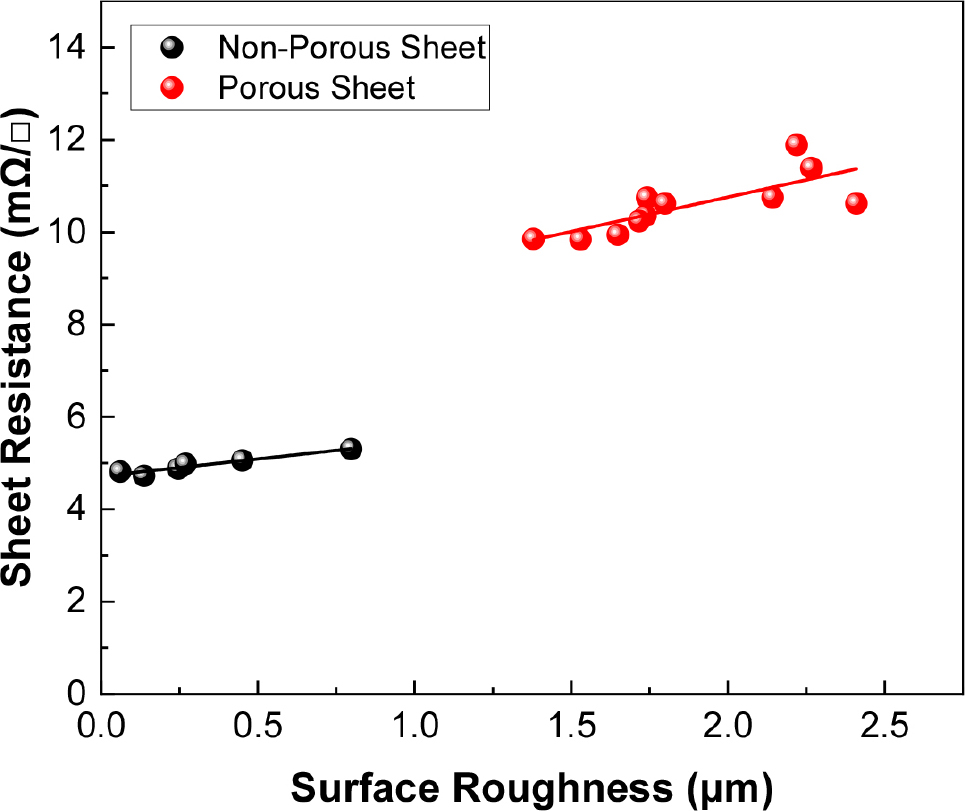
Fig. 7 shows the potentiodynamic polarization behavior of the non-porous and porous sheets polished with G100 and G1200 in 0.5 M H2SO4 solution, and the corresponding electrochemical parameters are summarized in Table 2. In the non-porous sheet, as the surface roughness increased, Ecorr shifted in the negative direction from -0.374 to -0.382 V, and Icorr increased from 0.436 to 0.564 µA・cm-2. Accordingly, the calculated corrosion rate also increased from 0.149 to 0.193 mpy. In the porous sheet, as the surface roughness increased, Ecorr shifted from -0.324 to -0.366 V and Icorr increased from 1.908 to 2.866 µA・cm-2. The corresponding corrosion rate also increased from 0.652 to 0.980 mpy. In both sheets, increasing surface roughness led to a negative shift in Ecorr and an increase in Icorr, and the magnitude of these changes was greater in the porous sheet. This is attributed to the stronger effects of increased actual reaction area and surface defect density in the porous structure. This result is interpreted as being due to the formation of scratches and local defects during polishing, which reduced the continuity of the passive film and increased the number of active reaction sites, thereby accelerating the corrosion reaction. Overall, the increase in surface roughness led to a deterioration in corrosion resistance.
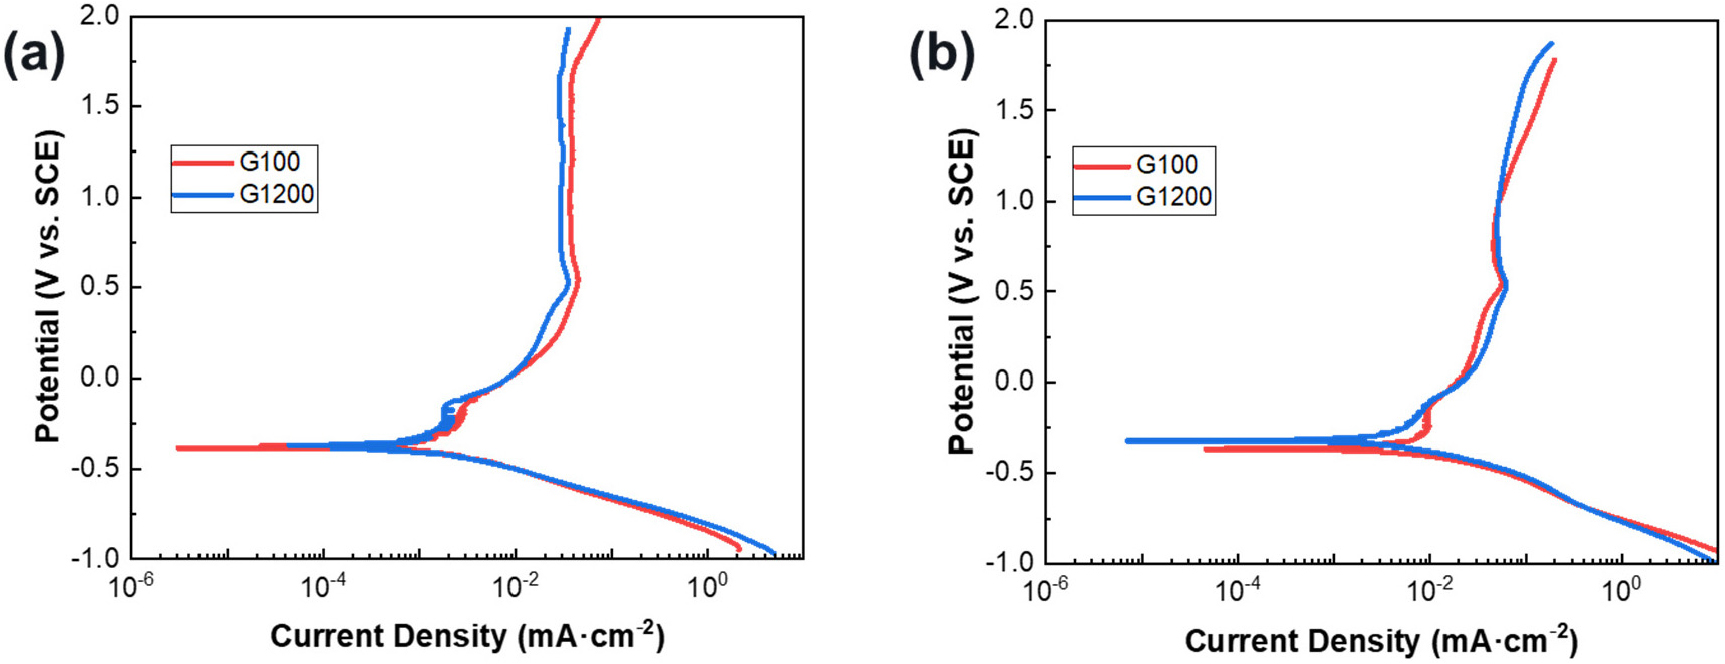
Table 2.
Electrochemical parameters derived from potentiodynamic polarization measurements in 0.5 M H2SO4.
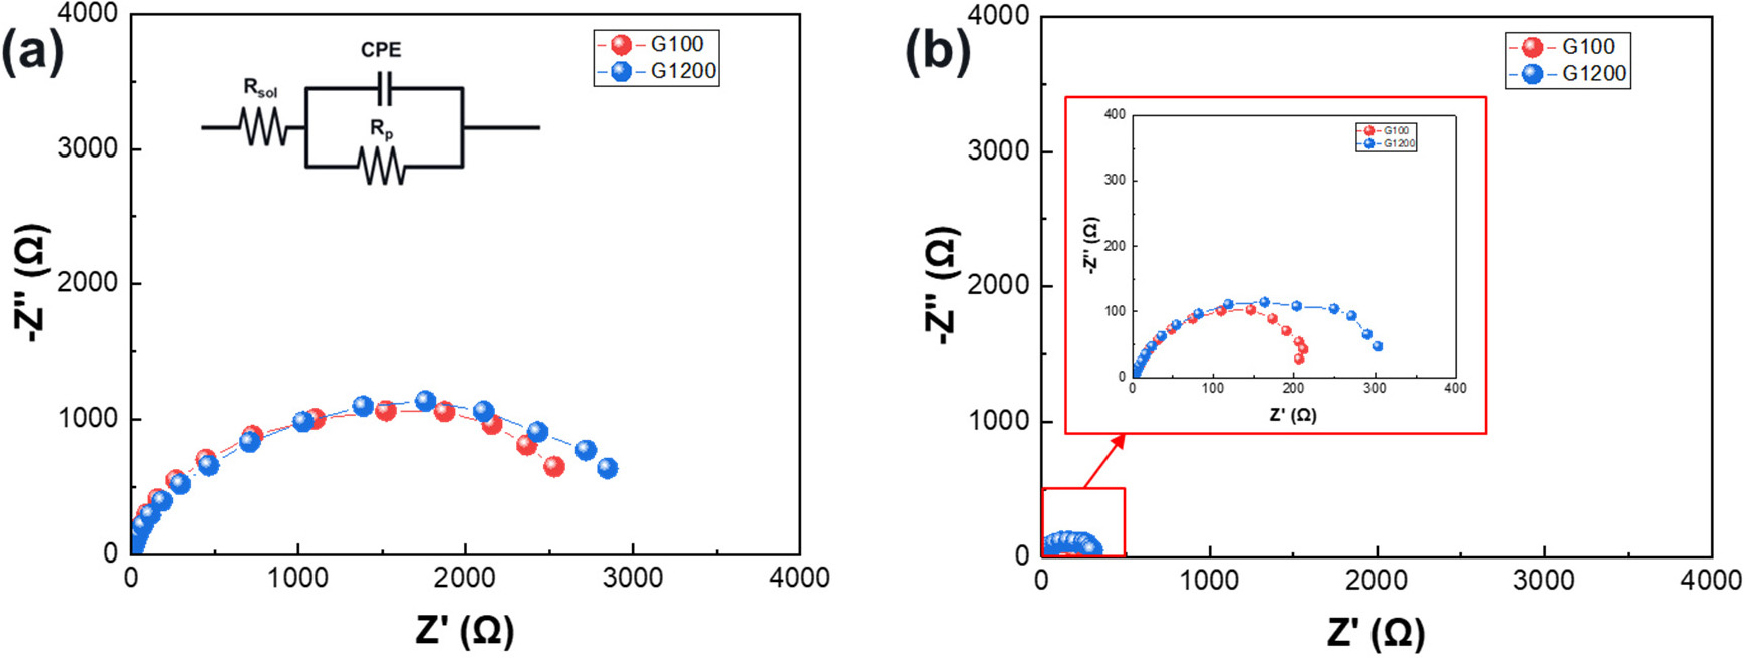
Fig. 8 shows the EIS Nyquist plots of the non-porous and porous sheets measured at the OCP in 0.5 M H2SO4 solution, and the corresponding equivalent circuit parameters obtained from EIS fitting are summarized in Table 3. In both sheets, the semicircle diameter became smaller as the surface changed from the relatively smoother G1200 to the rougher G100 condition, indicating that the polarization resistance (Rp) at the electrode/electrolyte interface decreased. For the non-porous sheet, the Rp values measured under the G1200 and G100 conditions were 2.90 × 10³ and 2.69 × 10³ Ω, respectively, whereas those of the porous sheet were 3.31 × 10² and 2.37 × 10² Ω, respectively. The lower Rp values of the porous sheet are attributed to the porous structure. In both sheets, increasing surface roughness led to a decrease in Rp, and the decrease was more significant in the porous sheet. These results are consistent with the increase in Icorr observed in Fig. 7.
4. Conclusion
In this study, the dependence of the electrical and electrochemical behaviors of non-porous and porous titanium sheets was comparatively investigated.
The porous sheet with a porosity of 36 % exhibited a higher sheet resistance than the non-porous sheet, with values of 10.62 and 4.82 mΩ/□, respectively. In addition, the corrosion potential of the porous sheet was -0.362 V, while that of the non-porous sheet was -0.301 V. The corrosion current density of the porous sheet was 0.812 µA・cm-2, which was higher than the value of 0.117 µA・cm-2 measured for the non-porous sheet, indicating lower corrosion resistance in the porous structure. Under the same polishing conditions, the porous sheet maintained a higher surface roughness than the non-porous sheet. In the non-porous sheet, increasing surface roughness from the G1200 to G100 condition led to a negative shift in corrosion potential from -0.374 to -0.382 V and an increase in corrosion current density from 0.436 to 0.564 µA・cm-2. In the porous sheet, the corrosion potential shifted from -0.324 to -0.366 V and the corrosion current density increased markedly from 1.908 to 2.866 µA・cm-2. The dependence of sheet resistance on surface roughness was stronger in the porous sheet, with slopes of 0.74 and 1.49 mΩ/(□・µm) for the non-porous and porous sheets, respectively. EIS measurements further showed that the polarization resistance decreased from 2.90 × 10³ to 2.69 × 10³ Ω in the non-porous sheet and from 3.31 × 10² to 2.37 × 10² Ω in the porous sheet as the surface roughness increased from G1200 to G100. These results indicate that the electrical and electrochemical properties of titanium sheets show a dependence on surface roughness, and that this dependence is more significant in the porous structure. This suggests that surface roughness control should be considered in future processing and application of porous Ti sheets.
