

1. Introduction
2. Experimental Procedure
3. Results and Discussion
3.1. Study of structural properties
3.2. Energy-dispersive X-ray spectroscopy
3.3. Thermal properties
3.4. Electrical properties
4. Conclusions
1. Introduction
Superconductivity is one of the important phenomena in solid-state physics. It is defined as the phenomenon of the complete absence of electrical resistance and magnetic flux within certain materials when cooled to a low temperature, depending on the type of material.1) The temperature at which resistance disappears is called the critical temperature (critical or transition temperature) and is denoted by Tc.2) Superconductivity exhibits two key properties: its electrical behavior, characterized by the absence of electrical resistance to current, and its magnetic behavior, characterized by the expulsion of magnetic fields. These two properties are the main characteristics of superconducting materials, making them widely applicable. The reason for the loss and waste of a lot of electrical energy, as well as the malfunctioning and overheating of many electrical devices and the resistance to electric current.3) On the other hand, the magnetic field continuously penetrates all ordinary materials without exception. As for superconducting materials, magnetic fields cannot enter the superconductor as long as it remains in its superconducting state. Hence, the significance of this phenomenon and the reliance of many applications on it.4,5)
The primary goal of scientists specializing in the study of superconducting materials is to increase the critical temperature of these materials to room temperature so that they can be used in real-world applications and a variety of devices without the need for extensive cooling. Therefore, at various stages, scientists and researchers have worked to create compounds of various chemical elements, such as those containing yttrium (Y-Ba-Cu-O), lanthanum (La-Ba-Ca-Cu), bismuth (Bi-Ba-Ca-Cu-O), thallium (Tl-Ba-Cu-O), and mercury (Hg-Ba-Ca-Cu-O).6,7,8,9,10)
While others focused on how to produce superconducting materials by partially replacing the components of these compounds, to raise the critical temperature to approach room temperature.11) Also, Pb+2, Sb+2, Cr+2, Ni+2 and Ag+2 can be partially substituted in the sites of bismuth, tellurium, yttrium, and mercury to improve various features of the superconducting compounds.12,13,14) And also, strontium in the barium-based compound, barium in the mercury-based compound, or calcium and copper with other elements.14,15) The composition of Bi-2223 and its superconducting properties are improved by these substitutions.
Bi-Ba-Ca-Cu-O superconductors have special thermal characteristics, especially at low temperatures. Since their thermal conductivity decreases with decreasing temperature, they are typically regarded as weak thermal conductors. Yet, as seen in Y-Ba-Cu-O and La-Sr-Cu-O, this dependency is not necessarily linear. Furthermore, thermal conductivity can be strongly affected by the onset of superconductivity, which can result in a noticeable rise in thermal conductivity close to the transition point.15,16)
Some superconductors also exhibit several interesting thermal properties. Specifically, they have a relatively high critical temperature (Tc), meaning they become superconducting above the boiling point of liquid nitrogen (77 K),17) making them suitable for a variety of applications, including MRI. Additionally, thermal properties, such as thermal expansion coefficients, can be affected by factors such as twin composition and oxygen content.18)
This manuscript includes the preparation, review, and discussion of the results of the structural and surface microstructural properties, as well as the electrical and thermal properties of the superconducting compound with the chemical formula Bi2Ba2Ca2Cu3O10+δ, which was prepared at a sintering temperature of 820 °C and under hydrostatic pressure of 7 MPa.
2. Experimental Procedure
Pure oxides were used to synthesize and produce the Bi2Ba2Ca2Cu3O10+δ compound. Preparation involved using appropriate weights of high-purity oxides (Bi2O3, BaO, CaO, and CuO) relative to their molecular weights (from May & Baker LTD, Dagenham, England, with a purity of 99.998 %). Featuring a 110-gram capacity and a 0.001 readability. The weight of each reactant was measured by using a sensitive balance type (Mettler H35 AR). Samples were prepared using the solid-state reaction (SSR) method, according to the following chemical formula:
The powders were mixed with an agate mortar, then pressed under a pressure of 7 tons for 2 min, resulting in discs with a diameter of 1.5 cm and a thickness ranging from 0.25 to 0.30 cm. The samples were then sintered in the furnace at 820 °C for 70 h at a heating rate of 5 °C/min to obtain the specimens, and subsequently cooled at the same heating rate. The structural properties of the samples were examined using a Shimadzu X-ray diffractometer with the following specifications: CuKα, voltage: 40 kV, current: 30 mA, and wavelength = 1.5406 Å. After obtaining the examination data, the phases formed in the samples and their proportions were identified by identifying 2θ, (hkl) and Intensity in the sample examination and comparing them with their counterparts in the standard examinations. As a result, the resulting phases (Bi 2223) were identified, and computational algorithms were used to calculate the lattice constants a, b, and c, as well as the lattice coefficients per unit cell from the X-ray pattern7) using Bragg’s diffraction law. A scanning electron microscope was used to examine the surface of the samples. According to the concept of electron interaction with matter, this technique can provide images with very high resolution and magnification of up to 100,000 times anywhere on the sample surface. The constituent elements of the compound were also identified using energy-dispersive X-ray spectroscopy (EDS). The resistivity was examined as a function of temperature using the four-probe technique to determine the transition temperature Tc.
3. Results and Discussion
This section addresses the most important scientific findings. The structural properties of the samples were studied using an X-ray diffraction (XRD) device to study the crystal structure of Bi2Ba2Ca2Cu3O10+δ compounds and the extent of the effect of centrifugation on the samples. The composition type of the prepared sample, the proportions of the phases formed, the lattice parameters (a, b, c), the ratio (c/a), and the unit cell density were also determined. The surface microstructure of the samples was also studied using a scanning electron microscope (SEM) to examine the homogeneity of the sample components, the grain distribution, and the grain diameters. Furthermore, the locations of high and low concentrations were identified on the surfaces of samples containing superconducting materials (Bi-2223), noting that superconductivity typically occurs across the surface, not deep within the material. The elemental composition of the samples and their proportions were also analyzed using EDS. To determine the value of the critical temperature of the compound, the electrical properties were studied in the research as a function of the sample temperature. The thermal properties of the samples were also studied by measuring the thermal conductivity. The XRD peaks of the Hg-1223 phase have been used for the estimation of the volume fraction of the phase Vph (The highest superconducting transition phase fraction (HTP%) using the following formula8):
Where Io is the XRD peak intensity of the phase which were determined, I1, I2, In are the intensity peaks of all XRD.
3.1. Study of structural properties
3.1.1. XRD analysis
XRD analysis of the Bi2Ba2Ca2Cu3O10+δ superconducting compound was performed. The study showed that all samples have a regular crystal structure and the presence of two phases: the main high-Tc phase (High-Tc Phase - Bi 2223) and the low-Tc phase (Low-Tc Phase - Bi 2122). In addition, other phases of impurities appeared, as shown in Fig. 1, which illustrates the relationship between the intensity of the peaks and the positions of the angle (2θ). We notice that there is a high intensity for the peaks of the high phase when compared to the intensity of the peaks of the other phases. The preparation method has a role in this, as the method of preparing the samples was the solid-state reaction.19) The longer the time of thermal treatment from sintering and annealing, the closer we get to the single phase of the compound. The change in the percentage of oxygen or the displacement of the atomic structure or the regularity of positive ions, which in turn affects the stacking of atoms along the c-axis, leading to a change in the crystal structure, are all factors that lead to the appearance of different phases in the sample.20,21) XRD data were entered into the (X’Pert High Score Plus) program to extract the Miller coefficients (hkl) and lattice constants (a, b, c). The results showed that the sample has an orthorhombic crystal system. After determining the peaks, their intensity and type in the sample, the phase ratios were calculated, as well as the value of (c/a) and the theoretical density of the unit cell. The results showed relatively acceptable values. The reason for this is the sintering time and temperature, which play a role in providing a longer time and greater energy for the mass-transport, which leads to interference between the molecules, which in turn reduces the molecular distances at the expense of their size. The sintering time is also an important factor, as extending its duration leads to obtaining balanced thermodynamic phases, as well as introducing additional layers of CuO into the structures of the low phases, which gives positive results in the formation of the high phase.22,23) The compound takes a better role in the crystal structure, as shown in Table 1.
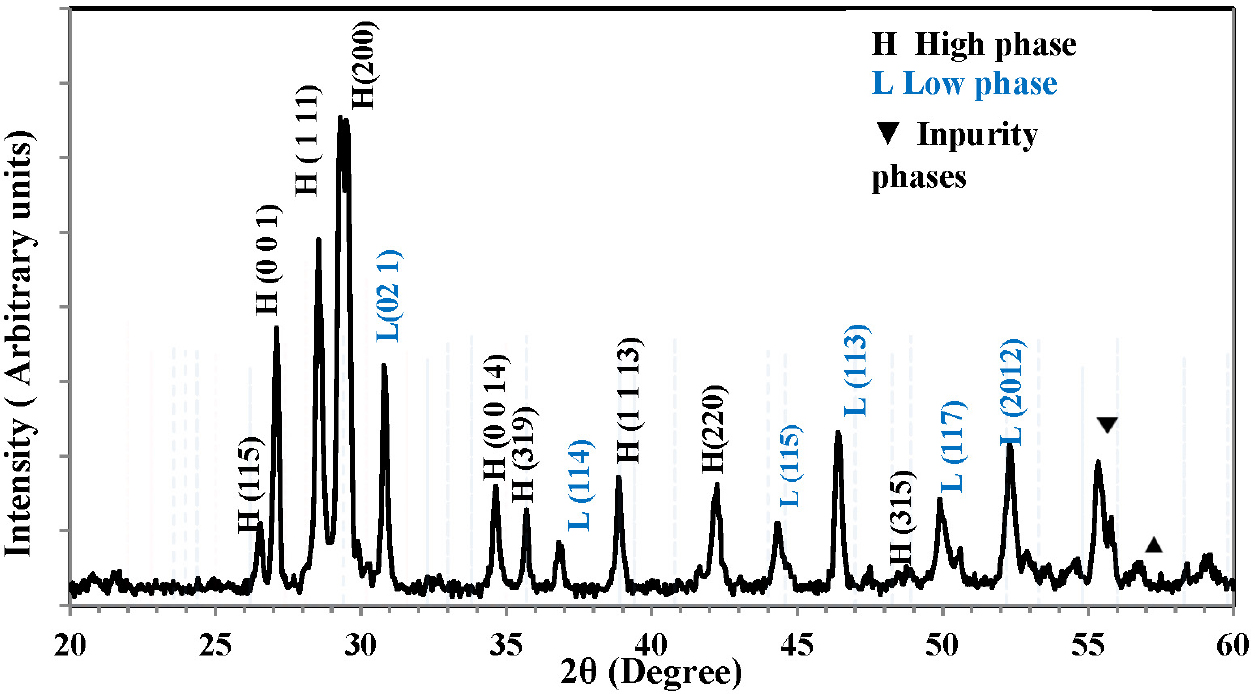
Table 1.
Represents the values of X-ray constants a, b, c, Volume V, c/a, lattice mass W, mass density ρm, and volume fraction of the phase for the Bi2Ba2Ca2Cu3O10+δ compound.
| a (Å) | b (Å) | c (Å) | V (Å3) | c/a | w (g/mole) | ρm (g/cm3) | Vph(2223) % |
| 5.416 | 5.432 | 36.5 | 1073.6 | 6.74 | 1118.55 | 8.65 | 78.76 % |
3.1.2. Crystal size calculation using the Scherrer method
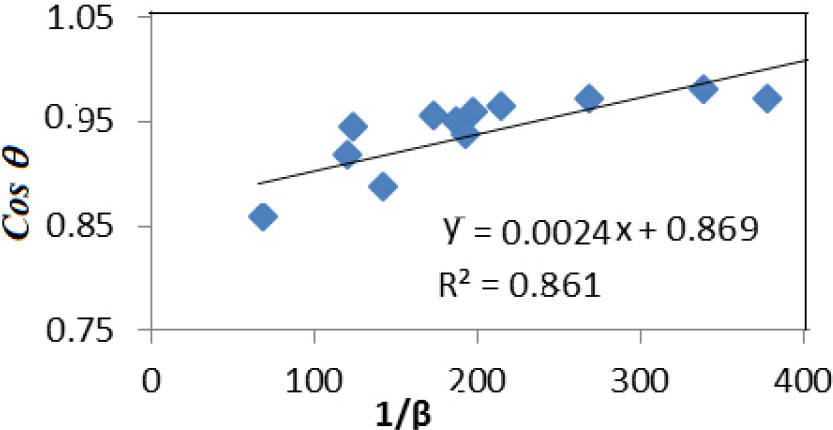
Due to the influence of crystal size and internal strain, the XRD peak is larger in crystals. Therefore, this peak broadening typically consists of two parts: mechanical broadening and physical broadening. To apply the Scherrer method correctly, it is crucial to calculate the exact value of βhkl accurately. Crystal size can be calculated using the following relationship:
Where D is a crystal size, k is a coefficient = 0.9; λ, X-ray wavelength = 1.540598 A; θ is the Bragg angle and βhkl is the corrected broadening. The equation (3) can be rewritten,
The 1/βhkl graph as a function of cosθ for the compound, as shown in Fig. 2, where 1/βhkl represents the X-axis and cosθ represents the Y-axis. From Fig. 2, the slope of the line passing through most of the points was calculated. The crystal size, which is equal to the slope, was calculated, and its value was 61.37 nm.
3.1.3. Study of the surface microstructural properties
The formation and morphology of the superconducting compound were studied through a SEM. Images were taken at a magnification power starting up to (20 KX) where we notice the formation of a grain size with dimensions ranging (86.65 nm) as in Fig. 3, which represents the SEM examination of the sample. Where grain formations up to 24 nm in size were observed. The results also showed through the image the presence of clear homogeneity of the sample, as we notice the presence of bright areas representing wide areas of the surface of the samples, which are the light elements in the compound.24)
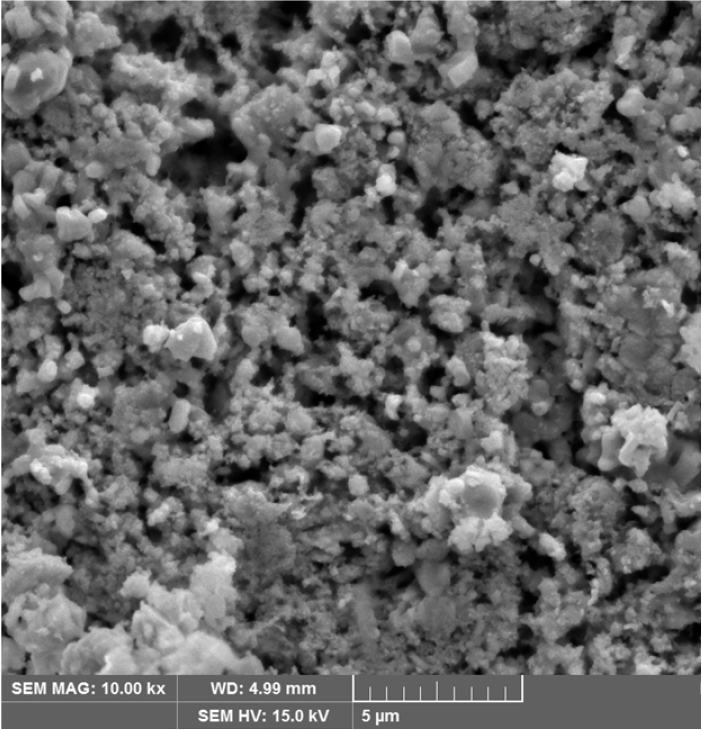
The surface morphologies of the samples are almost identical. Dense, sheet-like grains appear, and smaller grains are distributed in the main matrix. A decrease in grain size and irregular nano-spherical agglomeration are observed on top of the thin sheet-like grain stacks, resulting in greater oxygen loss from the grain surface than from the grain itself. The white particles found between the grains are believed to be nanoparticles. These particles can enhance the bonding between the grains and can increase the anchoring centers for vortex stabilization.25)
3.2. Energy-dispersive X-ray spectroscopy
Quantitative and qualitative analysis is performed through the EDS elemental analysis test to determine the chemical properties of samples. The principle of this test is based on X-rays (resulting from the interaction of charged particles with a beam of electrons incident on the sample material, which helps determine the composition of the sample). Because each element has a distinct atomic composition, a set of distinct peaks will form in the X-ray spectrum. X-rays are obtained through the initial excitation of atoms. This occurs by expelling a beam of electrons, as occurs in a scanning electron microscope. This results in the emission of an electron from the inner atomic orbital, and a process of excitation and destabilization occurs due to the electron vacancy, leading to the filling of vacancies in the higher atomic orbitals. When electrons move from the higher atomic orbitals to the lower atomic orbitals, they emit X-rays with an energy equivalent to the energy difference between the atomic orbitals. This emitted energy radiation is considered a distinctive identity for each chemical element. Each element has several permitted transitions between atomic orbitals, depending on the atomic orbital of the electron that created the vacancy and the atomic orbital of the electron that filled it.25) These transitions, or paths (lines), are described as quantum transitions and are symbolized by the symbols Kα, Kβ, Lα, etc. The detector measures the energy of the X-ray photons produced when the detector absorbs the photon within the sensitive region.26) This produces an equal number of electrons, which are amplified afterwards to create a quantitative standard that employs an indicator to provide a value that appears on the x-axis in the subsequent spectrum as an energy value.27)
The EDS of the samples was examined and the results showed complete agreement between the composition of the sample of different elements and the EDS test, as shown in Fig. 4 and Table 2 of the EDS as well as the table of percentages, weights and atomic numbers of the elements of each sample, as the results of the EDS test of the sample showed the presence of the elements that make up the compound in proportions almost identical to the practical proportions that were used in the sample preparation process.
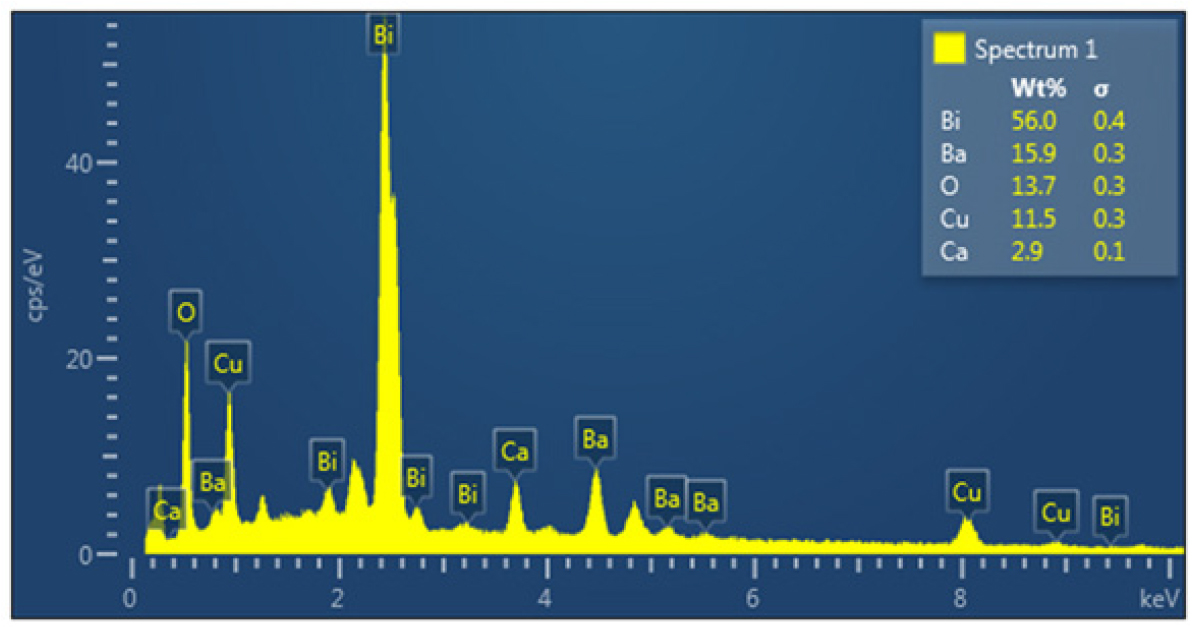
Table 2.
Represents the values of Quantitative and qualitative for the Bi2Ba2Ca2Cu3O10+δ compound.
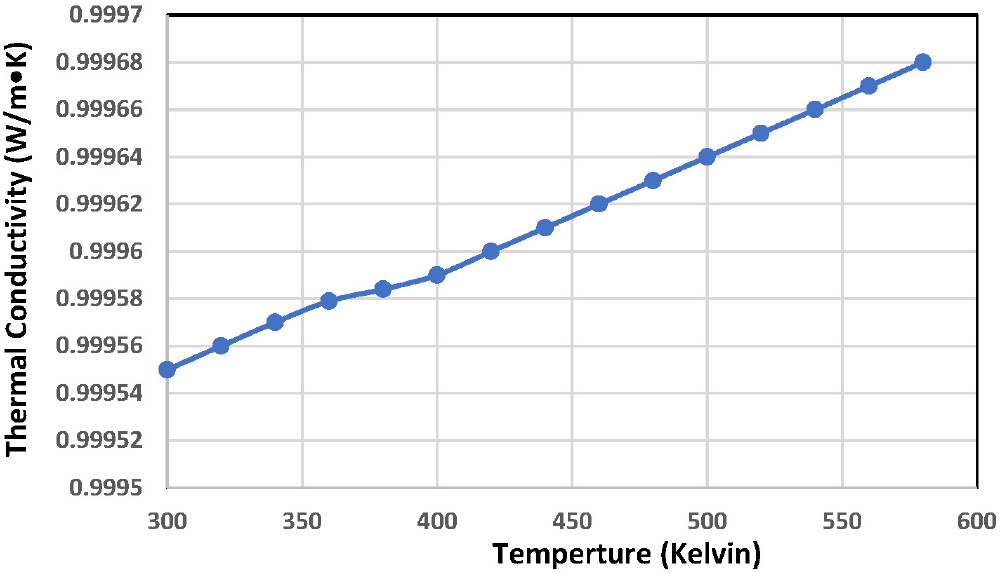
3.3. Thermal properties
The thermal properties of the Bi2Ba2Ca2Cu3O10+δ compound were studied, where the sample’s thermal conductivity was measured using Lee’s disk device. Fig. 5 shows the thermal conductivity as a function of temperature for the compound. The results showed that the sample’s thermal conductivity increases with increasing temperature in a quasi-linear manner, which indicates the presence of continuous bonding between the atoms that make up the superconducting compound.28) Thermal conductivity also depends on lattice vibration due to phonon energy. The higher the phonon energy, the greater the lattice vibration, leading to increased thermal conductivity. This behavior is influenced by the quality and quantity of the chemical elements present in the sample, the way the atoms interact with each other, the structure of the material, its chemical composition, and the type of bond between them. This is confirmed by EDS, SEM, and XRD results. The higher the thermal conductivity of the compound, the more perfect the crystal structure, the greater the presence of metallic impurities, and the greater the susceptibility of the crystal lattice to deformation. This deformation in the metallic structure also affects thermal conductivity, which gradually increases with increasing temperature.29,30)
3.4. Electrical properties
One of the main and important properties of superconducting materials is the Tc, which is the temperature at which the material’s resistance is almost zero. Therefore, the electrical resistance of this compound was measured using a four-probe array. The process of electron pairing (Cooper pairs) results in the superconducting transition. Reaching the critical temperature at the onset of collapse weakens the interaction between the CuO layers and the other elements in the compound along the c-axis. This is due to the process of electron pairs being tunneled through the two-dimensional CuO layers, which is supposed to be sufficient to create an electron density.31) These phonon pairs must be low and within the two-dimensional dimension, and the energy gap must be small. The generation of coupling and the appearance of pairs of superconducting holes related to bosons, which are the source of carrier current in superconducting materials, requires a driving force that is generated as a result of the change in the length of the (c) axis, which in turn affects the charge carriers between the levels, which results from partial compensation.32)
The electrical properties of the superconducting compound were studied by measuring the electrical resistivity as a function of absolute temperature. At zero magnetic field, over a temperature range of 300 K to 100 K, the superconducting compound is shown in Fig. 6. It can be seen from the figure that the electrical resistivity gradually decreases until it reaches 131 K. This temperature is called the initial transition temperature Tc(onset), at which the material transforms from the normal state to the superconducting state (superconducting transition state). The electrical resistivity behavior of Bi2Ba2Ca2Cu3O10+δ exhibits a slight deviation from the linear behavior, as described by Wilson’s theory.33) However, the high value of the absolute resistivity with a saturated direction is related to the type of compound, the other elements in its composition, and the percentage of the high phase compared to the other phases.34) The critical temperature values were determined by measuring the electrical resistivity with temperature. It was defined the critical temperature was defined as the temperature of the compound when its electrical resistivity drops to the middle of the distance between the beginning of the drop (Tc(onset)) and its end (Tc(offset)). It is also noted from this figure that the electrical resistance after the transition temperature Tc(onset) continued to decrease sharply until it reached 114 Kelvin. This temperature is called the zero-transition temperature Tc(offset), where the electrical resistance collapses and becomes zero. The difference between the transition temperatures Tc(onset) and Tc(offset) is (∆ Tc) equal to 17 K. This difference between the two temperatures is a result of the regularity of the atoms that make up the superconducting compound, as confirmed by the results of structural tests.
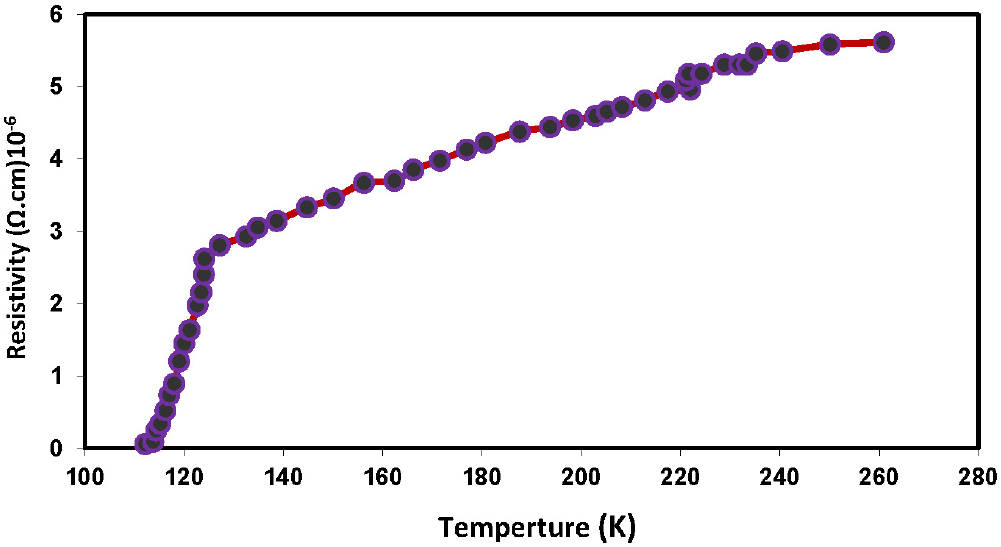
The results of this study are consistent with those of previous studies, which showed15,25,35) that the critical temperature of the Bi2Ba2Ca2Cu3O10+δ compound ranged between 98-115 K, and that the width of the transition zone ranged between approximately 12-32 K for the prepared samples.36,37) The extent of the transition is strongly related to the nature of the material’s composition, and the value of the transition range can be considered an indicator of the crystal structure approaching the ideal.16,17,18) This is evidence of the material’s purity, as confirmed by the results of elemental tests of the compound, which were examined using an EDS device. The extent of the transition (or the rate of decline in the electrical resistance value of these samples) was significantly better than that of polycrystalline compounds with superconductivity.38)
4. Conclusions
The structural characteristics of the Bi2Ba2Ca2Cu3O10+δ superconducting compound were examined in this publication. The sample underwent XRD, SEM, and elemental analysis using EDS. The sample features a rhombohedral crystal structure with changes in the lattice constants (a, b, and c), as determined by the XRD data. 78.76 % was the highest phase fraction (HTP).
In terms of the sample’s morphology, nanoscale grains with sizes approaching 86.65 nm were observed in images taken at 20 kX. Elemental analysis revealed that the sample contains bismuth, barium, calcium, copper, and oxygen in varying quantities consistent with the weights of the mixed elements that make up the sample. It was discovered that the resistance of the sample decreases with increasing temperature, i.e., it behaves like a metal, then drops to zero at a critical temperature of 114 K. As for measuring the thermal conductivity, it was found that it increases with increasing temperature.
