

1. Introduction
Porous ceramics is a new type of ceramic material, sintering at high temperature with a large number of interconnected or closed pores in the body. It not only has high porosity, large specific surface area and small density, but also has high temperature resistance, corrosion resistance and good chemical stability. It is widely used in petrochemical,1) metallurgy,2,3) aerospace,4) biomedicine5) and so on. Up to now, many methods have been applied to prepare porous ceramics, such as foaming,6) gel injection molding,7) organic foam impregnation,8-10) freeze drying,11-12) 3D printing13-14) and so on.
Porous mullite-corundum ceramics has excellent physical and chemical properties, such as low thermal expansion coefficient, good creep resistance and thermal shock resistance.15,16) In addition, because of the existence of corundum phase, the lack of poor mechanical properties of porous mullite ceramics at room temperature is improved. Therefore, porous mullite-corundum multiphase ceramics are a kind of broad development prospect. However, most of the current studies focus on the density of alumina-mullite composites,17-20) or on the properties of single-phase porous mullite or alumina ceramics. Singlephase porous ceramics are always faced with some problems, such as lower strength with higher porosity,21-24) and lower porosity with higher strength.25-27) Hongyu Cai et al.21) has prepared porous mullite ceramics with over 80 % porosity using SiC and Al2O3 as the main raw materials, but their compressive strength was only between 1.5 to 3.0 MPa. Na Xu et al.22) has prepared mullite porous ceramics with 56.4 % open porosity and 4.7 MPa compressive strength by using foaming-casting process. Muhammad et al.,25) using kaolin as raw material and corn starch as pore-forming agent, has prepared mullite ceramics with high compressive strength as high as 20- 80 MPa, but its porosity is very low (13.14 %-41.63 %). Therefore, it is necessary to study mullite-corundum ceramic with high porosity and sufficient strength.
In this work, porous mullite-corundum ceramics were prepared by organic foam impregnation method with alumina and silica as the main raw materials, in order to achieve the requirements of high porosity and sufficient strength. The influence of pretreatment technology on foam polyurethane was discussed, and the effect of sintering process and material composition on the phase composition, microstructure and property of mullitecorundum ceramics were also studied.
2. Experimental Procedure
2.1. Raw materials
Foam polyurethane (open porosity is 99 %), alumina (D50 = 10 mm) and silicon dioxide (D50 = 20 mm) were chosen as main raw material. The reagents used such as sodium hydroxide (NaOH), sodium dodecyl sulfate (SDS), polyvinyl alcohol (PVA), polyethylene glycol (PEG), are analytically pure.
2.2. Pretreatment of foam polyurethane
The foam polyurethane was placed in different NaOH solution for treatment at the set temperature, and then the treated polyurethane foam was placed in SDS solution at 75 ° for 2 h. Finally, the treated polyurethane foam was dried in an oven.
2.3. Preparation of porous mullite-corundum ceramics
Alumina, silica, polyethylene and ammonium citrate were mixed evenly in a certain proportion to prepare a mixed slurry with the solid content of 50 %. Subsequently, the pretreated foam polyurethane was dipped into the mixture. After 3 to 5 min, the foam polyurethane was removed and the excess slurry was extruded. Then the samples were solidified at room temperature for 24 h and dried at 120 °C for 12 h. After drying, the samples were sintered at the predetermined temperature, and finally cooled to room temperature with the furnace.
2.4. Characterization
The quality of the original foam polyurethane is called the M1 with the accuracy of 0.0001 g analytical balance. The foam polyurethane treated by alkali is dried and recorded as M2. The foam polyurethane impregnated with ceramic slurry is weighed and recorded as M3. The length, width and height of the original foam polyurethane are measured by vernier caliper with accuracy of 0.02 mm, and the volume is calculated as V. The mass loss before and after alkali liquor treatment is expressed by hydrolysis rate (H); The slurry volume of the foam polyurethane was characterized by the hang pulp quantity per unit volume (Q, g/cm3).
The phases of samples were determined by X-ray diffractometer (XRD, Rigaku) using Cu Ka radiation at tube voltage 40 KV, tube current 30 mA and a scanning speed 2 o/min with scanning range from 10° to 80°. According to the XRD results, the relative content of phase was calculated by k-value method.28) The microstructures of the samples sections were characterized by scanning electron microscope (SEM, SU8020, Hitachi); Fourier transform infrared spectroscopy (FT-IR, Nicolet 6700, ThermoFisher) was used to analyze the changes of functional groups of foam polyurethane before and after treated. The open porosity of fired samples was measured by using Archimedes method. The compressive strength of the samples was tested by compression testing device typed JBC-LY.
3. Results and Discussion
3.1. Pretreatment of foam polyurethane
3.1.1. Influence of alkali treatment on foam polyurethane
Fig. 1(a) shows the NaOH concentration influence on foam polyurethane at room temperature, revealing that the hydrolysis rate and hang pulp quantity of foam polyurethane is increased with the improvement of NaOH concentration. This is because that, the combination of ceramic slurry and polyurethane foam belong to physical combination. The factors affecting the hang pulp quantity are the hydrolysis rate of foam polyurethane, the solid content of slurry and the impregnation time. From the perspective of molecular structure,29) the foam polyurethane molecules contain -NHCOO- duplicated structural units, where the hydrolysis of ester and urea can produce H+. The higher the concentration of NaOH, the higher the hydrolysis rate of the foam polyurethane. This means that the greater the degree of corrosion of the foam polyurethane, the more roughly skeleton of foam polyurethane is. Then slurry is easy to adsorb on the surface of foam polyurethane. The hang pulp quantity of foam polyurethane is increased.
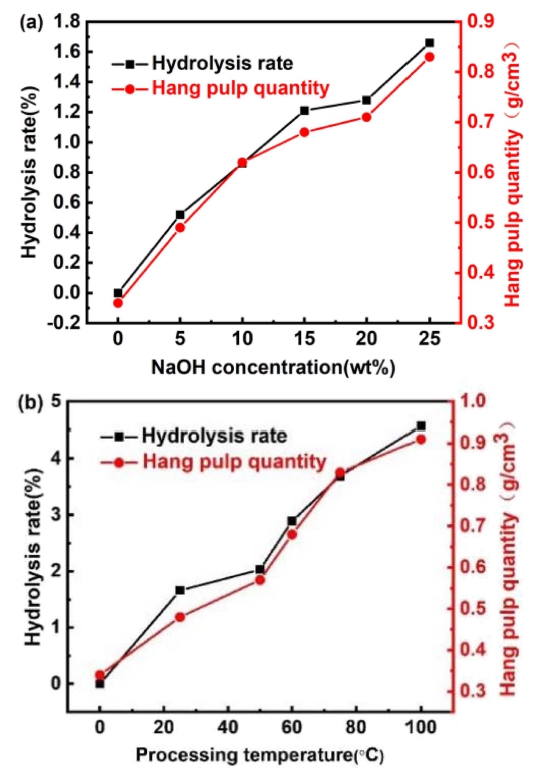
Fig. 1
Influence of alkali treatment on foam polyurethane: (a) NaOH concentration and (b) NaOH solution temperature.
Fig. 1(b) shows the effect of solution temperature on foam polyurethane in 25 wt% NaOH solution. It reveals that the hydrolysis rate and hang pulp quantity of foam polyurethane is improved with enhancing of solution temperature. With the rise of solution temperature, the molecular motion accelerates. So the hydrolysis rate and hang pulp quantity of foam polyurethane are increased.
To study the effect of temperature on functional groups of foam polyurethane the FT-IR spectrum of polyurethane sponge treated with 25 wt% NaOH solution at different temperatures was determined in Fig. 2. It can be seen that, alkaline treatment almost had no effect on the functional groups of foam polyurethane. The absorption peaks of polyurethane sponge before and after treatment are all at 1,082 cm-1, 1,288 cm-1, 1,539 cm-1, 2,866 cm-1, which show a characteristic FT-IR spectrum of polyurethane sponge (-NH-CO-NH-[CH2]n-NH-CO-NH-). And these absorption peaks on behalf of the stretching vibration of C-O, the stretching vibration of C-N, the antisymmetric contraction vibration of COO-, the stretching vibration of -CH2-, the stretching vibration of N-H, respectively. Thus, this indicates that alkali treatment does not destroy the functional groups of polyurethane foam molecules, but only changes the surface roughness of polyurethane foam.29)
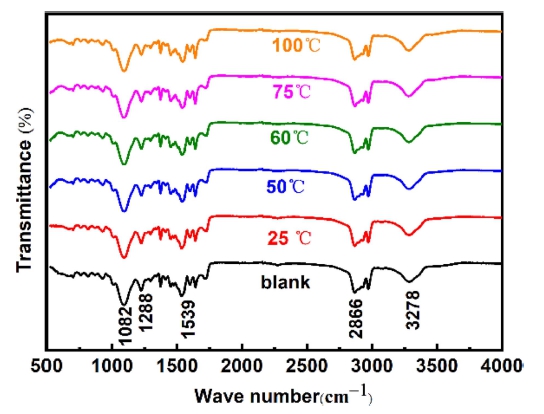
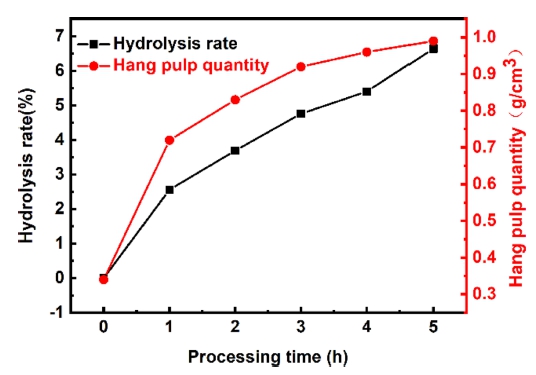
Fig. 3 shows the effect of treatment time on foam polyurethane with 25 wt% NaOH solution at 75 °C. It can be seen that, the hydrolysis rate and hang pulp quantity of foam polyurethane increase with the prolongation of treating time. This is because when the concentration of NaOH is constant, the longer the treatment time, the more complete the reaction, in other words, the greater the hydrolysis rate and the higher the hang pulp quantity.
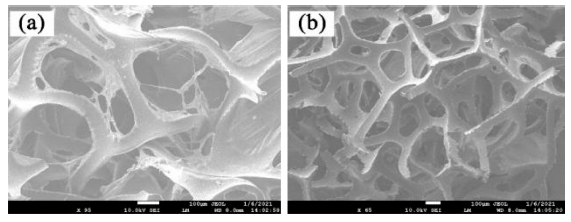
SEM micrographs of original foam polyurethane and foam polyurethane treated with 25 wt% NaOH solution at 75 °C for 3 h treatment is showed in Fig. 4. As show Fig. 4(a), obvious internetwork membrane of foam polyurethane is clearly observed. In Fig. 4(b) the internetwork membrane of foam polyurethane has completely disappeared. This will help to improve the hang pulp quantity of polyurethane foam.
3.1.2. Effect of surface modification on polyurethane foam
The compatibility and adhesion of foamed polyurethane and ceramic slurry are poor, resulting in low hang pulp quantity and poor performance of porous ceramics after sintering. Therefore, the surface modification of polyurethane foam is carried out to adsorb a layer of hydrophilic material on the surface and improve the slurry suspension ability of ceramic slurry.
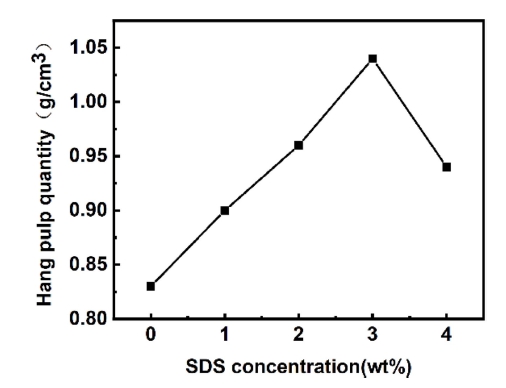
Fig. 5 presents the hang pulp quantity of foam polyurethane after SDS solution concentration treatment. It can be observed that, with the improvement of SDS concentration, the hang pulp quantity of foam polyurethane increased first and then decline. The phenomenon in Fig. 5 could be explained as follows: during the impregnation process, the hydrophobic -C12H25 of SDS is facing the foam surface, and the hydrophilic -SO3Na is oriented towards the slurry to form a directional adsorption arrangement, which greatly reduces the surface tension and can adsorb more slurry. However, when the concentration of SDS rises further, the adsorption of SDS on the surface of the polyurethane foam is saturated, resulting in the excess hydrophobic group being oriented toward the slurry, and the hydrophilicity becomes worse, resulting in the decrease of the amount of polyurethane foam.29)
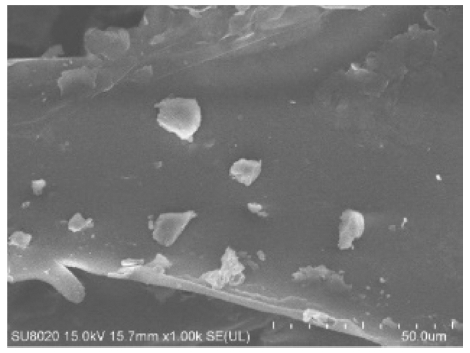
SEM micrographs of foam polyurethane treated for 2 h in 3 wt% SDS solution is show in Fig. 6. It can be seen that, there are many small particles attached to the surface of foam polyurethane treated with SDS solution. These small particles are SDS with good hydrophilicity, which can significantly improve the amount of hanging slurry of foam polyurethane.30)
3.2. Structural analysis of porous mullite-corundum ceramics
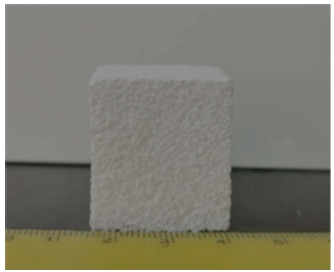
Fig. 7 presents the macro picture of sample. It can be observed that, the sample has many visible pores. The size of these pores is comparable to that of the foam polyurethane. In fact, the pores of sintered samples including macro pores and micropores on the pore wall. Among them, the size of macropores is related to the pore size and hang pulp quantity of foam polyurethane. The size of micropores on the pore wall is related to the sintering process and the composition of raw materials.
3.2.1. Effect of sintering temperature on the structure of porous mullite-corundum ceramics
Fig. 8 shows the XRD pattern and mullite relative content of samples with m(Al2O3/SiO2) is 2.5 fired at different sintering temperature for 2 h. As show in Fig. 8(a), at 1,300 °C, the quartz phase and corundum phase are detected. The intensity of the diffraction peaks of quartz gradually decreases, and the cristobalite phase is detected fired at 1,400 °C, it states that some of the quartz has been transformed into cristobalite. The intensity of the diffraction peaks of quartz and corundum gradually decreased, characteristic peaks of mullite were observed fired at 1,450 °C, which indicates that formation temperature of mullite is 1,450 °C. The intensity of mullite diffraction peaks gradually enhances with the elevation of sintering temperature. In conclusion, it shows that the sintering temperature can change the crystalline phase composition of the samples. As show in Fig. 8(b), the relative content of mullite increases with the elevation of sintering temperature. When the sintering temperature is 1,600 °C, the relative content of mullite is 78.92 %.
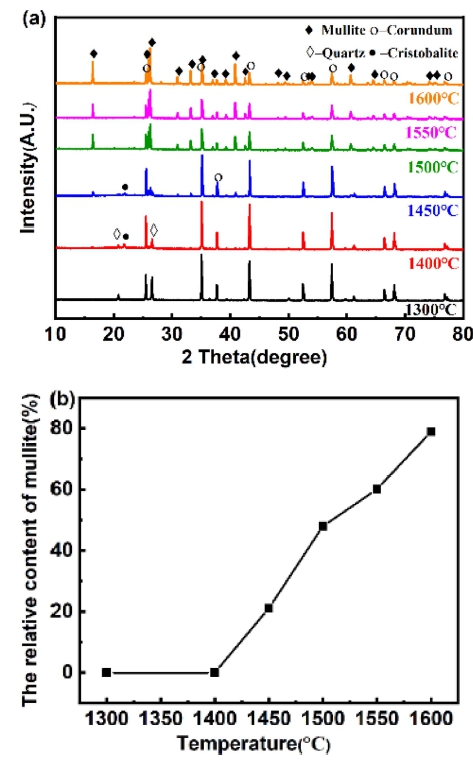
Fig. 8
Phase analysis of samples at different sintering temperatures: (a) XRD patterns and (b) mullite relative content.
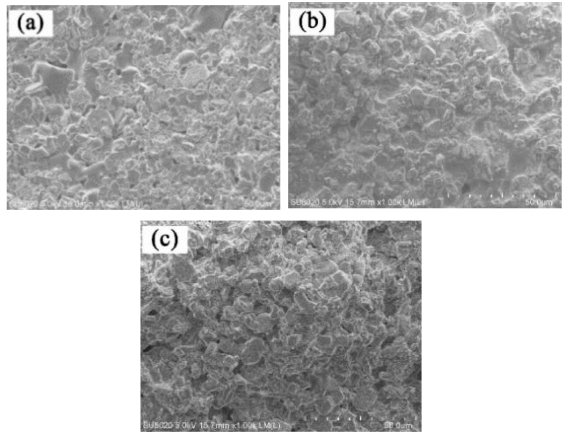
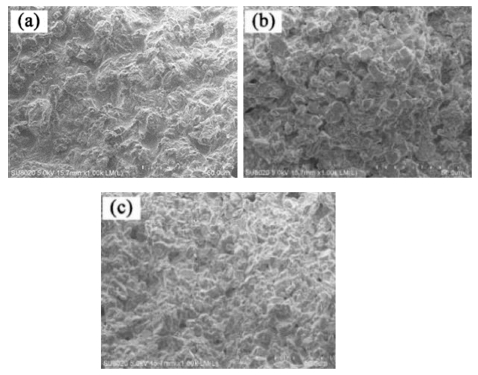
Fig. 9 presents the SEM micrographs of samples with m(Al2O3/SiO2) is 2.5 fired at different sintering temperature for 2 h. It can be observed that, with the elevation of sintering temperature, the particles are more closely arranged and the porosity decreases gradually. For the sample fired at 1,300 °C [Fig. 9(a)], particles of different sizes are clearly observed. There are many large particles with smooth surfaces. For the samples fired at 1,450 °C [Fig. 9(b)], the number of large particles decreased significantly and many small particles appeared, which was due to the formation of mullite. With further enhancing the sintering temperature [Fig. 9(c)], the number of small particles continues to grow and tends to be homogenized.
3.2.2. Effect of holding time on the structure of porous mullite-corundum ceramics
Fig. 10 shows the XRD pattern and mullite relative content of the samples fired at 1,600 °C when m(Al2O3/ SiO2) is 2.5. As show in Fig. 10(a), for all sample, only mullite phase and corundum phase is clearly observed, which indicates that holding time is not change the crystalline phase composition of the sample. As show in Fig. 10(b), with the extension of holding time, the relative content of mullite increases gradually. But the increase of mullite tends to be gentle when holding for 3 to 5 h. This phenomenon in Fig. 10 can be explained that, with the extension of holding time, more mullite is generated, and the newly formed mullite grains continue to grow to replace the silica and alumina parts. The mullite layer becomes thicker, and the diffusion distance of Al3+ and Si4+ becomes longer. This hinders the diffusion of ions. Therefore, the generation rate of mullite becomes slower.
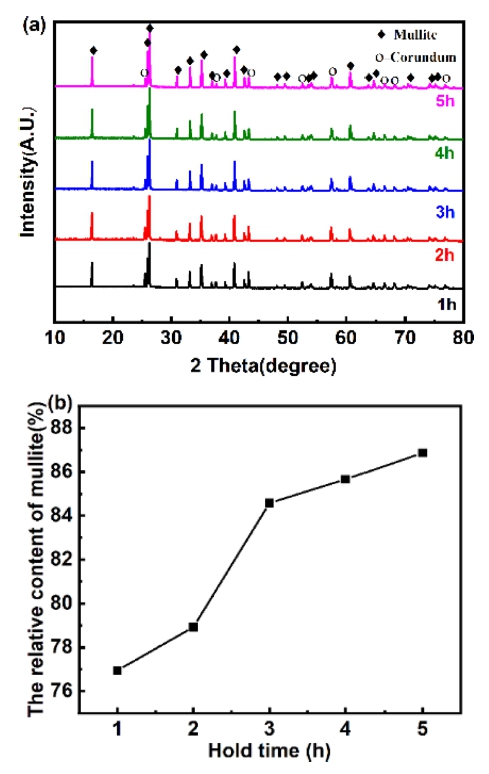
Fig. 10
Phase analysis of samples at different holding times: (a) XRD patterns and (b) Mullite relative content.
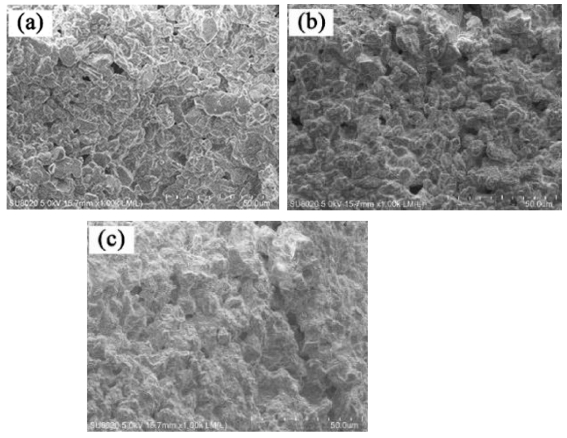
Fig. 11 presents the SEM micrographs of samples with m(Al2O3/SiO2) is 2.5 fired at 1,600 °C for different holding time. It can be observed that with the extension of holding time, the accumulation between particles becomes closer and closer, and the porosity becomes smaller and smaller.
3.2.3. Effect of raw material composition on structure of porous mullite-corundum ceramics
Fig. 12 shows the XRD pattern and mullite relative content of the samples with different m(Al2O3/SiO2) fired at 1,600 °C for 2 h. As show in Fig. 12(a), for all samples, only mullite phase and corundum phase are clearly observed, which indicates that holding time is not change the crystalline phase composition of the sample. And the intensity of mullite diffraction peaks is the strongest when m(Al2O3/SiO2) is 2.5, which is also proved in Fig. 12(b). As show in Fig. 12(a), With the rise of m(Al2O3/ SiO2), the relative content of mullite firstly rise and then decreases. When m(Al2O3/SiO2) is 2.5, the relative content of mullite is the highest (78.92 %). As m(Al2O3/ SiO2) is gradually rising, the quartz content is decreasing. On the one hand, the liquid content is reducing, which is not conducive to the diffusion and migration of substances. On the other hand, the content of quartz transformed into cristobalite is also decreasing, which will lead to the reduction of mullite production.
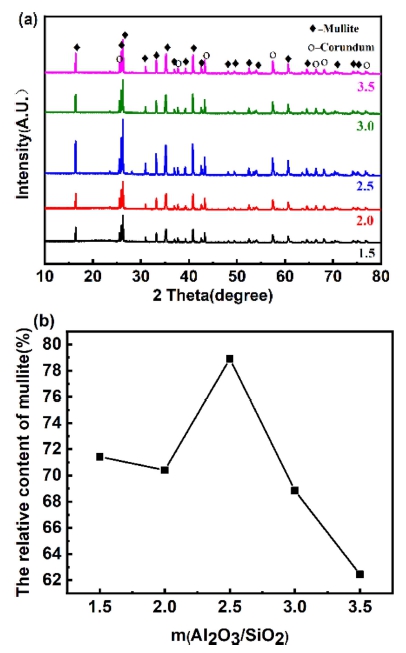
Fig. 12
Phase analysis of samples with different composition of raw materials: (a) XRD patterns and (b) Mullite relative content.
Fig. 13 presents the SEM micrographs of samples with different m(Al2O3/SiO2) fired at 1,600 °C for 2 h. It can be observed that, when m(Al2O3/SiO2) is low or high, the size and quantity of massive mullite in the sample are small. When m(Al2O3/SiO2) is 2.5, massive mullite phases in the sample are completely crystallized, with large size, large quantity and many pores.
3.3. Physical properties of porous mullite-corundum ceramics
3.3.1. Effect of sintering temperature on physical properties of porous mullite-corundum multiphase ceramics
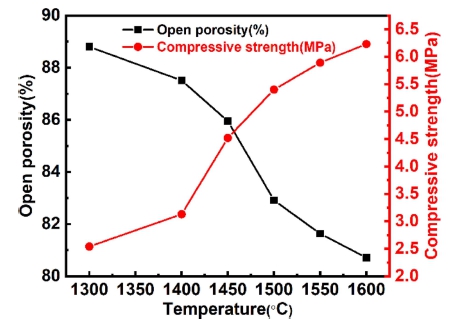
Fig. 14 shows the physical properties of the sample sintered for 2 h at different temperatures when m(Al2O3/ SiO2) is 2.5. It can be seen that, the open porosity of samples decreases with sintering temperature elevates. With the elevation of sintering temperature, the activation energy of molecular motion decreases and the material transport increases in the sintering process. At the same time, due to the adhesion between the particles, the particles are quickly tightened, gathered and rearranged, resulting in the high shrinkage of the samples and the decrease of the open porosity of the samples. The compressive strength of samples improves with elevation of sintering temperature. This is related to the reduction of porosity. In addition, with the of elevation the sintering temperatures, the amount of mullite becomes more, and the strength of mullite is higher than that of silica.
3.3.2. Effect of holding time on physical properties of porous mullite-corundum ceramics
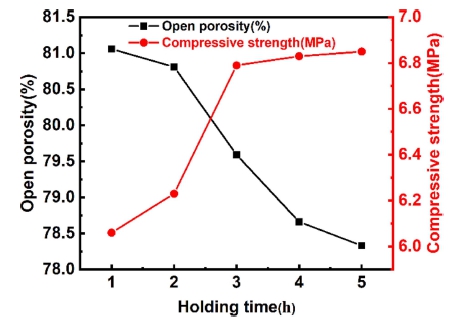
Fig. 15 displays the physical properties of samples with m(Al2O3/SiO2) is 2.5 fired at 1,600 °C for different holding time. It can be observed that with the extension of holding time, the number of open porosity is gradually decreasing, and the compressive strength of the sample is gradually improving. After the holding time exceeds 3 h, the increasing trend of compression strength slows down. This is because with the extension of holding time, the change of physical and chemical reaction tends to be complete, and the organizational structure tends to be uniform. Therefore, when the sintering temperature is maintained for a certain time, the reaction will be very slow.
3.3.3. Effect of raw material composition on physical properties of porous mullite-corundum ceramics
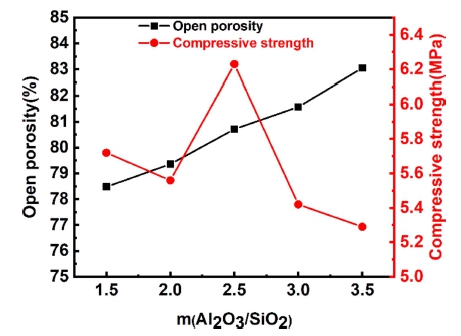
Fig. 16 shows the physical properties of samples with different m(Al2O3/SiO2) fired at 1,600 °C for 2 h. Visibly, as the growth of m(Al2O3/SiO2), the variation tendency of open porosity is increasing, and the compressive strength of the sample generally pretends a downward trend. This is consistent with Huang31) conclusion. However, when m(Al2O3/SiO2) is 2.5, the compressive strength of the samples grows to the maximum value of 6.23 MPa, which the open porosity of the sample is 80.7 %. The most likely reasons are as follow. With the growth of m (Al2O3/ SiO2), the SiO2 content reduces relatively, the viscous glass formed on the surface declines, and the ability to fill the pores between particles decreases. On the other hand, the conversion of cristobalite is also reduced, and the generation of mullite is reduced, which reduces the densification degree of the samples. Therefore, the open porosity is improved. However, when m(Al2O3/SiO2) is 2.5, it is close to the stoichiometric ratio of mullite, so the amount of mullite is the highest, the compressive strength of the sample reaches the maximum.
3.3. Sintering mechanism of porous mullite-corundum ceramics
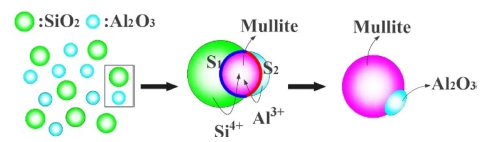
Fig. 17 shows the sintering diagram of porous mullitecorundum ceramics. For Al2O3 and SiO2 particles adhered to the foam polyurethane mesh skeleton.32) First, Al2O3 phase transform to corundum phase, at the same time due to the adhesion between the particles, Al2O3 and SiO2 close together. Then, as temperature continues to rise, silica phase transform to cristobalite, meanwhile, mullite occurs at the interface between cristobalite and corundum phases, Al3+ diffuses to the interface S1 and reacts with cristobalite to generate mullite, such as formula (3). Si4+ diffuses into the interface S2 and reacts with corundum to generate mullite, such as formula (4). When the temperature continues to rise, the thickness of mullite layer thickens, the diffusion distance enlarges, and the formation rate of mullite decreases. Eventually the silica phase is completely consumed, leaving mullite and corundum phases.
4. Conclusions
Porous mullite-corundum ceramics were prepared by the solid state reaction between Al2O3 and SiO2 powders synthesized by organic foam impregnation method. The following conclusions were drawn:
(1) The molecular structure of foam polyurethane not be destroyed by alkali treatment, the roughness of surface of foam polyurethane is increased, and hang pulp quantity is increased. Alkali treatment will not destroy the molecular structure of foam polyurethane, but will improve the surface roughness of foam polyurethane and increase the amount of hang pulp quantity. In addition, the foam polyurethane treated by 3 wt% SDS solution has improved hydrophilicity, resulting in a further increase in the hang pulp quantity.
(2) With the elevation of sintering temperature, the relative content of mullite increases, the porosity decreases and the compressive strength enhances.
(3) With the extension of holding time, the relative content of mullite increases gradually, tends to be flat after holding for 3 h, the porosity of the sample decreases with the extension of holding time, and the compressive strength first improves and then tends to be stable with the extension of holding time.
(4) The relative content of mullite decreases with the improvement of m(Al2O3/SiO2), but the relative content of mullite is the highest when m(Al2O3/SiO2) is 2.5. With the of growth m(Al2O3/SiO2), the porosity of the sample enhances gradually, and the compressive strength of the sample shows a downward trend. When m(Al2O3/SiO2) is 2.5, reaching the maximum value of 6.23 Mpa, and the apparent porosity of the sample is 80.71 %.
