

1. Introduction
Water is a very valuable component of the environment. There is increasing global pollution of water due to industrial and household wastes. Dye-based industries are the main sources of water pollution because dyes and heavy metals are the two main wastes in the environment.1) Most dyes are toxic and non-biodegradable. Thus, the effluent must be adequately treated to reduce potential threats to the environment before discharge. Therefore, the removal of dye from wastewater is essential.
Rhodamine B (RB) is a xanthene dye with varying water solubilities.2) It is one of the most extensively utilized synthetic dyes in textile industries and a wellknown fluorescent dye for water tracing, which possesses properties, such as carcinogenicity, reproductive and developmental toxicity, neurotoxicity, and chronic toxicity toward humans and animals.3) It was previously reported that human exposure to RB was very dangerous. Mean exposure to RB for 26 min is known to cause burning of the eyes, excessive tearing, nasal burning, nasal itching, chest pain/tightness, etc..4) Therefore, it is very essential to remove this dye before disposing the dye-containing wastewater into the environment.
Several methods, such as inorganic coagulation, membrane separation, adsorption, biodegradation, photocatalytic degradation, and oxidation processes, have been developed to remove dyes. Further, among the aforementioned methods, the photocatalysis of RB has been reported by several groups as a common method,5-7) whereas the adsorption method is the most inexpensive, efficient and common purification process.8) Additionally, there are numerous reports on the adsorption of RB. Han et al. removed RB employing a nanoporous polymer.9) Modified zeolite has also been utilized to remove RB dye.10) Alwan et al. utilized an A-reduced graphene oxide (rGO)/cobalt oxide composite as an adsorbent.11) Further, most biomaterials have been utilized as adsorbents of RB. Abdolrahimi et al. utilized activated carbon, which was obtained from an almond shell, as an adsorbent,12) whereas acid-treated banana peel was employed by Oyekanmi et al. to remove RB.13)
In this study, a Zn ferrite nanoparticle was synthesized along with rGO (reduced graphene oxide). This rGO–Zn ferrite (rGZF) was synthesized by a hydrothermal method in which the reaction condition was completely different from that of reported processes. Comparatively lower temperature was applied here.14,15) After thorough characterization of the synthesized rGZF using several instruments, the synthesized nanocomposite was employed as an adsorbate for adsorbing RB in aqueous media. There are many reports, including catalysis by rGZF, on the removal of different dyes or pollutants.15-18) Notably, no data are available in the literature regarding the rGZF-assisted adsorption of dyes. However, only one report exists on the utilization of a bare ZF composite without rGO or graphene as an adsorbent of RB.3) Moreover, the thermodynamic study and reaction kinetics of the adsorption process were completely investigated.
2. Experimental
2.1 Materials
High-purity graphite flakes (40 μm) were obtained from Taewon Scientific Co. Zinc chloride (ZnCl2, 98 %) was obtained from Samchun Chemicals, and iron(II) chloride tetrahydrate (FeCl2.4H2O, 99 %) was purchased from Kanto Chemicals. Further, potassium permanganate (KMnO4), sulfuric acid (H2SO4, 95 %), phosphoric acid (H3PO4, 85%), hydrochloric acid (HCl, 35 ~ 37%), hydrogen peroxide (H2O2, 30 %), ammonia water (NH4OH, 25 ~ 30 %), and ethanol (C2H5OH, 99.9 %) were obtained from Duksan Reagents and Chemicals. Furthermore, the polytetrafluoroethylene (PTFE) membrane filter was purchased from Pall Corporation, and deionized (DI) water was utilized in all the experiments.
2.2 Preparation of GO
GO was prepared from the graphite flakes via the improved Hummers method.19) A mixture of KMnO4 and the graphite flakes (6:1 wt. eq.) was prepared in a round bottom flask, after which a mixture of H2SO4 and H3PO4 (9:1 vol. eq.) was added into the flask. Thereafter, it was necessary to wait until the temperature was to drop to room temperature. Afterward, the round bottom flask was placed on a heating mantle with constant stirring for 12 h at 50 °C. After the reaction was completed, the mixture was cooled to room temperature and poured over ice (DI water) with 30 % H2O2 (~3 mL). Next, the solution mixture was sieved using a testing sieve, and the filtrate was centrifuged for 4 h at 4000 rpm, and the supernatant was discarded, whereas the remaining solid was washed (two times) successively with water, 30 % HCl, and ethanol in a small Mega 17R high-speed refrigerated centrifuge machine at 4,000 rpm, after which the supernatant decanted off. After the solid was washed severally, the remaining materials were coagulated using ethyl ether and filtered through a PTFE membrane. Subsequently, it was dried overnight in an oven.
2.3 Preparation of the rGZF nanocomposites
A 1 mg/mL GO solution (200 mL) was prepared in DI water by ultrasonication. Next, 800 mg each of ZnCl2 and FeCl2.4H2O were added to the GO solution with constant stirring. Furthermore, NH4OH was added to adjust the pH to 10. Thereafter, the mixture was transferred into a Teflon-lined stainless-steel autoclave and placed in an oven for 12 h at 160 °C. After the completion of the reaction, the solution was centrifuged for 2 h at 4,000 rpm, and the obtained materials were washed with DI water and ethanol (two times in each case) to remove any free metal ion or other impurities. The final product was collected after the obtained material was vacuumdried for 12 h. For comparison, the pure ZF nanoparticle was also synthesized at pH 10 under the same condition without adding GO to the reaction medium.
2.4 Characterization
X-ray diffraction (XRD) analyses were performed on a RigakuD/max 2500 (Rigaku, Japan), utilizing a Cu Kα radiation at an accelerating voltage of 40 kV and a current of 200 mA. The obtained powder product was directly analyzed. The refraction data were recorded for 2θ angles between 5° and 70°. Field-emission scanning electron microscopy (FE-SEM) and energy-dispersive Xray spectroscopy (EDS) analyses were performed on a JEOL JEM-7601F field-emission scanning microscope at a voltage of 10.0 kV. The obtained dry product was spread on carbon tape for the FE-SEM analysis. The attenuated total reflection (ATR) of the sample was recorded on a combinatory vibrational spectrometer (Nicolet iS 50, Thermo Fisher Scientific Inc., USA). The Raman spectra were recorded from 100 to 2,500 cm−1 on a Horiba Jobin- Yvon LabRAM ARAMIS employing a 514.5 nm Ar laser with a 0.5 mW power after dispersing the powder samples on the microscope slide. X-ray photoelectron spectroscopy (XPS) was conducted on an ESCA2000 with an Al Kα X-ray source (1,486.6 eV) in a vacuum (~10−10 Torr). The pass energy was set at 50 and 20 eV for the wide and narrow scans, respectively. The X-ray take-off angle was fixed at 56°.
2.5 Adsorption technique
The adsorptions of RB on rGO-ZF and bare ZF were investigated under a dark condition. Briefly, 100 mg of the adsorbent was added to 100 mL of an aqueous solution of 10 ppm RB. This suspension was stirred and collected at the desired intervals. The absorbance of the samples was collected at a maximum RB absorbance peak (553 nm) employing a PerkinElmer precisely Lambda 35 UV/VIS spectrometer, and the concentrations of the samples were calculated using a prepared calibration employing the Beer–Lambert law. Further, the samples were centrifuged to remove the adsorbent suspension in the solution before measuring their absorbance. The treatment time was calculated by combining it with the centrifugation time.
3. Results and discussions
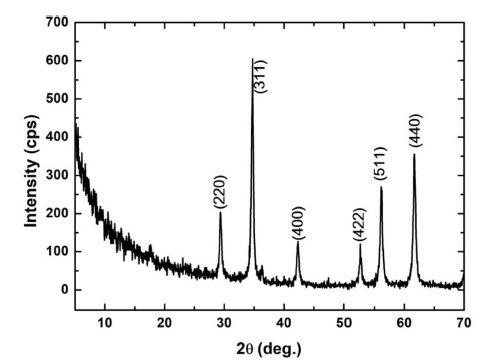
The XRD data confirm the formation of the ZF nanoparticles along with rGO. Fig. 1 shows that the diffraction peaks of the nanocomposite are similar to the standard diffraction pattern of a cubic spinel-structured ZF, ZnFe2O4 (JCPDS card no: 22-1012).3) No other peak was observed for GO, and this indicated that the rGO nanosheets were not stacked in the hydrothermal process and reductions of GO to rGO. Further, no significant peak was observed for the Zn or Fe compounds, thus confirming the purity of the composite.
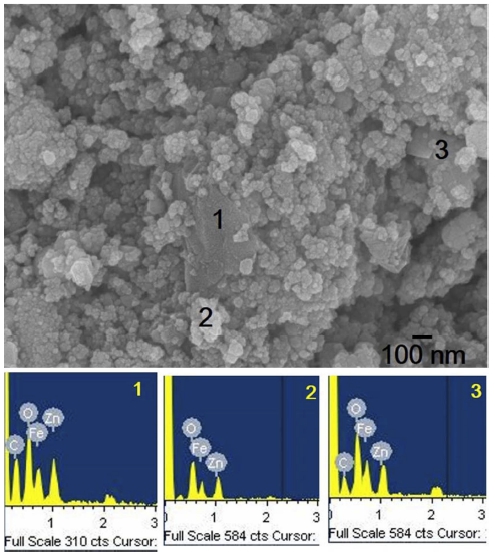
The morphology of the synthesized rGZF is shown in Fig. 2. The image shows the agglomeration of the ZnFe2O4 nanoparticles with rGO. Moreover, sheet-like rGOs were also visible in the image. Further, the shape of ZF was observed to be irregular in the composite, although the measured average size was 45 nm. Moreover, several parts were analyzed to confirm the elemental configuration, and the EDS spectra revealed that there are no impurities in the composite.
XPS is one of the best techniques for performing the elemental analysis and elucidation of the bonds in the sample. Fig. 3 shows the XPS spectra of the rGZF composite compared with those of GO. The C 1s spectrum of GO contains four peaks at 284.6, 286.7, 287.2, and 289.1 eV, which corresponds to the sp2 carbon, epoxide, carbonyl, and carboxyl functional groups, respectively.20) Conversely, four of the five peaks, which were observed in the rGZF composite, are similar compared with those in GO. The intensity of the oxygen-containing graphene peaks is smaller in the composite compared with that in GO. A new peak, which corresponds to the C–C bond, was observed at 285.7 eV.19) The O 1s spectra of GO exhibited peaks at 532.51 and 533.8 eV, which corresponds to the C=O and O=C–OH groups.21) The O 1s spectrum of the composite contains a total of three peaks. The peak at 530.3 eV corresponds to the oxides of Fe.22) The peak at 531.6 eV confirms the presence of the oxygen of ZnO, and the other peak corresponds to GO. The Fe 2p spectra exhibited two peaks, which correspond to 2p3/2 and 2p1/2 at 725.6 and 711.7 eV, respectively, and correspond to the Fe3+ states. The Zn 2p spectra correspond to Zn 2p3/2 and 2p1/2 at 1021.67 and 1044.71 eV, respectively. Furthermore, the separation between these two peaks is 23.04 eV, which is general for the Zn2+ states.21)
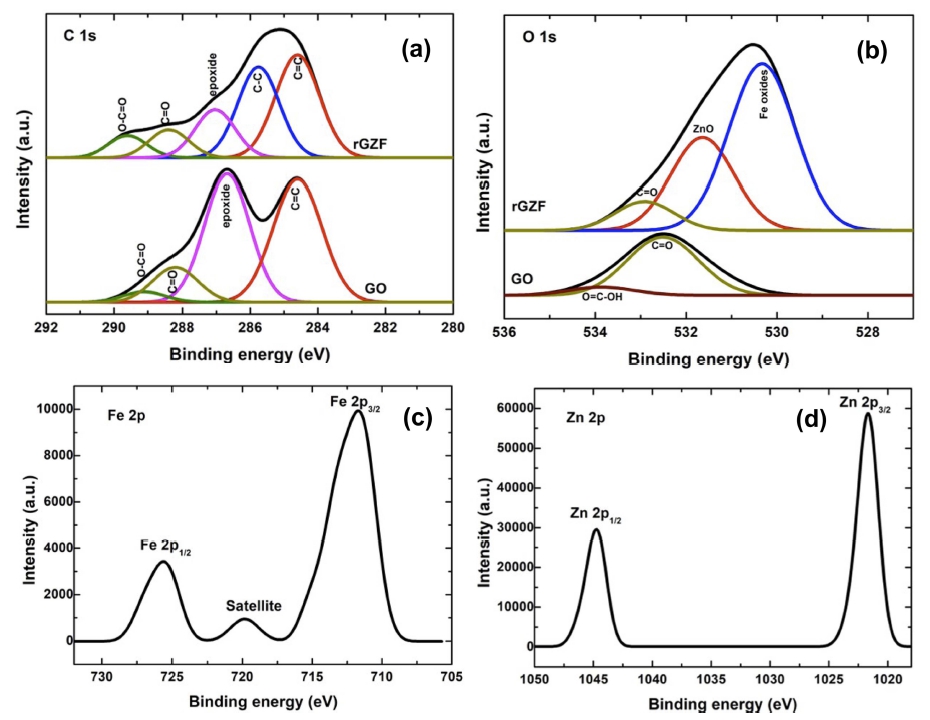
Fig. 3
XPS spectra of (a) C1S, (b) O1s of rGZF in comparison with GO, (c) Fe 2p and (d) Zn 2p spectra of of rGZF.
Fig. 4 shows the Raman spectra of the GO, ZF and rGZF samples. There are five Raman active modes (A1g, Eg, and 3T2g) in the cubic spinel structure.23) The Raman peaks around 330, 480, and 660 cm−1 are associated with the Eg, T2g(2), and A1g modes of a standard spinel structure, ZnFe2O4.24) The Eg band was due to the symmetric bending of the Fe–O bonds with peaks around 250 ~ 360 cm−1, and the T2g(2) band was due to the asymmetric stretching of the Fe–O bonds with peaks around 450 ~ 520 cm−1.25) Furthermore, the broadening of the peaks, which was due to the small particle size, was observed.
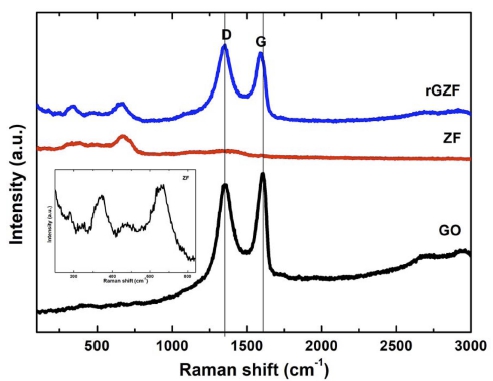
The Raman spectrum of GO exhibited two significant peaks at 1358 (D-band) and 1,600 cm−1 (G-band), which correspond to the breathing mode of the k-point phonons of the A1g symmetry and the E2g phonon of sp2 C atoms, respectively.26) Additionally, the D and G peak positions were shifted slightly to lower wavenumbers for the rGZF composite compared with those of bare GO, indicating that graphitization occurred during the reduction. The high intensity of the D peak could be due to the C–C bonds, as confirmed by XPS. The intensity ratio of the D and G peaks is inversely proportional to the average crystallite size in the graphitic materials. The D/G ratio of the composite (1.12) is larger than that of GO (0.96), and this indicated that the average crystallite size of the sp2 domains reduced in rGO in the composite.27) Additionally, it also corresponds to the presence of lower structural sp3 defects in rGO than in GO.28)
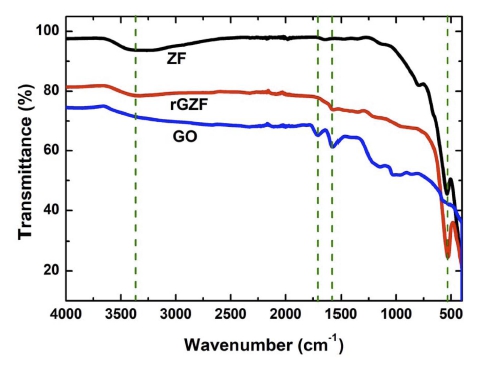
In Fig. 5, the ATR spectra of GO, which correspond to the skeletal vibration of the sp2 carbon and the stretching of the carboxylic acid groups, exhibited two strong transmittances at 1,570 and 1,704 cm−1, respectively. Additionally, rGZF also exhibited a peak at 1,570 cm−1, although that at 1,704 cm−1 disappeared, and this confirmed the reduction of GO. rGZF also exhibited a peak near 530 cm−1, which corresponds with the peak of bare ZF. This confirmed the Fe3+ state of Fe in the composite. All the products exhibited broad peaks near the 3,200 to 3,400 cm−1 region, and these correspond to the –O-H stretching vibration.
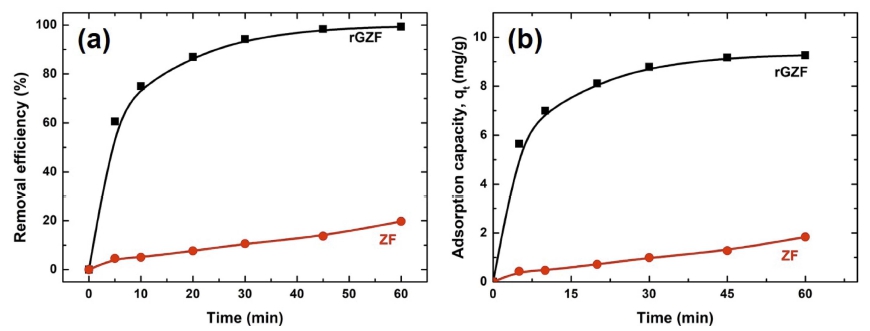
Adsorption properties: Employing Eq. (1), the obtained removal efficiencies of the rGZF nanocomposite and bare ZF were > 99% and ~ 20%, respectively, and the adsorption capacity (up to equilibrium) was calculated using Eq. (2).
where Co, Ct, V, and m are the initial concentration of the adsorbate, the concentration of the adsorbate at time t (mg L−1), the volume of the solution in L, and the mass of the adsorbent in g, respectively. Fig. 6(a) shows the resultant image obtained from Co = 10 mg/L, which confirmed that most of the dye had been removed by the composite comparing with the bare nanoparticle, thereby implying a significant improvement in the adsorption capability of a combination of ZF and rGO. Additionally, almost 60 % of the dye was adsorbed by rGZF within 5 min, after which the rate of adsorption reduced (Fig. 6(a)). From Fig 6(b), it has seen that rGO-Zn ferrites adsorption capacity towards RB is much higher than that of bare Zn ferrite. The value is 9.3 mg/g, whereas its only 1.8 mg/g for bare Zn ferrite.
To understand the mechanism of the adsorption process, the pseudo-first-order (PFO) and pseudo-second-order (PSO) kinetics were investigated (Fig. 7). The linear forms of the equations are given as follows.
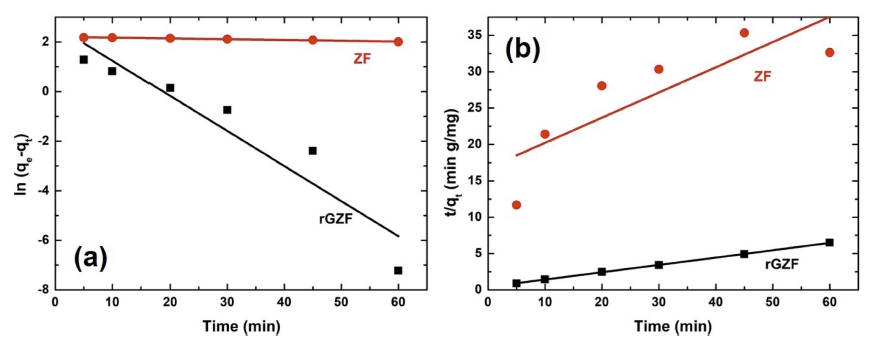
Fig. 7
(a) Pseudo 1st and (b) pseudo 2nd order kinetics for adsorption of the RB on rGZF in comparison with ZF.
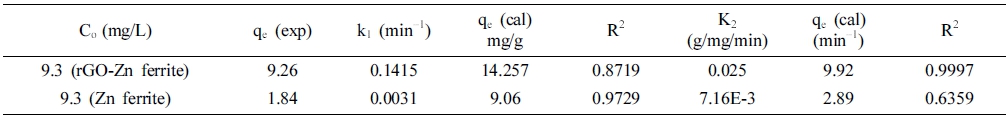
where k1 and k2 are the rate constants of the PFO (min−1) and PSO (g mg−1min−1) reaction kinetics. The parameters, which were obtained by these analyses, are summarized in Table 1. According to Figs. 3 and 4 and Table 1, it appeared that the adsorption process employing ZF followed the PFO model, although the incorporation of rGO in ZF changed the behavior of the adsorption kinetics to that of a PSO model. However, regarding the two models, the reaction rate was much higher with rGZF as the adsorbent compared with ZF.
The Langmuir and Freundlich isotherm models were applied to investigate the adsorption process. Fig. 8 shows the two isotherms of this adsorption system. The Langmuir model was based on the monolayer adsorption process, whereas the Freundlich model is based on multilayer adsorption. The linear expressions of the Langmuir and Freundlich models are represented as follows, respectively.
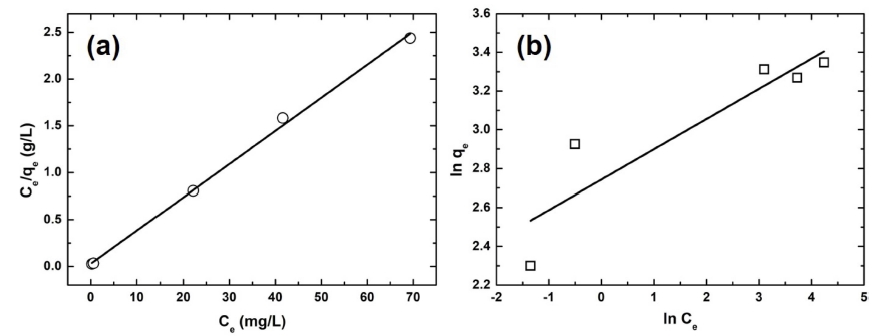
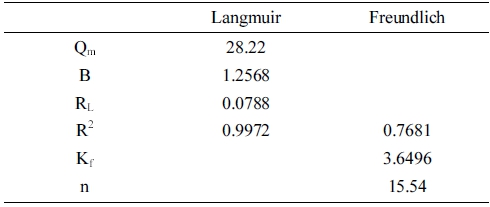
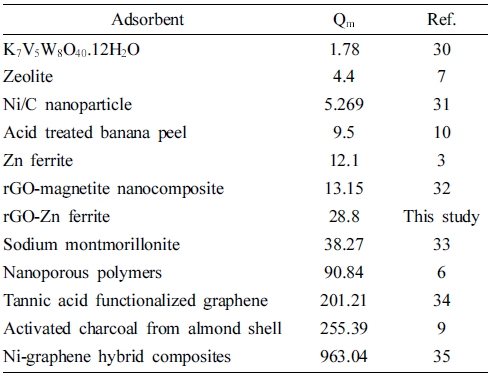
where qm, b, Kf, and n are the maximum monolayer adsorption capacity of the Langmuir isotherm, the Langmuir adsorption constant, and the adsorption capacity and adsorption strength of the Freundlich isotherm, respectively. Table 2 summarizes all the parameters of the adsorption isotherms. The correlation coefficient of the Langmuir isotherm was greater than that of the Freundlich isotherm, indicating that the Langmuir isotherm model fitted the experimental data better than the Freundlich one. Further, the maximum adsorption capacity of this process was 28.2 mg/g.
The essential characteristics of the Langmuir isotherms could be described by the separation factor (RL), which is defined by Eq. (7).3)
The value of RL reveals the nature of the absorption process.29) In this study, the values of RL were in the range of 0 ~ 1, indicating that the process of adsorbing RB favored the rGZF nanocomposite. Table 3 compares the maximum monolayer adsorption capacities of RB onto different adsorbents.
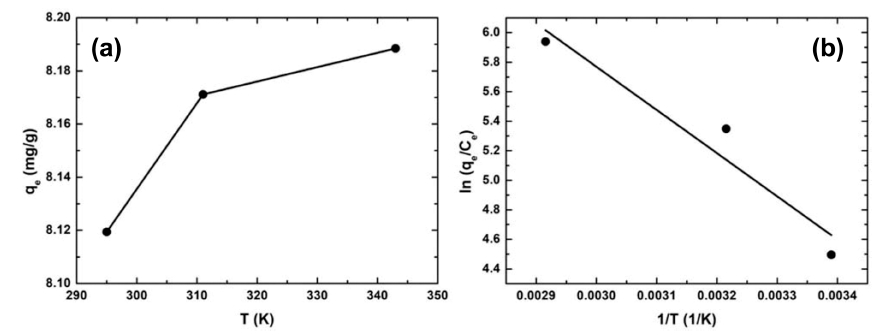
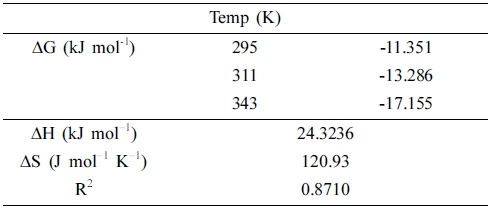
The temperature-dependent adsorption of RB on rGZF was performed to elucidate its thermodynamic properties. Fig. 9(a) shows the relationship between the temperature and maximum adsorption capacity. The adsorption capacity increased with increasing temperature, and this suggested that the process was endothermic. Further, thermodynamic parameters, such as the Gibbs free energy (ΔG), enthalpy (ΔH), and entropy changes (ΔS) were calculated according to the following equations.
where R is the universal gas constant, T is the temperature, qe is the amount of RB that was adsorbed at equilibrium, ce is the concentration at equilibrium, and Kc is the equilibrium constant.
Fig. 9(b) shows the plot of ln(qe/ce) vs 1/T, and (ΔH) and (ΔS) were calculated from this plot employing Eq. (8) (The parameters are listed in Table 4). The positive value of ΔH confirmed that the adsorption process was endothermic, whereas the positive value of ΔS confirmed the increased randomness at the interface of the solid solution during the adsorption of RB onto rGZF. The values of ΔG were negative at all the tested temperatures, and this confirmed that the adsorption process was spontaneous and thermodynamically favorable. Moreover, the values of ΔG and ΔH implied that physical adsorption had occurred. For general physical adsorption, ΔG is generally -20 to 0 kJ/mol, and ΔH is between 2 and 21 kJ/ mol.36) Notably, our calculated values were within the reported ones. During physical adsorption, the adsorbate and adsorbent are bonded by Van der Waals forces of attraction.
4. Conclusions
An rGZF nanocomposite was successfully synthesized via a hydrothermal method, and its characterization revealed that ZFs were densely spread over the rGO sheets. Further, its role in the adsorption of RB was also well investigated. The resultant data show that monolayer adsorption, which followed the PSO kinetics, occurred on the rGZF surface. The adsorption capacity of the synthesized nanocomposite was much higher than that of bare ZF in aqueous media. The maximum adsorption capacity according to the Langmuir isotherm was 28mg/g. The thermodynamic study indicated that the adsorption was a physical process, which was spontaneously endothermic.
