

1. Introduction
Thermoelectric devices can convert electricity into thermal energy and vice versa as the temperature changes.1) The dimensionless figure of merit ZT determines the efficiency of thermoelectric materials. The following equation can be used to calculate the ZT value.
In this equation, S denotes the Seebeck coefficient, σ is the electrical conductivity, κ is the thermal conductivity, and T denotes the temperature in Kelvin. As demonstrated in eq. (1), a high ZT value requires a high power factor (PF), S2σ, and low thermal conductivity (κ). According to the Widemann-Franz law, electrical conductivity is directly proportional to electronic thermal conductivity (κE = σLT, where κE is electronic thermal conductivity and L is Lorenz number).2) Furthermore, as carrier concentration rises, the Seebeck coefficient falls while electrical conductivity rises. These interdependencies make achieving high ZT challenging. As a result, an optimal value of S, σ and κ are required to obtain a high dimensionless figure of merit (ZT). In order to obtain a high ZT value, various strategies were used, which either reduced thermal conductivity by increasing phonon scattering3,4) or increased electronic properties by tuning the carrier concentration.5,6)
In many ways, Zintl phases exhibit desirable TE properties due to their small-band-gap, as well as diverse and complex crystal structures7). Their rich crystal chemistry allows for precise tuning of transport properties. The semiconducting nature of Zintl phases is due to their valence compound behavior. Such phases contain elements with high electronegativity differences, resulting in a clear distinction between anionic and cationic parts, with electron transfer from one to the other assumed to be essentially complete.7) Generally, Zintl compounds have two ionic sites, one of which is an electropositive cation, and the other an electronegative anion.8) The electropositive cation can donate electrons to the electronegative anion, resulting in an ionic compound. Furthermore, if the cation accommodates an insufficient number of electrons to donate anion, the anion's valance shell will be incomplete. As a result, anion forms a covalent bond with another anion. The presence of both ionic and covalent bonds complicates the structure of zintl compounds, resulting in electron-crystal phonon-glass properties.9)
The zintl compound Mg3Sb2 has two structures: cubic and hexagonal.7) The cubic α-Mg3Sb2 is a low temperature phase composed of 48 Mg and 32 Sb atoms, similar to the structure of α-La2O3. However, the hexagonal crystal structure of Mg3Sb2 is known as β-Mg3Sb2, a high temperature phase similar to the crystal structure of Mn2O3. It has two distinct Mg sites where ionic Mg2+ cation can donate electron to [Mg2Sb2]2- sites, resulting in typical zintl compound behavior.9)
P-type Mg3Sb2 demonstrated poor thermoelectric performance due to their low electrical properties, which limited its practical application. Numerous experiments have conducted to improve the ZT value of p-type Mg3Sb2, but it remains less than one.10-14) However, due to their low thermal conductivity and high electrical properties, n-type Mg3Sb2 demonstrated high thermoelectric performance.7,9,15,16) In this study, a small amount of Te was introduced at Sb sites to investigate the effect of Te doping in the solid solution of Mg3.8Sb2-xTex on the subsequent thermoelectric properties. A theoretical calculation has shown that Te can act as an effective n-type dopant because the formation energy of Te interstitials is relatively lower when compared to Mg interstitials.17)
In this study, Mg3Sb2 alloying with variable Te composition (0 ≤ x ≤ 0.03) were synthesized using a controlled melting method that included elemental shots, pulverizing, and vacuum hot pressing (VHP). This procedure is very novel for this type of alloy system and reduced the overall processing times.18,19) In order to produce singlephase Mg3Sb2, an excessive amount of Mg was considered to be added in the initial powder mixture, because the composition of the nominally designed Mg3Sb2 usually resulted in excessive Sb contents after the hot consolidation process, as reported in other studies.20) It was reported that Te doped Mg3Sb2, synthesized via levitation melting, ball milling followed by spark plasma sintering, turned out to be n-type conduction and showed improved thermoelectric properties in the Mg3Sb2.11) This study also showed that Te doping in Mg3.8Sb2-xTex (0 ≤ x ≤ 0.03) improved electrical conductivity as well as Seebeck coefficient while decreasing thermal conductivity, resulting in a higher ZT value than that of pristine state.
2. Materials and Method
All samples with the nominal composition Mg3.8Sb2-xTex (0 ≤ x ≤ 0.03) were prepared and mixed using elemental shots of Mg (99.9 % purity, Kojundo), Sb (99.999 % purity, Kojundo), and Te (99.9 % purity, Kojundo). For controlled melting, the measured sample was placed in a graphite crucible with a stopper, the inner walls of which were coated with a thick layer of boron nitride (BN). The crucible was then placed in the vacuum furnace. The sample was then heated for 1 h at 1,173 °C. After the heating process was completed, the cooled ingot was pulverized with a mortar pestle. The powders were also sieved using a 325 mesh sieve. The entire pulverizing to sieving process was carried out under Ar gas atmosphere in a glove box. Then, vacuum hot pressing (VHP) was carried out at 70 MPa and 873 K for 4 h. The phases were characterized by X-ray diffraction (XRD; Bruker AXS Advance D-8, Germany) of a Cu-Kα radiation. Scanning electron microscopy (SEM, FEI Quanta-400, Netherland) was carried out to study particle size, and surface morphology. The electronics property in terms of electrical conductivity and Seebeck coefficient were estimated using the 4-probe method inserted into ZEMIII (Ulvac-Riko, Japan). The VHPed samples were cut into cylindrical samples of 3 × 3 × 9 mm3 for this calculation. Circle samples of 10Φ × 1 mm were produced to measure thermal diffusivity using laser flash process within TC-9000H (Ulvac-Riko, Japan). The density for all prepared sample was determined by Archimedes principle where distilled water was used. The Van der Pauw technique (modified Keithley 7065, USA) was conducted to measure the transport properties at a fixed magnetic field (1T) and fixed electric current (10 mA).
3. Result and Discussion
X-ray diffraction (XRD) data for VHPed Mg3.8TexSb2-x is shown in Fig. 1(a). As a reference, XRD data for x = 0.02 after casting is plotted in this figure. From the figure it can be observed that no secondary phases are appeared. Fig. 1(b) depicts lattice parameters a, and c for VHPed Mg3.8-xTexSb2-x as a function of Te concentration (x). With increasing x, lattice parameters are observed to decrease. Due to lower ionic radii of Te2− than that of Sb3−, substitution of Te at Sb sites may increase the lattice parameter.21) This could imply that Te was induced by the lattice position of Sb.
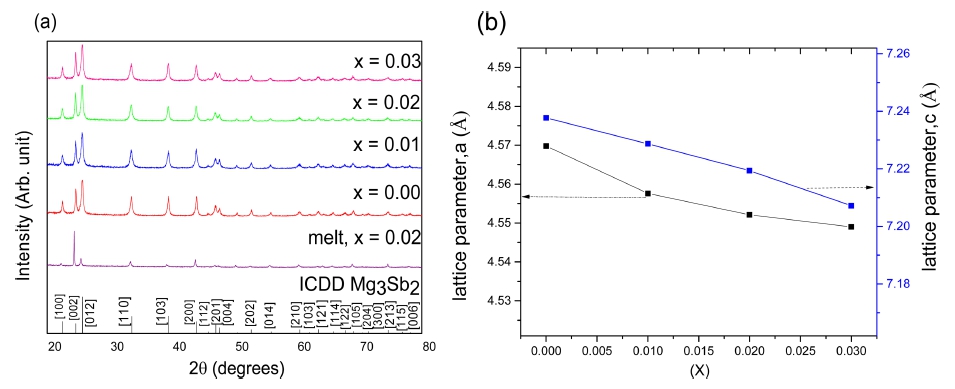
Fig. 1
XRD diffraction pattern of Mg3.8TexSb2-x for (a) VHPed sample and (b) lattice parameter with respect to Te content (x).
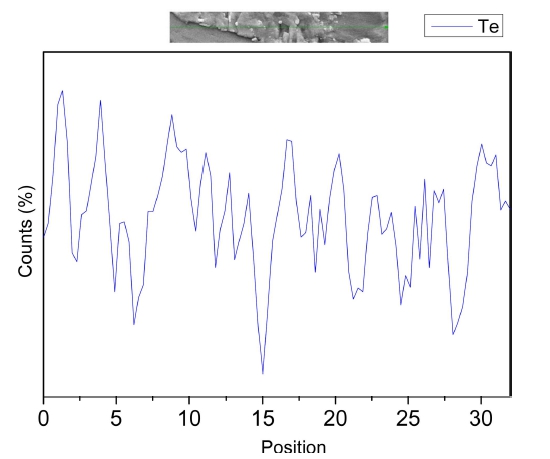
Fig. 2(a) shows the microstructure of pulverized powders for Mg3.8Te0.01Sb1.99. The particles were typically angular in shape and less than 45 μm in diameter since samples were sieved through 325 meshes after pulverization. The surface morphology of the fractured sample for VHPed Mg3.8Te0.01Sb1.99 is shown in Fig. 2(b). As can be seen, the sample has a dense microstructure with no obvious internal flaws. The characteristics of the lamellar structure are commonly observed in this material system, as well as in other studies.22) Energy dispersive X-ray spectroscopy (EDS) line profile for VHPed Mg3.8Te0.01Sb1.99 is shown in Fig. 3. Te seems to be uniformly distributed within the detected area.
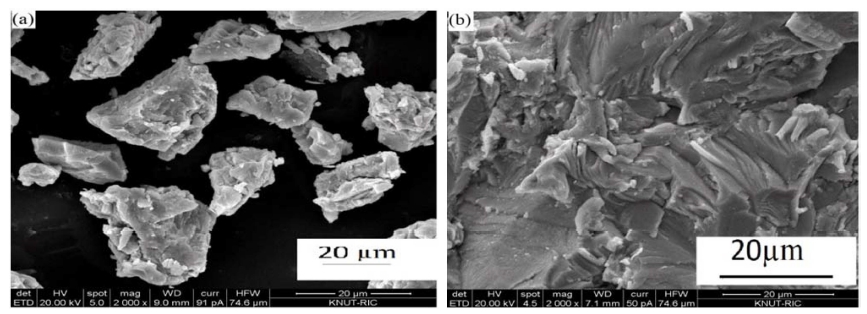
Fig. 2
Scanning electron microscopy of (a) as-sieved and (b) fractured surface of VHPed Mg3.8Te0.01Sb1.99.
The electrical conductivity of the samples Mg3.8TexSb2-x (0 ≤ x ≤ 0.03) is shown in Fig. 4(a). As it can be seen, the electrical conductivity is increased with increasing temperature, corresponding to intrinsic semiconductor behavior. At room temperature, all compositions have a high electrical resistivity. These semiconductors, however, exhibit an increase in electrical conductivity beyond 373 K. It is believed that the majority carrier (electrons) gains enough energy to cross the band gap region at 373 K. It can also be observed that maximum σ for Te doped samples is lower than the intrinsic one, possibly due to decrease in carrier mobility.
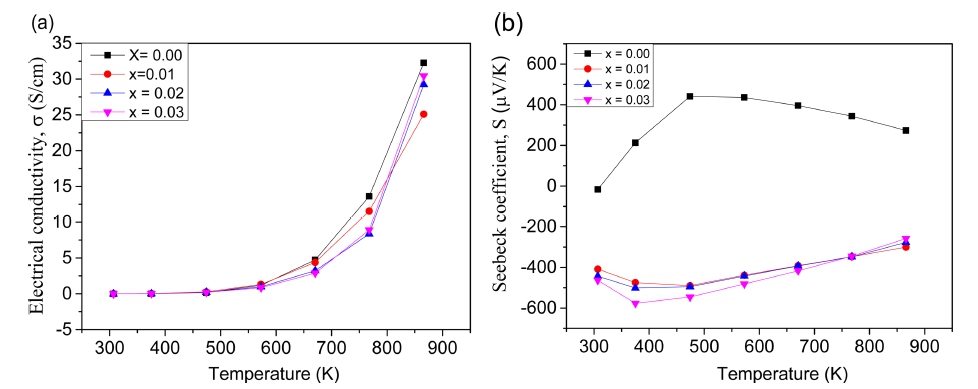
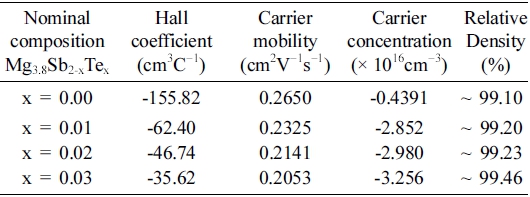
Fig. 4(b) depicts the variation of the Seebeck coefficient for the synthesized pellets. The Seebeck coefficient found to be negative in all of the Te-doped samples, indicating the n-type semiconductor properties with respect to Hall coefficient measurement, as shown in Table 1. This employs that the primary carrier type is turned into free electrons when Te doping takes place. In terms of temperature, and magnitude, the Seebeck coefficients of all Te doped samples increased up to 373 K, and then decreased. Seebeck coefficient variation behavior and electrical conductivity in the test temperature range appeared to fit well together, as expected.
Table 1
Relative density and transport properties of vacuum hot pressed Mg3.8TexSb2-x samples at room temperature.
 |
The temperature dependence of total thermal conductivity (κ) and lattice thermal conductivity (κL) for Mg3.8TexSb2-x (0.00 ≤ x ≤ 0.03) are shown in Fig. 5(a) and 5(b), respectively. For all compositions, the total thermal conductivity is decreased with increasing temperature up to 773 K, and then slightly increased. This behavior can be explained by considering lattice thermal conductivity (κL), and electronic thermal conductivity (κE). Total thermal conductivity is known to be the sum of κL and κE, and according to the Wiedemann-Franz law, electronic thermal conductivity can calculate using κE = LσT (the Lorenz number L = π2/3(KB/e)2 = 2.38 × 10⁻⁸ WΩK−2). As shown in Fig. 5(a) and 5(b), the difference between κ and κL is very small, which describe the main contributor of κ is κL. Due to the high mass difference between Te and Sb, the substitution of Te at Sb sites may initiate point defect scattering, lowering lattice thermal conductivity.23) Total thermal conductivity is observed to increase at 773 K for all compositions. This is possibly due to an increase in electrical conductivity at that temperature. The decrease in thermal conductivity could be attributed to the doping effect.
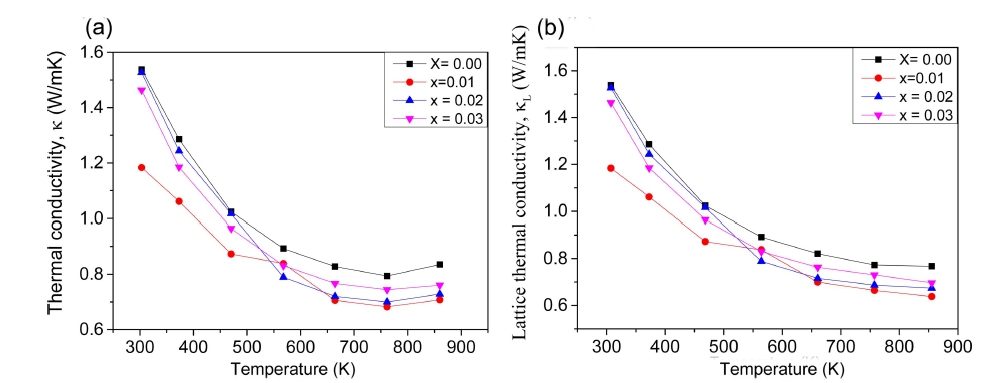
Fig. 5
Temperature dependence of (a) thermal conductivity and (b) lattice thermal conductivity of VHPed Mg3.8TexSb2-x.
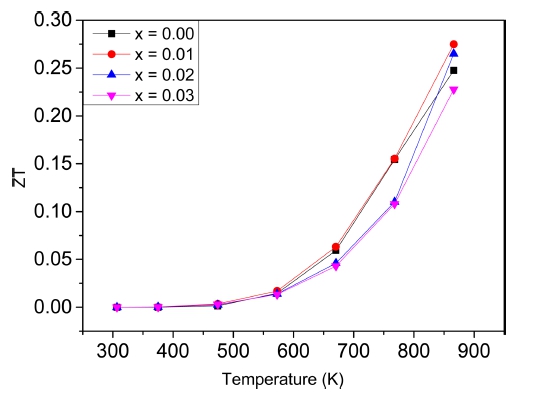
The dimensionless figure of merit (ZT) is evaluated in Fig. 6 with respect to temperature and x. Sample Mg3.8Te0.01Sb1.99 shows a peak ZT ≈ 0.27 at 873 K due to its relatively lower thermal conductivity and optimum electronic properties. This improvement of ZT is 1.12 times higher than that of the pristine one.
4. Conclusion
Nominal compositions of Mg3.8TexSb2-x (0.00 ≤ x ≤ 0.03) were successfully synthesized by the controlled melting and subsequent vacuum hot pressing method. Te seemed to be uniformly distributed throughout the matrix and played an important role as a dopant. The substitution of Te at Sb sites has controlled to increase phonon scattering, which is responsible for the reduction in thermal conductivity. The methodical measurement shows the peak ZT value of 0.27 at 873 K. Despite of the fact that this study showed relatively lower thermal conductivity, the acquired electrical conductivity appeared to be quite low due to the lower value of carrier concentration. It is proposed that selective doping could increase carrier concentration even more, potentially increasing ZT value in n-type Mg3Sb2.
