

1. Introduction
The use of heterogeneous catalysts in chemical applications is currently being researched. Several studies have been reported on the use of heterogeneous catalysts for example in the synthesis of biofuels, diethyl ether, and biodiesel.1) The advantages of using the heterogeneous catalysts include low cost, a high active site, porosity, a hydrophilic catalyst surface, environmentally friendly and easier to separate.2) The types of heterogeneous catalysts are Zirconia (ZrO2) and Titania (TiO2). ZrO2 and TiO2 have superior physical and chemical properties compared to other catalysts. In addition, being cost effective, low toxicity, long-term stability, and have acidity/basicity properties.3.4)
Zirconia and titania are developed as heterogeneous acid catalysts to form sulfated zirconia (SO4/ZrO2) and sulfated titania (SO4/TiO2). These catalysts are selective, have high surface area and thermal stability, and reusable.5) ZrO2 and TiO2 modified with sulfate that known as a super acid solid catalyst, produces a strong acidity.6.7) Heterogeneous acid catalyst SO4/TiO2 showed good catalytic activity and called a super acid solid catalyst which shows better performance than other metal sulfate oxide catalysts.8.9)
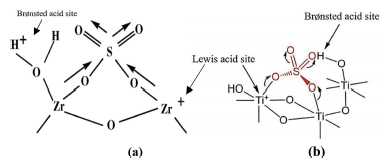
The sulfation process can produce a Brønsted acid site on the catalyst’s surface, resulting in increased acidity and catalytic activity of the catalyst. The sulfate group coordinated to the zirconia or titania causes the acidity of the catalyst increases. ion is bound to one or two metal ions to form the chelating bidentate complex and bidentate bridge.10) The calcination process on a SO4/ TiO2 catalyst can form O=S=O group as electron trap which can increase the catalytic activity of sulfated zirconia or titania.11) The structure of sulphated zirconia and sulphated titania are shown in the Fig. 1.
The aim of this study is to determine the effect of sulfation on physicochemical properties of ZrO2 and TiO2. Sulphate groups were functionalized in ZrO2 and TiO2 nano-powder by mixing them with different concentration of sulfuric acid followed by calcining the catalysts at various temperature to obtain sulfated zirconia and sulfated titania. ZrO2 and TiO2 nano-powder was used as a source of material due to its inexpensive properties and availability compared to the use of precursor that require high cost and long-time period.
2. Materials and Methods
2.1. Materials and preparation of catalysts
The materials used are ZrO2 and TiO2 commercial, sulfuric acid (98 %) and ammonia (25 %) that obtained from E-Merck.
10 g of each ZrO2 and TiO2 commercial was suspended in 100 mL H2SO4 (0.5; 0.75; and 1.0 M) and stirred for 24 hours at room temperature. The solids obtained were dried at 105 °C for 24 hours in an oven and calcined at 500 °C for 4 hours. The catalysts were denoted as 0.5- SO4/ZrO2, 0.75-SO4/ZrO2, and 1-SO4/ZrO2; 0.5-SO4/TiO2, 0.75-SO4/TiO2, and 1-SO4/TiO2. The catalysts were characterized using FTIR, XRD, and acidity test by ammonia adsorption.
The catalyst with the highest total acidity was calcined at various temperature of 400, 500, and °C for 4 hours. The catalysts were denoted as x-SO4/ZrO2-400, x-SO4/ ZrO2-500 and x-SO4/ZrO2-600; x-SO4/TiO2-400, x-SO4/ TiO2-500 and x-SO4/TiO2-600. Next, characterized using FTIR, XRD, SEM-EDS, SAA, and acidity test.
2.2. Characterizations
Characterization of catalysts were carried out by Fourier Transform Infrared Spectroscopy (FTIR, Shimadzu Prestige-21), X-Ray Diffraction (XRD, Rigaku MiniFlex 600 and Kα ratio 1.54060 Å), Scanning Electron Microscope (SEM, JEOL JSM-6510) combined with Energy Dispersive X-Ray (EDX, JED-2300 Analysis Station) and Surface Area Analyzer (SAA, Quantachrome NOVAtouch).
3. Results and Discussions
3.1. FTIR analysis
FTIR spectra in Fig. 2(a) show that zirconia has an absorption peak in the 424 ~ 740 cm-1 indicating the presence of stretching vibration of Zr-O-Zr.10) SO4/ZrO2 catalyst at various concentrations of sulphate have absorption peaks of sulphate group at 956 ~ 1,157 cm-1, which is a symmetry and asymmetry vibration of S=O and S-O from SO4,12-14) confirming the presence of sulphate bonded to the surface of zirconia. The peaks in the 3,449 and 1,635 cm-1 shows the stretching of -OH and bending vibrations of H2O molecules coordinated onto the ZrO2.15) Fig. 1(b) shows that at a calcination temperature of 500 °C, the sulphate absorption bands appeared as many as four bands at 1,242 ~ 964 cm-1, whereas only two absorption bands appeared at temperature of 400 °C. This could indicate that sulphate ions have started to spread evenly on the zirconia surface.16) The intensity of sulphate bands was reduced at a temperature of 600 °C due to the decomposition of sulphate groups from zirconia surface.
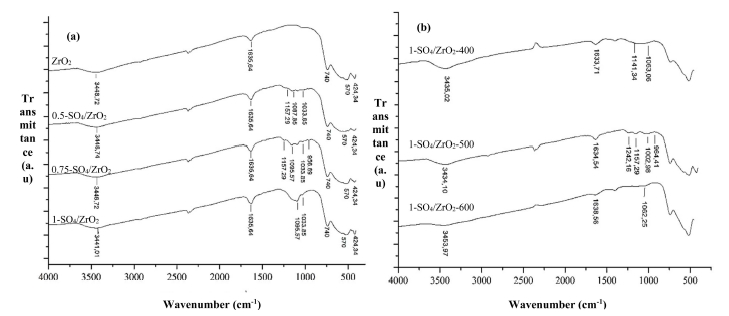
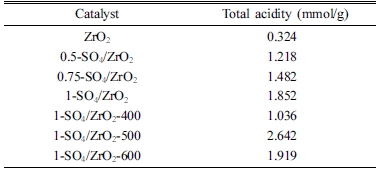
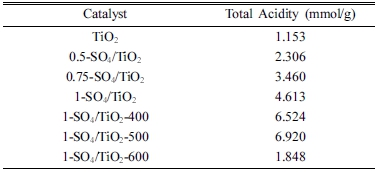
Table 1 shows the acidity number of catalysts by ammonia adsorption method. Zirconia (ZrO2) exhibited a total acidity of 0.324 mmol/g. The highest total acidity of zirconia impregnated with various concentrations of H2SO4 appeared in the 1-SO4/ZrO2 catalyst with total acidity of 1.852 mmol/g. This phenomenon shows that the greater the concentration of H2SO4, the more ions are bound on the zirconia surface contributing to the increase of the catalyst acidity.9.13) The 1-SO4/ZrO2 catalyst was then calcined at various calcination temperatures. The highest total acidity was produced at a calcination temperature of 500 °C which was 2.642 mmol/g, while at 600 °C the total acidity began to decline. The reason is that the higher the calcination temperature, the bound sulphate ions will gradually be detached from zirconia surface.
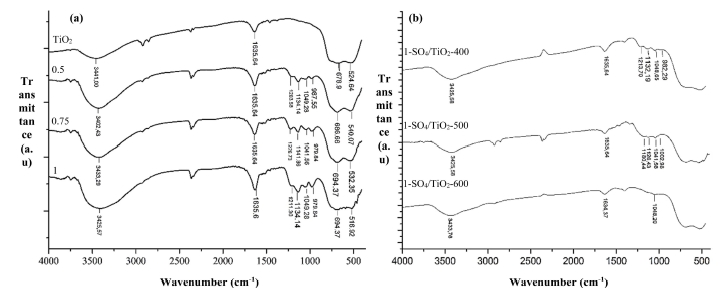
Similar trends also observed in the SO4/TiO2 spectra. Fig. 3(a) shows the absorption band at 516 ~ 694 cm-1, representing the Ti-O-Ti.4) FTIR spectra of SO4/TiO2 with varied H2SO4 concentrations have four new bands that appeared at 979 ~ 1,226 cm-1 that are asymmetric vibrations of S=O at 1,226 cm-1, symmetrical vibration of S=O at 1,134 cm-1, S-O asymmetry vibration at 1,049 cm-1, and symmetry S-O at 979 cm-1.17) The spectra confirm the presence of sulphate ions bonded to the surface of titania.4,18) Fig. 3(b) shows various calcination temperatures affect the intensity of the sulphate bands and total acidity of catalysts. Calcination temperatures of 400 ~ 500 °C show clearly visible sulphate ion bands, while at a temperature of 600 °C, these bands noticeably disappeared, indicating reduction of sulphate ions on the surface of TiO2. The total acidity of 1-SO4/TiO2-500°C (4.613 mmol/g) was found to be the highest in acidity tests of catalysts.
3.2. XRD analysis
The X-ray diffractogram patterns of ZrO2 and 1-SO4/ ZrO2-500 catalysts are shown in Fig. 4(a). There are three highest diffraction peaks intensity values at 2θ = 27.97; 31.24; and 49.02 confirmed monoclinic phase of ZrO2 with dhkl values of (-111), (111) and (220) (JCPDS no. 00-037-1484). The monoclinic peaks intensities of the catalyst 1-SO4/ZrO2-500 are lower than those of ZrO2 based on the monoclinic phase. This phenomenon occurs because sulphate ions have covered the zirconia surface, causing a slight decrease in crystallinity, as a result, a decrease in the intensity of the monoclinic phase.19)
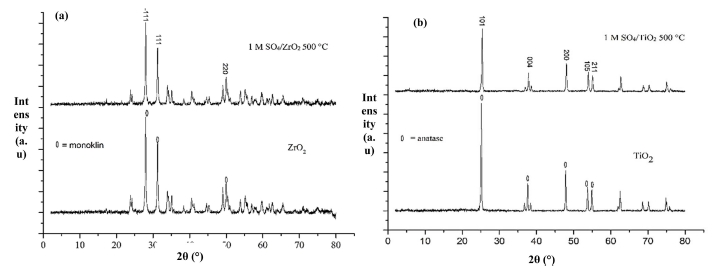
XRD patterns of TiO2 and 1-SO4/TiO2-500 catalysts are shown in Fig. 4(b). The five highest diffraction peaks appeared at 2θ = 25.33; 37.85; 48.07; 53.09 and 55.06. These peaks confirmed anatase phases with dhkl values of (101), (004), (200), (105) and (211) (00-021-1272). A similar trend in low anatase peaks intensities is observed in 1-SO4/TiO2-500 as compared to those of TiO2 due to the presence of SO4 ion, which can reduce the TiO2 crystallinity.
3.3. SEM analysis
The SEM images of ZrO2 and 1-SO4/ZrO2-500 are shown in Fig. 5. 1-SO4/ZrO2-500 have a similar particle size with ZrO2. Therefore no agglomeration was observed after sulfation process. 1 M SO4/ZrO2-500 has brighter surface than ZrO2 due to the presence of sulfate, indicating that the sulfation was successfully carried out.20)
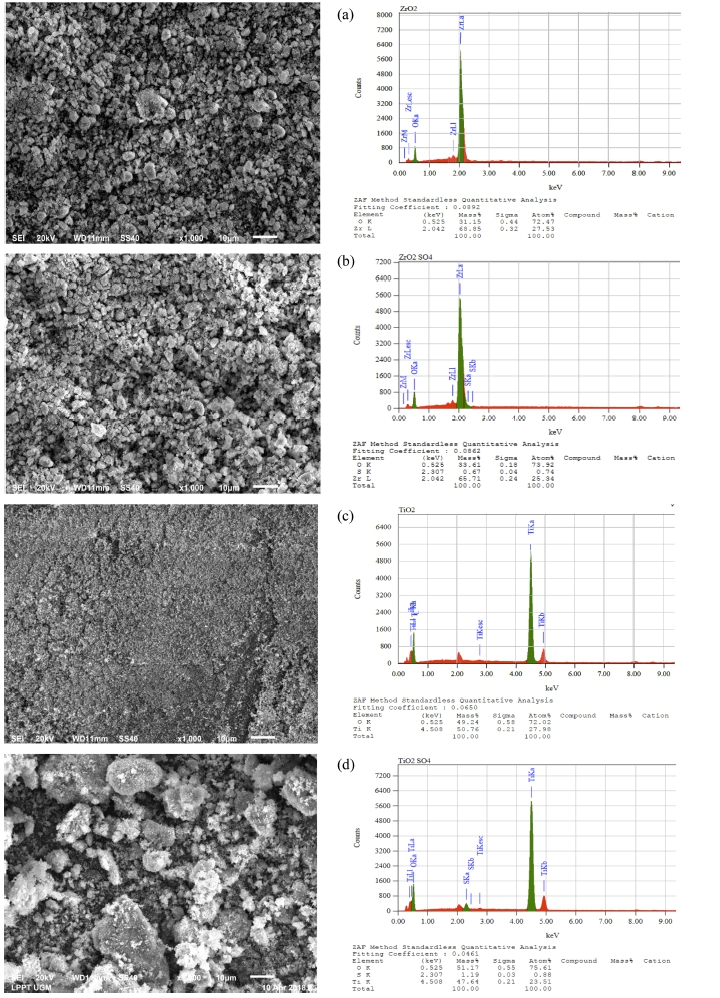
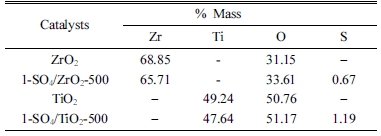
The sulfation process on titania on the 1-SO4/TiO2-500 catalyst, resulted in agglomeration and larger particle size [Fig. 5(c) and (d)]. Similar study was also reported by Sarvari et al..17) which shows the increase in titania particle size after sulfation process. The morphology of 1-SO4/TiO2-500 also shows a brighter surface, indicating that sulphate have been successfully impregnated to the titania surface. The elemental analysis (SEM-EDS) of the catalysts (Table 3), supports the successful sulfation on zirconia and titania with sulphur content of 0.67 % and 1.19 % on 1-SO4/ZrO2-500 and 1-SO4/TiO2-500 catalysts, respectively.
3.4. SAA analysis
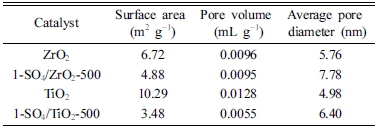
The specific surface area, total pore volume, and average pore diameter of the catalyst were determined using a surface area analyser, as shown in Table 4. ZrO2 has a specific surface area and pore volume of 6.72 m2/g and 0.0096 mL/g. It was found that the surface area and pore volume of zirconia decreased after the sulfation process due to sulphate ions accumulation in the pores of the catalyst in the presence of agglomeration.21) Similarly, due to the presence of sulphate covering the surface and pore of titania, there was a decrease in surface area (from 10.29 to 3.48 m2/g) and pore volume (from 0.0128 to 0.0055 mL/g) after sulfation. The pore diameters of 1- SO4/ZrO2-500 and 1-SO4/TiO2-500 catalysts are 7.78 and 6.40 nm, respectively, confirming the materials’ mesoporous structure properties.4.22)
4. Conclusion
SO4/ZrO2 and SO4/TiO2 catalysts were successfully prepared using a wet impregnation method with H2SO4 concentration of 0.5, 0.75, and 1 M, followed by calcination temperatures of 400, 500, and 600 °C. The total acidity of the 1-SO4/ZrO2-500 and 1-SO4/TiO2-500 catalysts was found to be the highest, at 2.642 and 6.920 mmol/g, respectively. According to EDS analysis, the 1-SO4/TiO2- 500 catalyst has a higher sulphur content compared to the 1-SO4/ZrO2-500. In conclusion, it is suggested that sulphated titania will outperform a sulphated zirconia catalyst for acid catalyst in the conversion of ethanol to dimethyl ether due to its higher acidity.
