


1. Introduction
2. Experimental Procedure
2.1. Cold Drawing Process
2.2. Characterization
3. Results and Discussion
3.1. Microstructure
3.2. Mechanical Properties
3.3. Electrical Properties
4. Conclusion
1. Introduction
Recently, the demand for lightweight materials has increased in the automotive, power, and electronics industries to reduce energy consumption and carbon emissions. In the automotive industry, increasing attention has been focused on aluminum (Al) wires as a replacement for copper (Cu) wires to improve fuel efficiency and extend the driving range of electric vehicles.1,2,3,4) Owing to its lower density than Cu, Al offers an approximately 50 % weight reduction on an equal-volume basis.5) Automotive and power transmission wires require both high electrical conductivity and excellent mechanical properties. However, Al wires exhibit lower electrical conductivity and inferior mechanical properties than Cu wires. Alloying elements influence the electrical and mechanical properties by modifying the solute atom distribution and microstructure. Therefore, the design of Al alloys capable of simultaneously achieving high electrical conductivity and excellent mechanical properties has become an important research issue.6,7,8) Al-Fe- based alloys have attracted considerable attention as conductor materials because Fe-based intermetallic compounds provide excellent mechanical stability while maintaining relatively high electrical conductivity.9,10) In addition, alloying elements such as Cu, Mg, Si, and B are known to influence the microstructure and properties of these alloys.11,12) In particular, the Fe and Mg contents affect the strength and work-hardening behavior. Si reacts with Fe and alters the morphology and distribution of intermetallic compounds. Such changes affect the electrical conductivity and mechanical properties. Meanwhile, cold drawing induces repeated plastic deformation. This deformation increases the dislocation density and elongates the grains along the drawing direction. Such microstructural changes affect the strength, ductility, and electrical conductivity. Therefore, analyzing microstructural evolution and property changes during drawing is essential for the development of high-performance Al wires. Previous studies have investigated the mechanical properties and electrical conductivity of Al- Fe-based alloys. However, comparative studies on the effects of changes in the Fe and Mg contents and Si addition on microstructural evolution, texture evolution, and mechanical and electrical properties remain limited.
In our previous study, cold drawing was applied to an Al-Fe-Mg-Cu-B alloy.13) The alloy was designed based on a conventional Al-Fe alloy for conductor applications by adjusting the Fe content and adding Cu and B. The tensile strength of the Al alloy wire before drawing was 132 MPa and increased to 288 MPa after 22 drawing passes, reaching approximately 2.2 times the initial value. In contrast, the electrical conductivity decreased from 59.4 %IACS before drawing to 56.6 %IACS after 22 drawing passes. In the present study, a new Al-Fe- Mg-Cu-B-Si alloy was designed based on the previously reported Al-Fe-Mg-Cu-B alloy by reducing the Fe and Mg contents and introducing Si. The same cold drawing process was then applied to both alloys, and their microstructure, texture, hardness, tensile properties, and electrical conductivity were comparatively evaluated. In addition, the microstructural evolution during cold drawing was investigated using SEM/ EBSD analysis, and the microstructural characteristics were compared with those of the previously reported alloy to discuss the influence of the modified alloy composition, including the addition of Si. Based on these results, the applicability of the newly developed alloy as a next-generation Al conductor material was evaluated.
2. Experimental Procedure
2.1. Cold Drawing Process
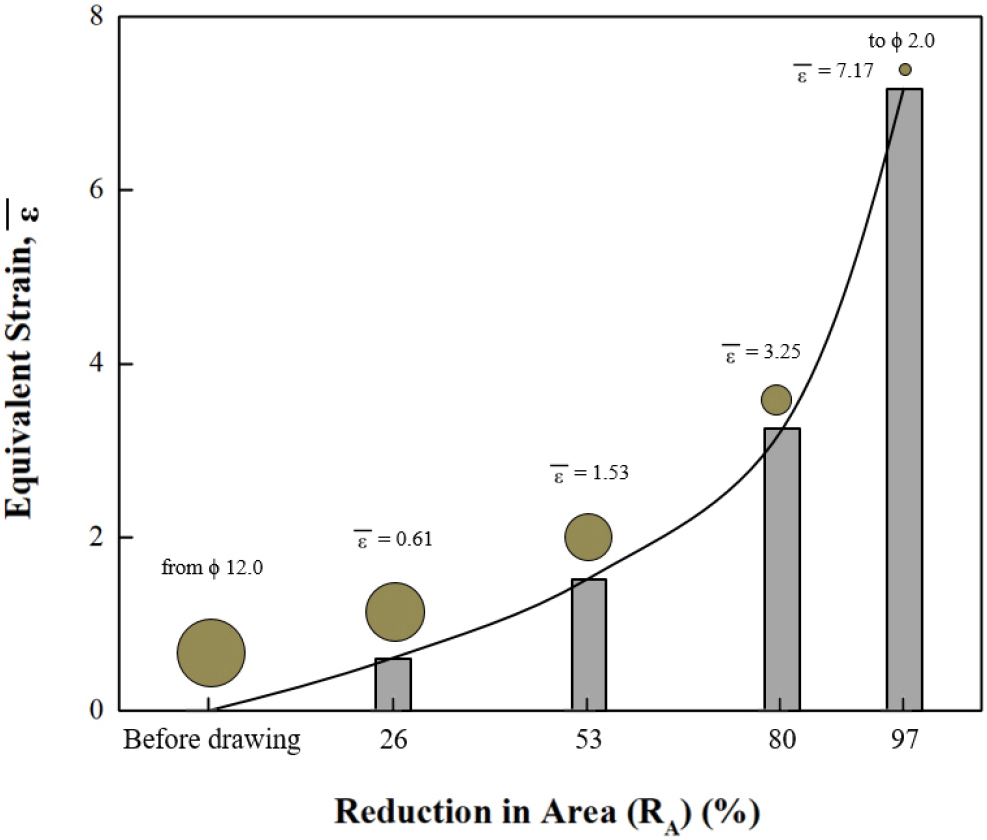
The Al-Fe-Mg-Cu-B-Si alloy was used for the cold drawing process in this study. The detailed chemical composition of the alloy is listed in Table 1. The alloy was fabricated into an Al rod with a diameter of 12 mm through casting and extrusion processes, followed by annealing at 400 °C for 30 min to eliminate the residual deformation introduced during processing before drawing. Subsequently, the rod was cold drawn to a final diameter of 2.0 mm through 22 drawing passes at a constant drawing speed of 753 mm/s at room temperature. To investigate the microstructure, mechanical properties, and electrical conductivity as a function of the drawing process, specimens were collected after 3, 6, 12, and 22 drawing passes. The corresponding reduction in area (RA) values were 26 % (φ10.3 mm), 53 % (φ8.2 mm), 80 % (φ5.35 mm), and 97 % (φ2.0 mm), respectively. During the drawing process, plastic deformation was assumed to satisfy the condition of constant volume, which is expressed by Eq. (1).
Table 1.
Chemical compositions of previously reported and newly designed Al-Fe base alloy (wt%).
| Alloys | Al | Fe | Mg | Cu | B | Si |
| Previously reported Al-Fe base alloy | Bal. | 0.7 | 0.2 | 0.2 | 0.1 | - |
| Newly designed Al-Fe base alloy | Bal. | 0.3 | 0.05 | 0.2 | 0.1 | 0.1 |
The principal strains are denoted by ε1, ε2, and ε3, respectively. Since the drawing process involves axisymmetric deformation, ε1 = ε2 is satisfied. The true strain in the drawing direction was calculated using Eq. (2) as follows:
where L0 and L represent the lengths before and after drawing, respectively, and A0 and A denote the cross-sectional areas before and after drawing. The equivalent strain () was calculated using Eq. (3).14)
The accumulative equivalent strain of the Al wire during the cold drawing process was calculated using Eq. (3), and the results are presented in Fig. 1.
2.2. Characterization
To investigate the microstructural and texture evolution during the cold drawing process, specimens were extracted from the center of the drawn Al alloy wire, and longitudinal sections parallel to the drawing direction were prepared. The specimens were electropolished using an electrolyte consisting of HClO4 : CH3CH2OH = 1 : 9 at -5 °C under an applied voltage of 20 V. The microstructure and texture were subsequently characterized using a field-emission scanning electron microscope (FE-SEM, JEOL JSM-7001F) and electron backscatter diffraction (EBSD, HITACHI SU-6600). EBSD measurements were performed over an area of 300 × 200 µm2 with a step size of 0.25 µm. The acquired EBSD data were analyzed using TSL OIM Data Collection ver. 3.5.
The mechanical properties were evaluated by hardness and tensile tests at room temperature. Hardness measurements were performed using a micro-Vickers hardness tester under a load of 0.05 kgf with a dwell time of 10 s. The hardness was measured from the center toward the outer region of the wire along a longitudinal section parallel to the drawing direction. Tensile specimens were prepared by cutting the drawn wire into 250 mm lengths. Tensile tests were conducted using a universal testing machine with a gauge length of 150 mm at room temperature under a constant strain rate of 1 × 10⁻³ s-1 until fracture.
For the evaluation of the electrical properties, the electrical resistance was measured at two locations separated by 100 mm on the wire. The electrical resistivity was calculated using Eq. (4), and the calculated resistivity was subsequently converted into %IACS using Eq. (5).15)
where ρ is the electrical resistivity (Ω・m), R is the electrical resistance (Ω), A is the cross-sectional area of the specimen (m2), and L is the measurement length (m).
3. Results and Discussion
3.1. Microstructure
Fig. 2 shows the SEM/EBSD results illustrating the microstructural evolution of the drawn Al wire as a function of RA. The texture evolution during the drawing process was analyzed using radial direction (RD) and drawing direction (DD) maps. As shown in the figure, the specimen before drawing mainly exhibited a recrystallization texture characterized by the {001}<100> orientation, although the {110}<111> component, which is a typical deformation texture (fiber texture), still remained. In contrast, after RA = 26 %, the fraction of the {110}<111> component gradually increased, and this tendency became more pronounced with increasing drawing reduction.
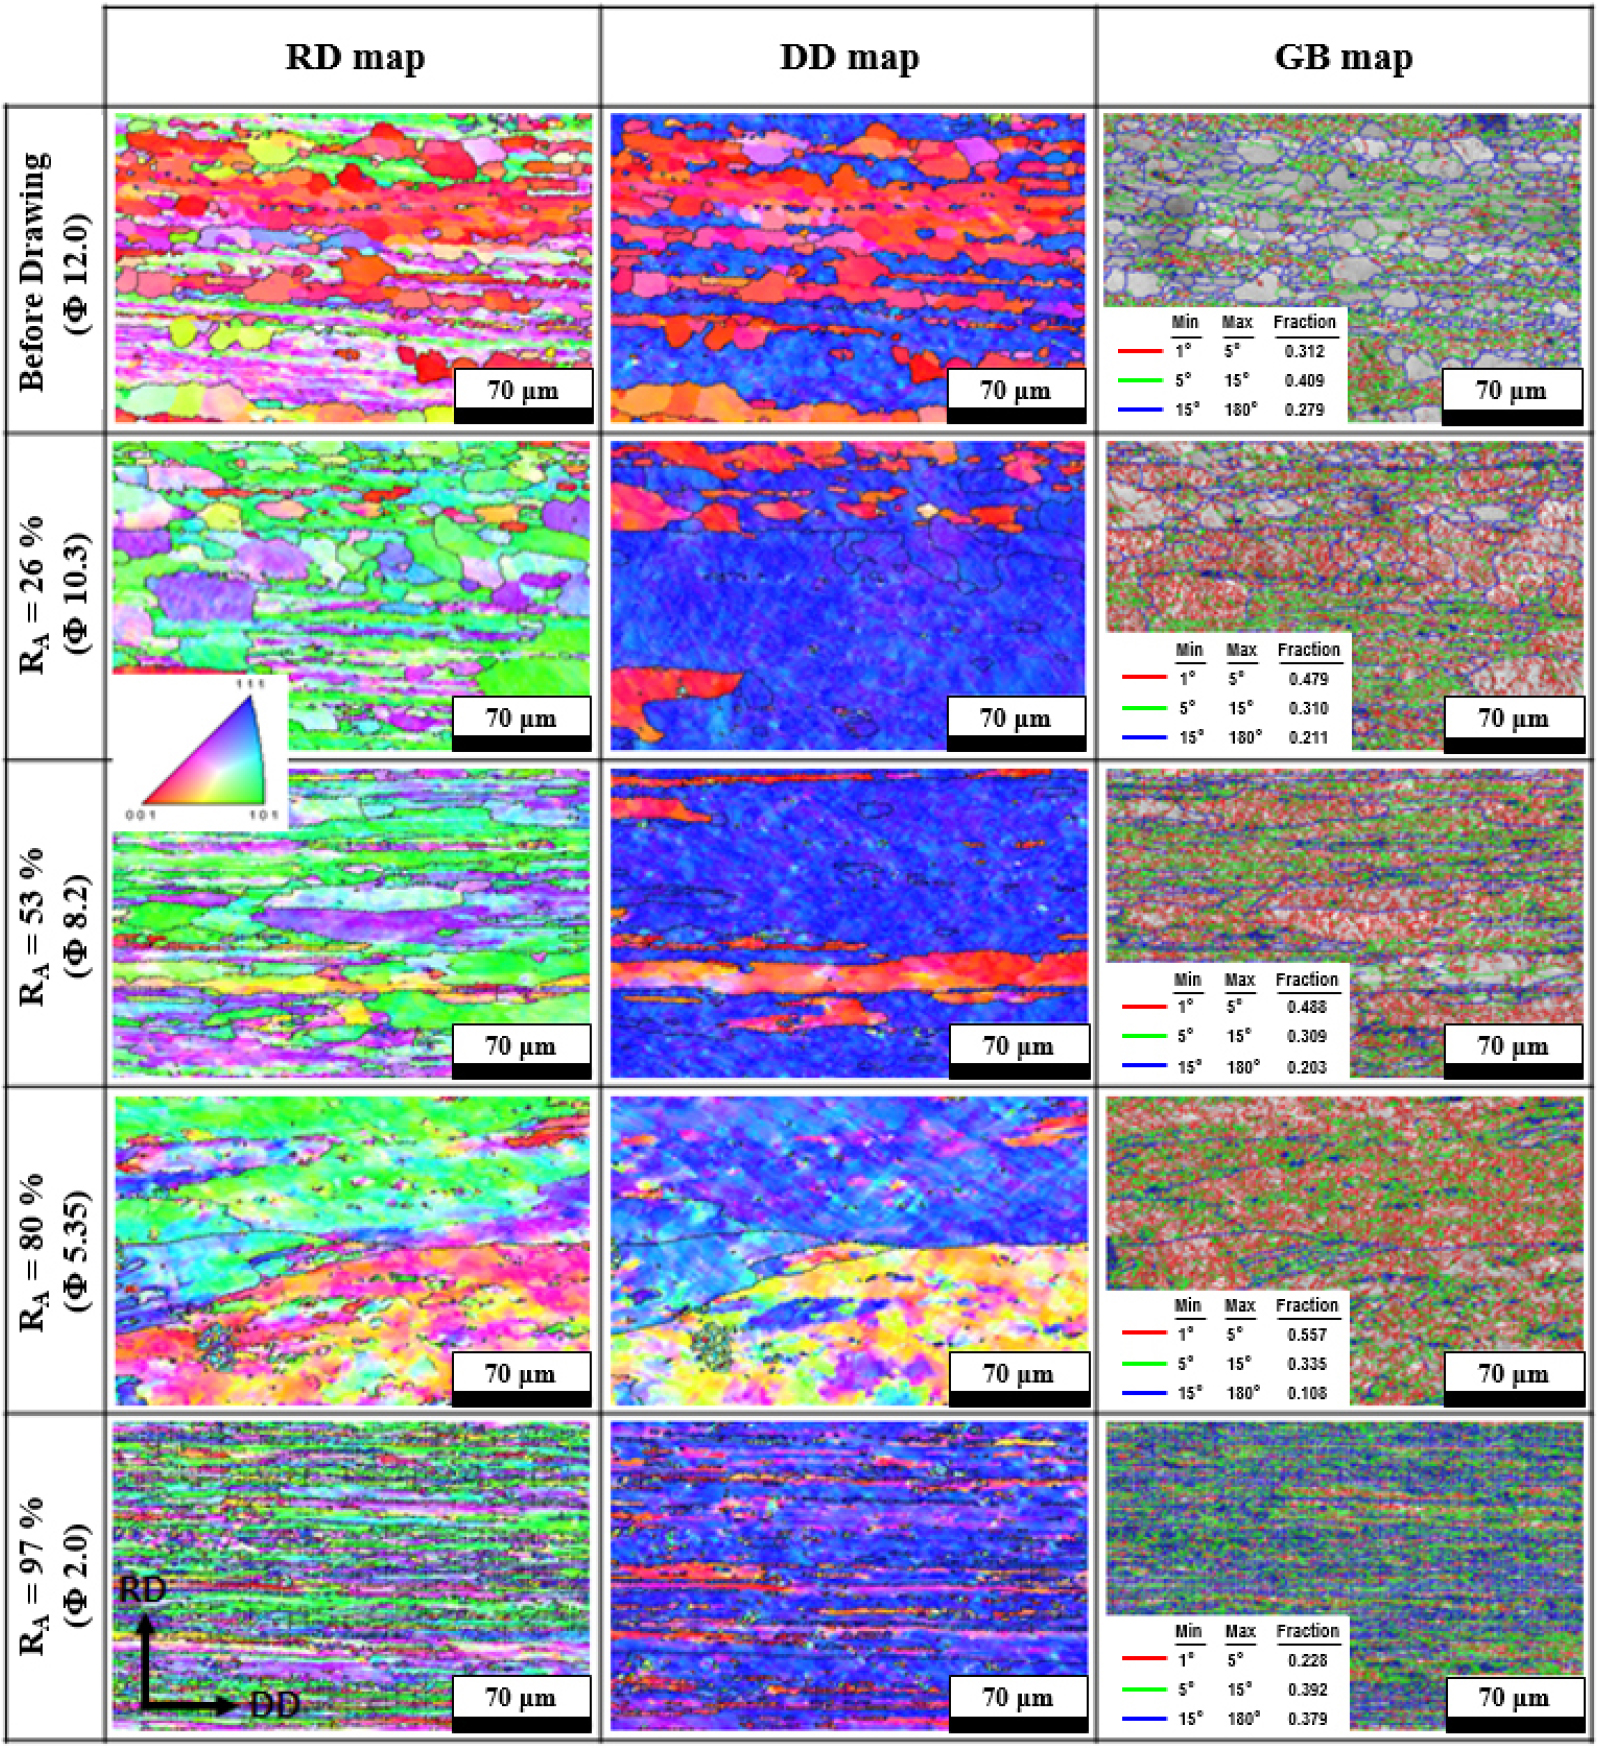
As indicated by the arrows in the figure, the specimen before drawing contained newly formed, clean equiaxed recrystallized grains produced by annealing, while a certain amount of the deformation microstructure still remained. In addition, the fraction of low-angle grain boundaries (LAGB, 2°-15°) was 72.1 %, which was higher than that of high-angle grain boundaries (HAGB > 15°, 27.9 %). At RA = 26 %, the LAGB fraction increased slightly to 78.9 % compared with the specimen before drawing, and a high density of dislocations and subgrains was observed within most grains. This behavior is attributed to the continuous accumulation and rearrangement of dislocations during repeated plastic deformation induced by cold drawing, leading to the formation of subgrains.
At RA = 53 %, the grains became more elongated along the drawing direction than those at RA = 26 %, while the LAGB fraction continued to increase and the HAGB fraction gradually decreased. At RA = 80 %, the elongated deformation microstructure became more pronounced. The LAGB fraction further increased to approximately 89 %, whereas the HAGB fraction markedly decreased to approximately 10 %. These results clearly indicate the continuous accumulation of dislocations and the progressive formation of subgrains during the drawing process.
However, at RA = 97 %, the elongated deformation microstructure was retained, whereas the HAGB fraction increased again. This phenomenon is presumed to result from deformation heat generated during severe repeated drawing, which promoted dislocation migration and rearrangement, thereby facilitating the transformation of subgrains into HAGB.
Meanwhile, compared with the previously reported Al-Fe- Mg-Cu-B alloy, the alloy used in the present study was designed with reduced Fe and Mg contents and the addition of Si.13) In the previously reported alloy, the specimen before drawing exhibited a recrystallized structure consisting of equiaxed grains, with a HAGB fraction of approximately 43 %. In addition, numerous fine subgrains remained within the coarse grains. However, the present alloy exhibited a high LAGB fraction of 72.1 % even before drawing. Although both alloys developed deformation structures with grains elongated along the drawing direction as the RA increased, differences were observed in the initial grain boundary characteristics and their evolution during drawing. In this Al-Fe-Si alloy, Si has been reported to affect the formation and distribution of Fe-containing intermetallic compounds, including Al-Fe-Si phases.16) These second-phase particles may also influence the migration of grain boundaries and subgrain boundaries.17) Therefore, from a microstructural perspective, the Si addition in the present alloy may have contributed to the development of deformation substructures and grain boundaries during cold drawing through its influence on Fe-containing constituent particles.
3.2. Mechanical Properties
Fig. 3 shows the hardness distribution along the radial direction of the drawn Al wire [Fig. 3(a)] and the variation in the average hardness as a function of the reduction in area [Fig. 3(b)]. Before drawing, the specimen exhibited a relatively uniform hardness distribution across the radial direction, with an average hardness of approximately 28 Hv. At RA = 26 %, the hardness increased to approximately 33 Hv compared with that of the specimen before drawing, and the hardness distribution across the radial direction also became more uniform. At RA = 53 % and 80 %, the average hardness increased progressively to 35 Hv and 41 Hv, respectively. Finally, the hardness of the RA = 97 % specimen increased markedly, reaching an average hardness of 49 Hv.
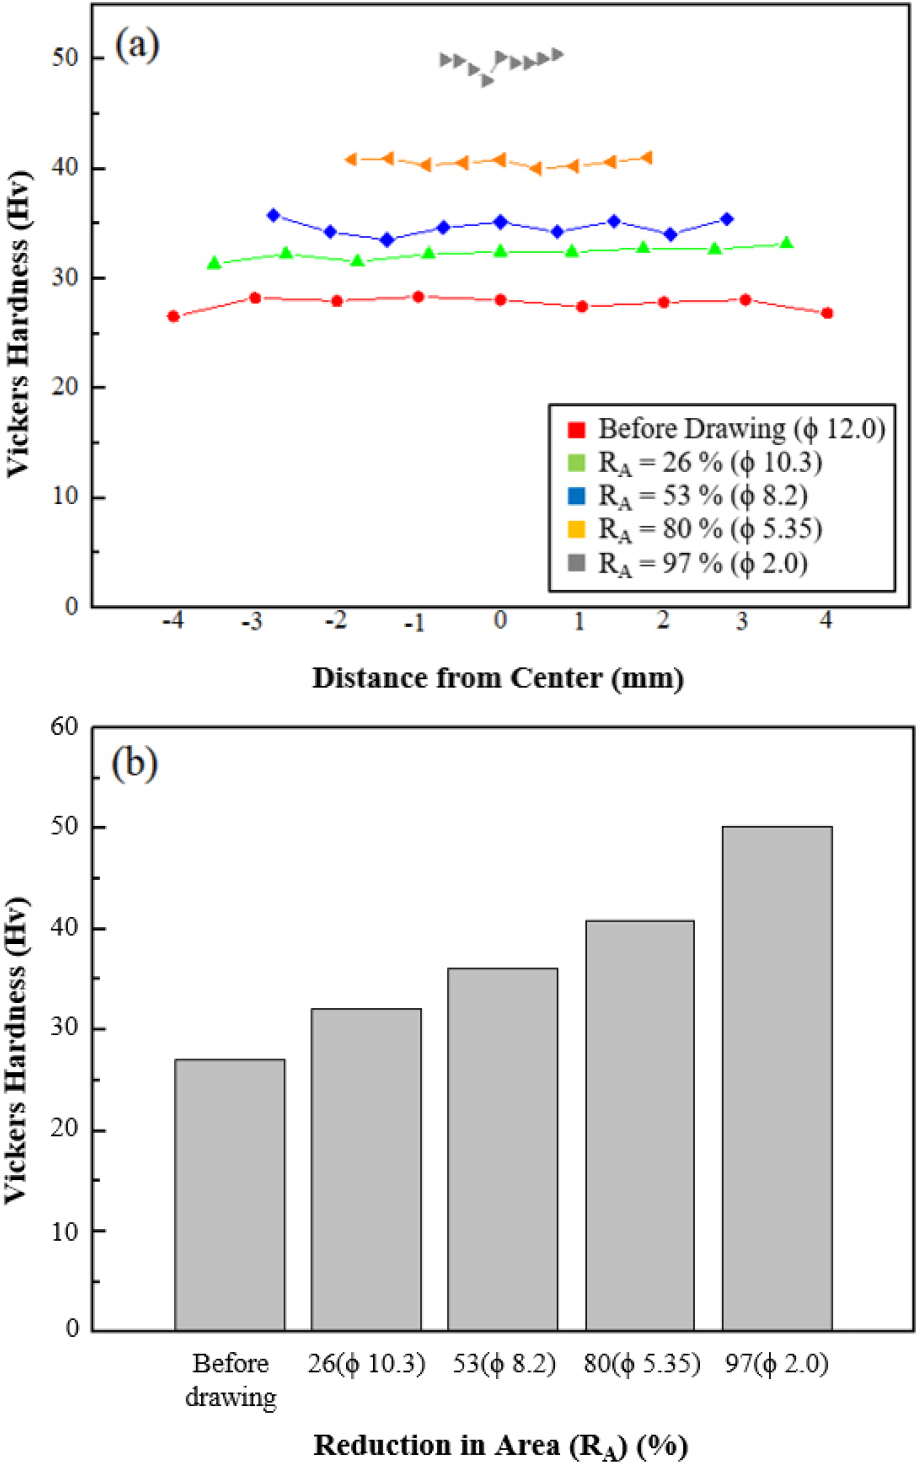
Fig. 4 shows the nominal stress-nominal strain curves [Fig. 4(a)] and the mechanical properties [Fig. 4(b)] of the Al alloy wire as a function of the reduction in area during the cold drawing process. Before drawing, the Al wire exhibited a tensile strength of 119 MPa, a yield strength of 37 MPa, and an elongation of 20 %. As the drawing process progressed, both the tensile strength and yield strength increased, reaching 280 MPa and 220 MPa, respectively, at RA = 97 %. In contrast, the elongation continuously decreased with increasing drawing reduction, from 20 % before drawing to approximately 0.9 % at RA = 97 %. This behavior is considered to result from continuous work hardening caused by repeated plastic deformation during the cold drawing process.
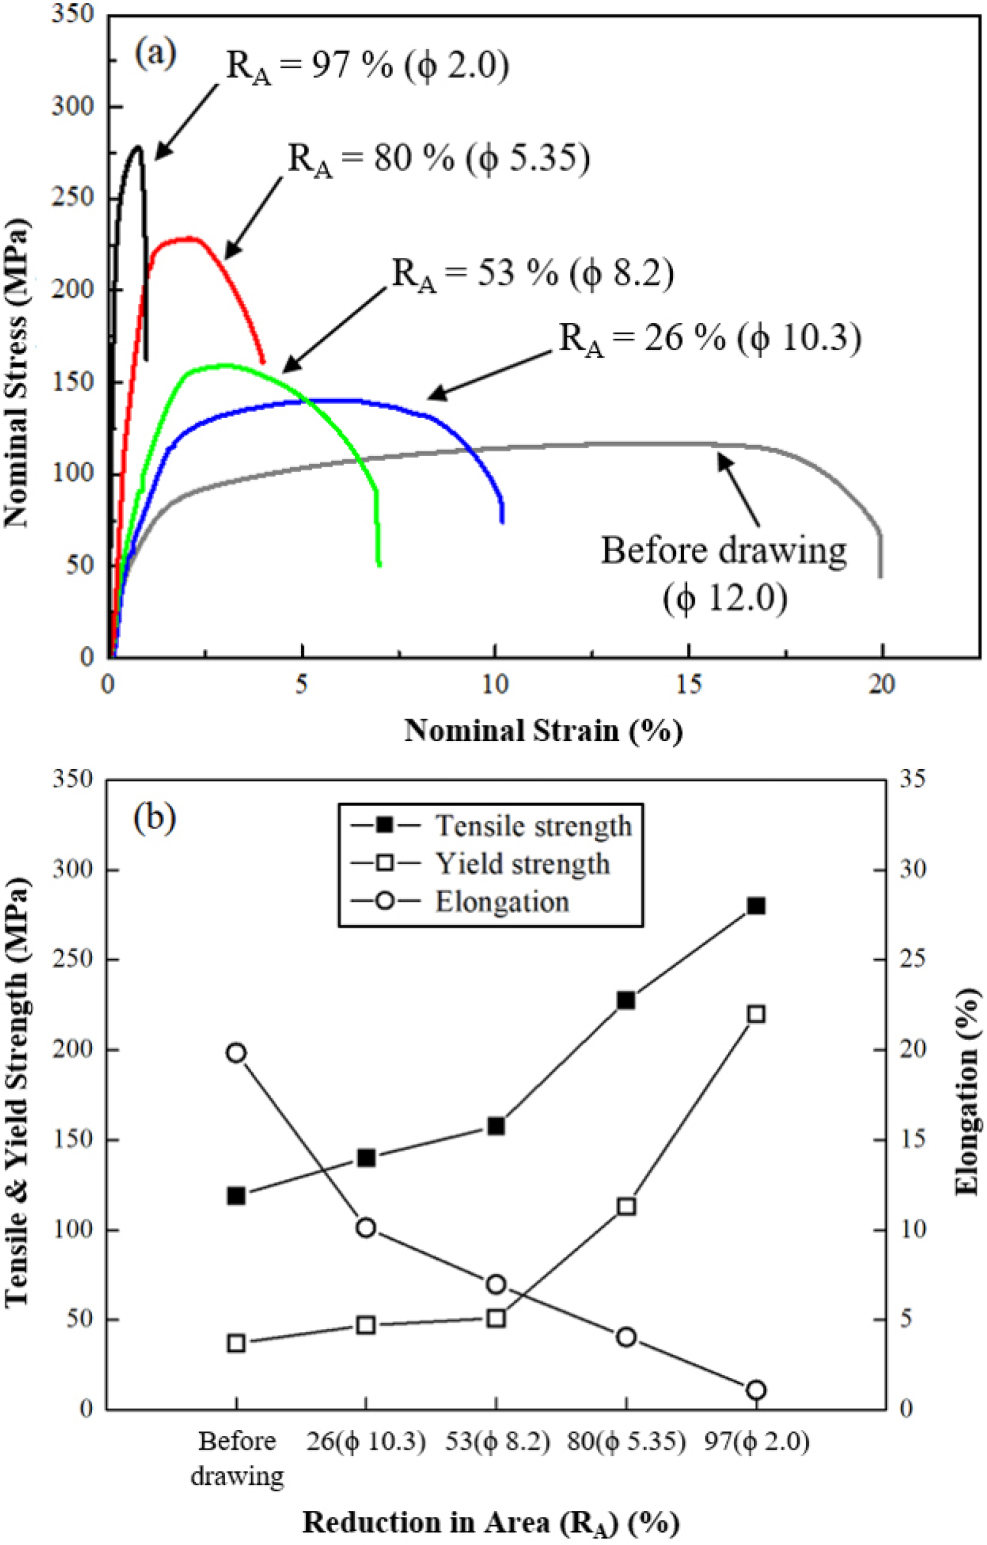
As shown in Fig. 4(b), the tensile strength increased continuously with increasing drawing reduction. In contrast, the yield strength increased gradually up to RA = 53 %, followed by a marked increase after RA = 80 %, reaching its maximum value at RA = 97 %. A notable feature is that the difference between the tensile strength and yield strength remained relatively large up to RA = 80 %. This is considered to result from the relatively low level of work hardening accumulated during the drawing process, allowing additional work hardening to occur readily during the subsequent tensile test. Consequently, a relatively large difference between the tensile strength and yield strength was maintained. In contrast, for the RA = 97 % specimen, work hardening had already progressed sufficiently during the drawing process, thereby limiting the additional work-hardening effect associated with subsequent plastic deformation. As a result, the difference between the tensile strength and yield strength decreased. These changes in the mechanical properties with increasing drawing reduction are in good agreement with the microstructural evolution shown in Fig. 2.
3.3. Electrical Properties
Fig. 5 shows the variation in the electrical conductivity of the Al-Fe-Mg-Cu-B-Si alloy wire as a function of the reduction in area during the cold drawing process. For comparison, the electrical conductivity of the Al-Fe-Mg-Cu-B alloy reported in our previous study is also included. Both Al alloy wires exhibited a slight decrease in electrical conductivity with increasing drawing reduction. However, the Al-Fe-Mg-Cu- B-Si alloy developed in the present study exhibited higher electrical conductivity than the previously reported Al-Fe- Mg-Cu-B alloy under all drawing conditions. In addition, the decrease in electrical conductivity during cold drawing was minimal for both alloys, and the electrical conductivity of the Al-Fe-Mg-Cu-B-Si alloy showed almost no decrease throughout the drawing process.
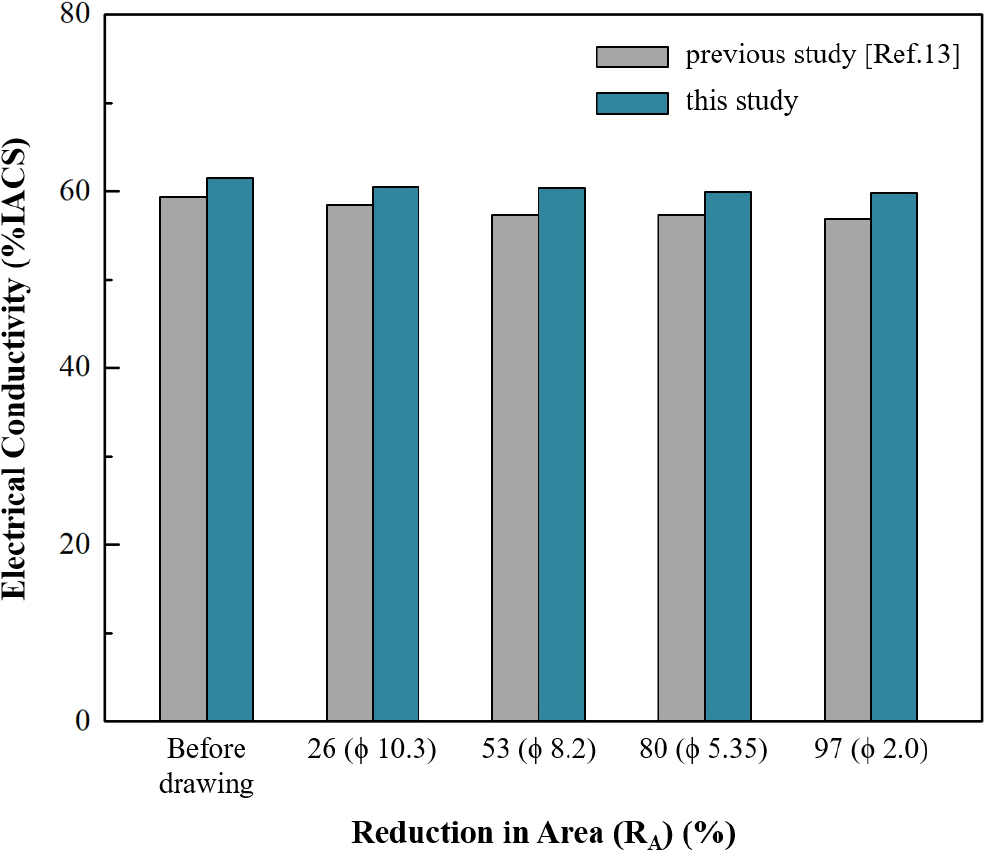
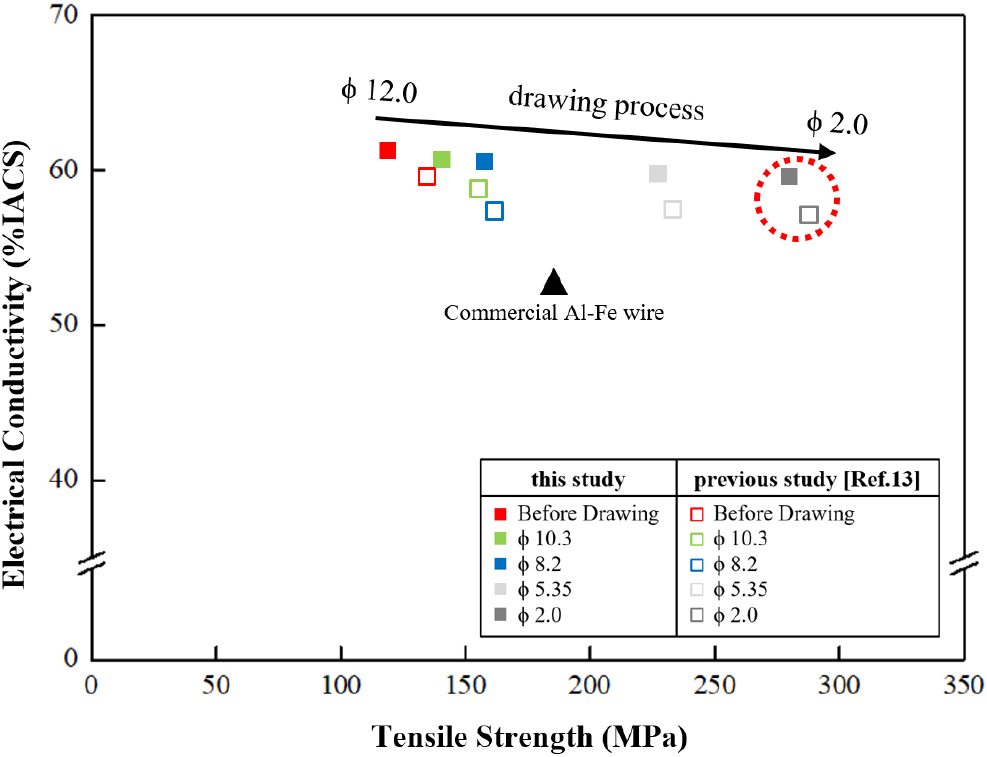
Fig. 6 shows the relationship between the tensile strength and electrical conductivity of the Al alloy wire as a function of the reduction in area during the cold drawing process. For an objective comparison with the present study, the results of the previously reported cold-drawn Al-Fe-Mg-Cu-B alloy and the property values of commercial Al-Fe-based alloy wires are also included. As RA increased, the electrical conductivity decreased only slightly, whereas the tensile strength increased markedly, showing a clear inverse relationship between the two properties. Therefore, the present Al alloy wire is capable of achieving a significant improvement in mechanical strength while maintaining a practical level of electrical conductivity through the cold drawing process, indicating its strong potential for application as a high- strength aluminum conductor material.
4. Conclusion
In this study, a new Al-0.3 wt%Fe-0.05 wt%Mg-0.2 wt% Cu-0.1 wt%B-0.1 wt%Si alloy was designed to improve strength and electrical conductivity. The effects of cold drawing on the microstructure, mechanical properties, and electrical conductivity of the Al alloy were systematically investigated, and the following conclusions were obtained.
(1) As cold drawing progressed, the initial recrystallization texture gradually transformed into a deformation texture, accompanied by grain elongation along the drawing direction and the preferential development of the {110} <111> texture component.
(2) As RA increased, the fraction of LAGB increased from 72.1 % to 89.2 %. Under the final drawing condition, some subgrains transformed into high-angle grains, resulting in a renewed increase in the fraction of HAGB.
(3) As RA increased, the average hardness increased by approximately 75 %, from 28 Hv to 49 Hv, and the tensile strength increased from 119 MPa to 280 MPa, reaching approximately 2.4 times the initial value, whereas the elongation decreased from 20 % to 0.9 %.
(4) The yield strength increased from 37 MPa to 220 MPa with increasing RA. In particular, it increased markedly after RA = 80 %, and under the final drawing condition (RA = 97 %), the difference between the tensile strength and yield strength decreased because the additional work- hardening effect associated with subsequent plastic deformation became limited.
(5) The electrical conductivity of the Al alloy decreased only slightly from 61.6 %IACS to 59.7 %IACS with increasing RA, while maintaining a high level of electrical conductivity even under the final drawing condition (RA = 97 %).