


1. Introduction
Electronic devices have become increasingly integrated into ever smaller spaces. It is therefore becoming more critical to dissipate the heat generated efficiently from the insides of devices, as failure adequately to discharge residual heat to the outside environment can cause heat damage or even a fire.1) Particularly, when applying heatdissipating structures to light-emitting diodes and electronic device housing units, it is necessary to develop polymer composites with high thermal conductivity; and which also have relatively simple processing conditions and a good degree of product flexibility.2) These advanced thermally conductive polymer composites are typically fabricated by mixing thermally conductive fillers such as metals, ceramics and carbons into a polymer resin.3)
Recently, nanocarbon fillers such as graphene and carbon nanotubes are receiving more attention due to their excellent thermal conductivity between 1950 and 7000 W/m·K.4-7) However, when a polymer matrix is mixed with nano-carbon fillers, incomplete contact can be produced at the interface between the nano-filler and the polymer matrix, or between the nanofillers themselves.6,12) As a result, it has been reported that this incomplete contact can produce interfacial thermal resistance and thermal contact resistance, resulting in phonon scattering and low thermal conductivity near the lower bound of the rule of mixture.6,12-14) In addition, the high price of nano carbon fillers compared to other types of thermal conductive fillers is an obstacle to the commercial use of thermally conductive polymer composites containing nanocarbon fillers.
Expanded graphite(EG) is a carbon material with the unique structure of graphite sheets with interlayer spacings. When filled within polymers, it can become distributed inside the composite in an efficient manner, forming a thermally conductive network. Noh and Kim15) evaluated the thermal conductivity of thermally conductive polymer composites filled with various carbon fillers such as EG, pitch-based carbon fiber, graphite, graphene nanoplatelet, multi-walled carbon nanotube and carbon black. They reported that the polymer composite filled with EG fillers showed the best performance in terms of thermal conductivity. 15) In addition, given that EG is one of the most cost-effective carbon fillers, it is highly advantageous to use from a commercialization perspective.
Recently, graphite, such as expanded graphite have attracted much attention in thermal management due to their excellent thermal properties. Specially, artificial graphite films with high thermal conductivity(TC) (1100- 1600W/mK) have become commercially available for heat removal in electronic devices containing integrated circuits, such as personal computers and mobile phones.7) Unfortunately, so far, little attention has been paid to the potential of these graphite films being used as effective reinforcements in composites. Actually, if these graphite films are used as reinforcements to form expanded graphite /metal composites and fabrication processes of the composites are well-designed and well-controlled, high TC can be expected. Furthermore, if we use graphite films and metal foils as raw materials to fabricate graphite film/metal laminate composites, we can easily control the distributions and orientations of the reinforcements by controlling the stacking of expanded graphite and metal foils, which is easier and more effective as compared to carbon fiber/metal composites, graphite flake/ metal composites, carbon nanotube/metal composites and graphene/ metal composites, which may simplify the fabrication process and meanwhile obtain composites with higher thermal properties.
In this study, we successfully fabricated these novel graphite/ aluminum laminate composites with high TC. The effects of oxide films on the surface of aluminum foils and volume fraction of graphite films on microstructures and properties of the composites were investigated and discussed. The microstructures of the composites were characterized at length scales from the macro down to the nanoscale to investigate the distribution and orientation of the graphite films, and the graphite/Al interfacial structure and the presence of harmful reaction product. Furthermore, the thermal conductivities of the as-fabricated composites were compared with the predicted values calculated by rule of mixture and results of other kinds of aluminum/expanded graphite(Al/EG) composites reported in the literatures.
2. Experimental
2.1. Synthesis of expanded graphite composite
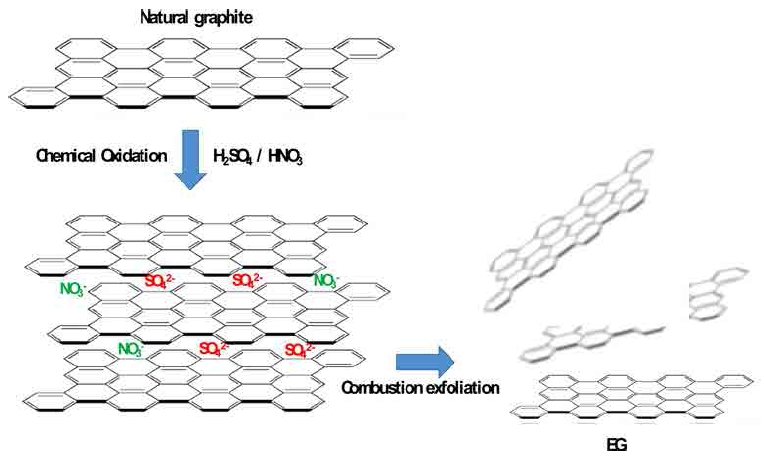
Natural flake graphite(NG) was dried at 60 °C in a drying oven for 24 h before being mixed and saturated with nitric acid and sulfuric acid at a volume ratio of 1:3:9. The mixture was then stirred for 6 h. During this time, a nitric acid/sulfuric acid/graphite intercalation compounds were formed. Expanded graphite(EG) was subsequently obtained by washing the product with water followed by dehydration until the pH value reached 6.0- 7.0 and drying in an oven at below 70 °C for 24 h. Then, an appropriate amount of red phosphorus was added to the graphite intercalation compounds(GICs), which was subsequently placed into an exposable container. During the explosive combustion process, the GICs rapidly expanded and EG was obtained. The red phosphorus was sourced from expired ammunition, and its burning temperature is approximately 900 °C. In this system, HNO3 not only functions as intercalate but also provides acidity to promote the oxidation ability of H2SO4. The GICs was exfoliated through rapid heating at an instantaneous high temperature, leading to the breakdown of the bonds between the interaction compounds and functional groups. As a result, the residual compounds decomposed and spilled swiftly, thereby forming the well- developed network pores in the EG. The proposed scheme was shown in Fig. 1.
2.2. Composite fabrication
In the second step, Al/EG(SA) composites were prepared. For this process, the specified amount of EG was dispersed in acetone under intensive ultrasonic treatment. Then, previously prepared form-stable SA composite was added to EG/acetone suspension. To guarantee the dispersion of EG uniformly into SA composite, the suspension was continually stirred for 3 h with a magnetic stirrer. In order to remove the acetone thoroughly, the obtained mixture was maintained in an oven at 60 °C for 6 h. Three kind of composite SA were prepared SA1, SA2 and SA3 by different the amount of the material(Table 1).
2.3. Measurement and characterization methods
X-ray diffraction(XRD) of the SA composites was carried out by a Rigaku X-ray diffractometer(Model No. P.DD966) with CuKα radiation at 40 kV and 150 mA. The morphology of the EG were investigated by using a field emission scanning electron microscope(JEOL-JSM- 5800). The transient place source(TPS) method was applied to measure the thermal conductivity of the nanocomposites by a Hot Disk thermal analyzer(Hot Disk 2500- OT, Uppsala, Sweden). Based on this method, a diskshaped sensor with the diameter of 2.005 mm was fixed between two round samples with the diameter of 25 mm and thickness of 4 mm. P2400 SiC paper was used to smooth the composites’ surface for the purpose of good thermal contact. The electrical conductivity of the samples with the thickness of 4 mm was measured with a Keithley 6487 picoammeter under a constant voltage of 1 V in order to avoid strong electric current within the specimen.
3. Results and discussion
3.1. Characterization
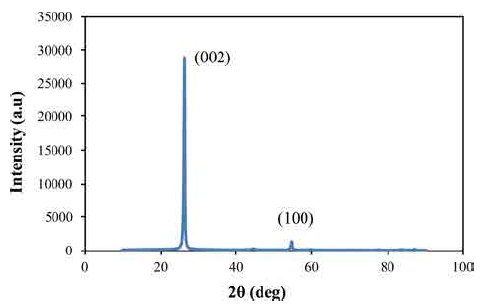
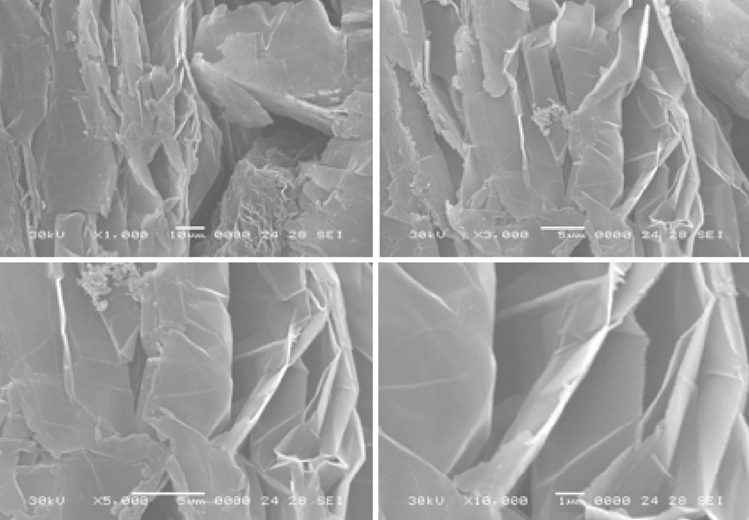
Fig. 2 shows the XRD curves of pure EG. In the pattern of EG, diffraction peaks are observed at 2θ = 26.5°, 42.2° : these peaks can be indexed to the graphite (002) and (100), faces, respectively(JCPDS No. 41-1487), which is representative of EG in the crystalline phase. In addition, Fig. 3 displays the SEM image of pure EG. The rippled and fluffy nature of thermally-exfoliated graphite sheets, which is used as the starting material of EG composite. Some scrolling of the EG sheets are caused by thermal exfoliation. EG shows abundant pores of different sizes ranging from scores of nanometers to a few micrometers, providing enough space for storage and volume expansion of Al as well as a conductive network for lithium ion transport at large distances. In addition, these results show that the bulk of the surface structure is bulked and retains the large valley and net plane structure. The results of the expansion show that increasing the expansion temperature to 400 to 800 °C increases the degree of swelling at temperatures lower than 200-400 °C.
3.2. Physical properties
3.2.1. Compressive strength
Maximum stress of material which can withstand under compressive load. The compressive strength of a material broken into fragments can be defined in a narrow sense as an independent property. However, the compressive strength of non-compressible materials must be defined as the amount of stress required to distort any amount of material. In compressive tests, the compressive strength is calculated by dividing the maximum load by the initial cross-sectional area of the specimen.Table 2Table 3
Table 2
The compression strength of SA1, SA2, and SA3 samples.
| Sample name | After heat treatment | Before heat treatment |
|---|---|---|
| SA1 | 28 | 10 |
| SA2 | 26 | 6 |
| SA3 | 26 | 4 |
Table 3
The results of wear rate measurement.
| Sample name | Run | Wear amount (mg) | Abrasion rate (%) |
|---|---|---|---|
| SA1 | 1 | 95 | 0.366 |
| 2 | 594 | 2.58 | |
| 3 | 347 | 1.498 | |
| Average | 345 | 1.481 | |
| SA2 | 1 | 110 | 0.468 |
| 2 | 181 | 0.726 | |
| 3 | 538 | 1.654 | |
| Average | 276 | 0.949 | |
| SA3 | 1 | 61 | 0.251 |
| 2 | 3 | 0.027 | |
| 3 | 53 | 0.294 | |
| Average | 39 | 0.106 | |
The compressive strength according to the content of binder was measured and the results were summarized in the table above. Before and after the heat treatment, they showed different intensity values of 2-3 times. According to the results, the strength value was decreased as the binder content increased. This indicates that the sand, which is the main material of concrete, has a great effect on the strength value. The addition of copper as a metal and the addition of aluminum resulted in a relatively high strength value when copper was added. Wear test was carried out to predict the wear performance and the results were presented in Table 2. The wear rates are calculated results reflecting wear mass loss. As the result, the survey samples were shown the low abrasion rate around 1.481-0.949 %. It was observed that the mass of material lost due to wear is relatively small. The above results indicated the relatively durable state of survey samples according to the test condition.
3.2.2. Shore hardness
Shore hardness was limited in 1906 by the impact method to stipulate the hardness since it was found that the brinell sphere caused a strain on the quenched steel of A.F. Shore. The Shore hardness test shows a hardness value based on the rebound height of a hammer dropped vertically against a test piece at a constant height. The average height of rebound in quenched high carbon steel was set to 100 on the scale plate when a hammer with a diameter of about 2.4 g was dropped at a height of 254 mm with a spherical diamond tip at the tip, 10. However, the relationship between the shape of the diamond tip and the repulsive ratio of the hammer and the hardness value was not specifically disclosed. Although there is ambiguity in the definition of the hardness value from the outset, it has been widely used as an inspection tool on the spot because the operation of the testing machine is simple and the test is performed quickly and the price of the testing machine is low and light. This device is also called a scleroscope and unlike the static indentation test, the load acts dynamically.
Typical features of the Shore hardness test include low testing equipment, light weight, easy portability, and very little traces on the test specimens, allowing complete testing of the finished product. In addition, it is possible to measure a relatively small number of test specimens. The Shore hardness tester has a high hardness value when testing a material having a comparatively small difference in elastic modulus, but is unsuitable for a material having a large elastic modulus such as rubber. For example, a hard rubber may have a contradiction that exhibits a shore hardness value greater than steel. However, the elastic modulus and shore hardness are not only proportional to each other. For example, in carbon steel, the hardness varies considerably according to C%, while the modulus of elasticity is largely unchanged.
Shore hardness measurement principle is to measure a small hammer with a diamond of 0.02 in diameter at the bottom of a steel bar with a diameter of 1/4 and a length of 3/4. The hardness of the specimen is measured by reading the scale attached to the inner wall of the tube at the maximum height at which the top of the hammer reaches the top of the specimen when it falls down vertically in the glass tube and protrudes by elasticity. This value is Shore hardness value(Hs). Hs is a value proportional to the height of the hammer dropped at a certain height(falling height) on the surface of the specimen. The Shore hardness is determined from the following equation.
Where, Hs are the shore hardness value, k is Constant for determining shore hardness h is drop height and ho: height of repulsionTable 4
Table 4
The shore hardness of SA1, SA2, and SA3 samples.
| Sample name | After heat treatment | Before heat treatment |
|---|---|---|
| SA1 | 55 | 27 |
| SA2 | 56 | 17 |
| SA3 | 55 | 31 |
Shore hardness was measured by the content of binder and the results were summarized in the table above. Before and after the heat treatment, they showed many differences. This shows that the heat treatment has a considerable influence on hardness as a variable. According to the results, the hardness value showed a tendency to increase as the binder content increased. It is found that the content of sand and binder, which is the main material of concrete, has a great influence on the hardness value. Compared with the addition of copper as a metal component and the addition of aluminum, the addition of aluminum showed a relatively high hardness value.
3.2.3. Electrical conductivity
It refers to the degree of conductivity, and is also referred to as conductivity, specific conductivity, or conductance. Electrical conductivity is a unit that indicates the ability of a single substance to flow current, whereas a non-electrical conductivity is a unit of electrical conductivity of an object having a unit length or unit area under a specific temperature. The nonconductivity is synonymous with volumetric conductivity and is the reciprocal of the volume resistivity(resistivity-resistivity). The unit of electric conductivity is mho or siemens, and 1 mho = 1 siemen. Since the unit of electrical resistivity is Ohm(Ω), water with an electrical conductivity of 1 μS can be said to have an electrical resistivity of 1,000,000 Ω, ie 1 MΩ. The measurement of electrical conductivity is carried out by flowing current through two special electrode plates. The electrical conductivity is closely related to the amount of dissolved total solids(TDS, Total Dissolved Solids) contained in water. The greater the number of charged ions in water, the greater the electrical conductivity of water. That is, as the ionic concentration in a solution increases, the electrical conductivity of the solution increases, so the electrical conductivity is an indicator of the concentration of ions present in the water. Conductivity is the inverse of resistivity as electrical conductivity. Since the minerals(ions) in water are electricity, the electric conductivity value changes depending on the content of ions. Conductivity is the most common way to measure water purity. If there is a large amount of ions in the water, the electricity is good, and when the ions are completely removed, the water becomes a non-electricity conducting sub-conductor. The electrical conductivity is the degree to which a substance or solution can carry an electric current. It is an index that can quickly evaluate the ionic strength of a solution. It is expressed in terms of the reciprocal of electrical resistance(Ω−1). If a constant voltage is applied to the two electrodes in the solution, the applied voltage causes the current to flow, and the magnitude of the flowing current depends on the conductivity of the solution.Fig. 4Table 5
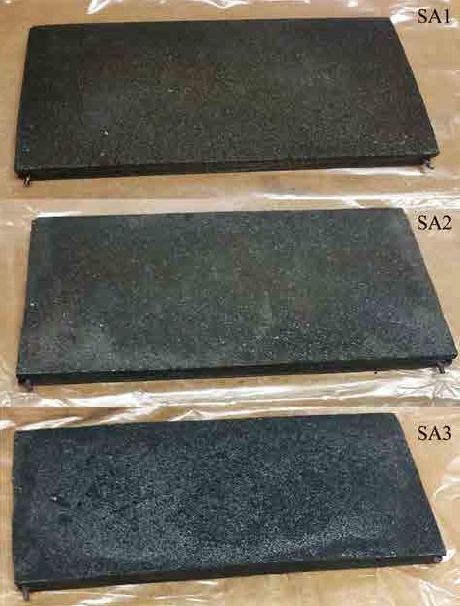
Table 5
The electrical conductivity of SA1, SA2, and SA3 samples.
| Sample name | After heat treatment (X 10−3, Ω·cm) | Before heat treatment (X 10−3, Ω·cm) |
|---|---|---|
| SA1 | 10.27 | 35.8 |
| SA2 | 8.85 | 28.5 |
| SA3 | 8.24 | 21.3 |
The electrical resistivities were measured for each component and the results were summarized in the table above. Before and after the heat treatment, they showed many differences. This shows that the thermal resistivity has a considerable influence on the electrical resistivity. It is judged that the heat treatment parameter has a great influence on the carbonization of the binder and the orientation of the texture structure. According to the results, as the content of binder increased, the electrical resistivity value showed a tendency to decrease overall. It can be seen that the content of sand and binder, which is the main material of concrete, has a great influence on the electrical resistivity value. As a result of the addition of copper as a metal component and the addition of aluminum, it showed a relatively high electrical resistivity value when aluminum was added. In this development, the effect of the copper component on the electrical resistivity is remarkable.
3.2.4. Thermal conductivity
Heat conduction test is a common method of heat flow method. It can be expressed as Fourier’s law in the case of a steady state measured at a constant temperature distribution.
Q; calorie A; area k; thermal conductivity dT; Temperature difference, dx; The Fourier law of distance is not an induction from an equation but an empirical formula. In other words, there is an energy transfer from a high temperature to a low temperature in an object, which is proportional to the temperature gradient(temperature difference at a certain distance) per unit area. In other words, the proportional constant k is introduced, and the - sign is added so that the actual calorie movement does not become a value. The measurement of thermal conductivity was carried out in the following manner. Test specimens are placed in a(2 mm thickness) and b(4 mm thickness), respectively, in the specimen device, and the cooling water is flowed down a certain amount through the flow meter. After turning on the power, raise the temperature by the temperature controller and adjust the cooling water. The temperature of the temperature indicator of the panel was read in order and the value of the steady state was recorded as the test result. The test was carried out 4 to 5 times to determine the measured value. The above procedure was repeatedly measured by changing the specimen.
Thermal conductivity of the SA is shown in Fig. 5. Fig. 5 indicates that with the increase of EG content, the melting temperature of the SA remained almost constant for the composite SA1, SA2, and SA3 respectively, and the latent heat slightly decreased. For the composite SA1, the latent heat decreased by 3.60 %. However, the thermal conductivity of the Al/EG increased with the increase of EG mass fraction even though the increase rate gradually decreased. Compared with values obtained from Refs.11)
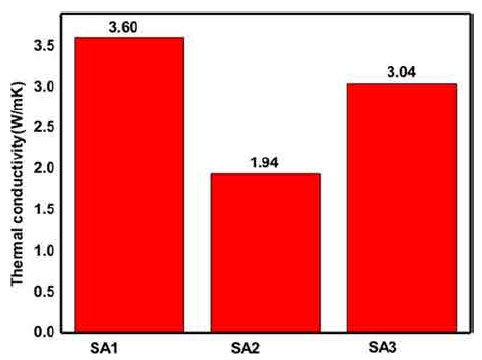
The values of thermal conductivity according to the content of each component were measured and the results were summarized in the table above. The results are shown after heat treatment. It is shown that the content of sand and metal is reduced and the content of binder is increased. As a result, the value of thermal conductivity is significantly influenced by these variables. It is judged that the metal component and the binder primarily affect the carbonization and the orientation of the texture structure. As a result, it is clear that highly resistive sand has a considerable influence on the thermal conductivity. According to the results, as the content of binder increased, the thermal conductivity value showed a tendency to increase overall. It can be understood that the content of sand and binder, which is the main material of concrete, has a great influence on the thermal conductivity value. As a result of the addition of copper as a metal component and the addition of aluminum, the results were comparable on average, and samples SA1 showed relatively high thermal conductivity values. In this development, the effect of increasing the thermal conductivity value of the metal component is remarkable. Table 6 summarizes the thermal conductivity of hybrid nanofluids related studies available in the literature.
Table 6
Summary of hybrid nanofluids thermal conductivity related studies.
| Type of hybrid nanoparticles | preparation method | thermal conductivity increase(%) | Findings | Ref. |
|---|---|---|---|---|
| CNT-Cu | Wet ball milling | 32 | Thermal conductivity from experiment is consistently higher that calculated from model. | [16] |
| MWCNT-Fe3O4 | ultrasonic processor | 23.3 | The thermal conductivity of 0.3 % nanofluid is 13.88 % higher compared to thermal conductivity of base fluid. | [17] |
| CNT/TiO2 | Hydrolysis technique | 16.7 | Thermal conductivity of CNT/TiO2 based nanofluids is temperature and particle weight fraction dependence. | [18] |
| Graphene | Stirring | 8.8 | The nanofluids were stable and the sedimentation of GNPPt hybrid nanofluid was b5.7 % after 22 days. | [19] |
| GO/Fe3O4 | Modified Hummers method | 12.3 | The nanofluid can remain stable for more than five months therefore they have a promising potential for using in industrial applications. | [20] |
The relationship between the time, electric conductivity and thermal conductivity value of each component was measured by using a thermal camera. After annealing, the results of these correlations are shown(Fig. 6). It is shown that the content of sand and metal is decreased and the content of binder is increased. As a result, it shows that time, electric conductivity and thermal conductivity have a considerable influence on the relationship between these values. This indicates that the metal components and the binder mainly affect the carbonization and the orientation of the structure, and secondly, these factors have a great influence on the relationship between time, electric conductivity and thermal conductivity. As mentioned above, it has become clear that the highly resistant sand is a factor that has a considerable influence on the thermal conductivity. The results showed that the thermal distribution increased with increasing binder content. As a result of the comparison between the addition of copper as a metal component and the addition of aluminum, the average values were similar to each other, and samples and SA2 exhibited relatively uniform thermal distribution shapes. This demonstrates the effect of increasing the thermal distribution of the metal component in the developed product.
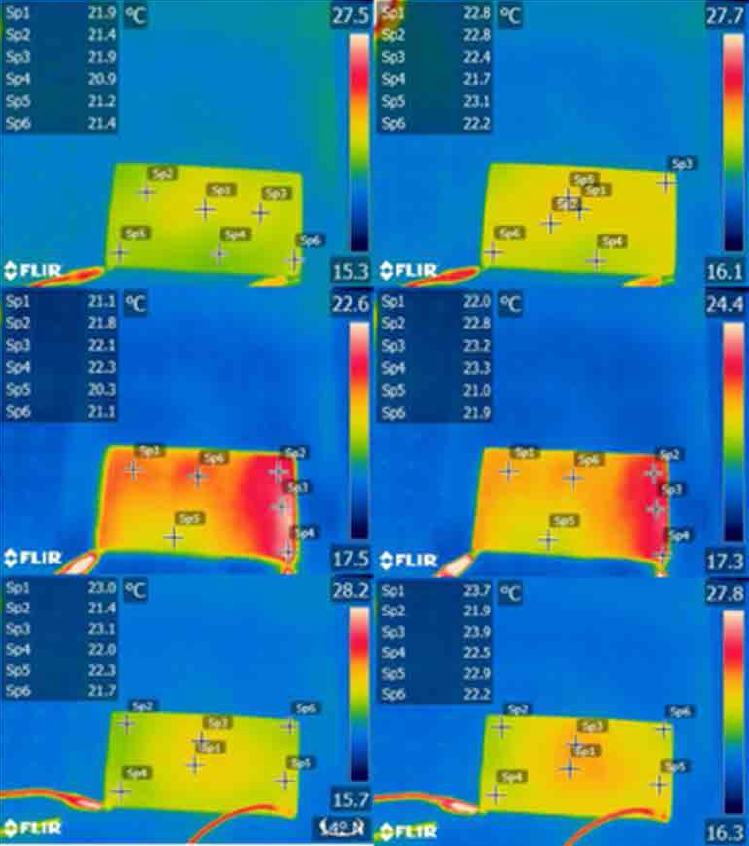
Fig. 6
Infrared camera images of composites filled with the SA during heating and cooling for transiet temperature response and heat transport.
Fig. 6 shows the heat dissipation properties of the composites. This indicates that the composites filled with both the EG was most sensitive to the temperature changes caused by heating and cooling. These results show that the composites with high thermal conductivity values were excellent for heat dissipation and that the heat dissipation trend was consistent with the thermal conductivity trend. 3D thermally conductive filler network are the most critical physical factors for optimizing the thermal conductivity of composites and for maximally tuning their heat dissipation capabilities.
4. Conclusion
Expanded graphite was successfully used as a support material for the immobilization of metal oxides particles. The results showed that the Al-graphite had excellent electrical conductivity, excellent mechanical flexibility and good stability. In this paper, we investigate temperature that affect the thermal conductivity of SA composites with experiments. The following conclusions could be made: Thermal conductivity of SA composites is temperature independent outside the melting range, but increases sharply during the phase change which is a consequence of superb capability of SA in keeping temperature constant. Moreover, the combination of SA can significantly reduce cost due to their low cost. Due to these favorable properties and advantages, the coated composite SA can be considered as a good candidate for low temperature thermal energy storage applications in many fields, such as greenhouse, building energy conservation, textile fibers and thermal protection of electrical devices.