

1. Introduction
N2-getters for nitrogen gas purification can selectively purify residual impurity gas in the activated nitrogen gas by chemical and physical reactions. They are becoming more important as there is a recent growing demand for high purity nitrogen gas of 99.999 % in the petrochemical and semiconductor process industries.1) They can be primarily categorized into evaporable getters and nonevaporable getters.2,3)
The evaporable getter is a getter that evaporates through thermal energy in a vacuum condition forming a reactive layer on a vacuum system, thereby removing the impurities from the vacuum system. As in some cases, the evaporated getter can be impurities within a circulating system at a final stage, the demand for evaporable getters has been decreasing.4)
The non-evaporable getter uses porous-reactive metals containing Zr to selectively remove the impurity in N2 gas through an activation process. This process removes the oxidation layer of the getter formed in manufacturing at an appropriate working temperature of approximately 300 to 400 °C. Therefore, it is mainly used in the semiconductor industry.5)
To manufacture the non-evaporable getters, metals such as Zr, Fe, V, Ti, Mn, Al, and Zn, which have small activation energy, were combined to form an alloy of a specific composition. This melted sample was powdered by the hydride-dehydride process. The powder produced by this process is molded into a pellet and used as a getter.6) For better efficiency, the getter should have open pores with appropriate pore sizes and porosity. While metals such as Zr, Fe, V, Ti, Mn, Al, and Zn are mainly used as components of getters for N2 gas purification, Zr is widely used as getter. This Zr getter usually plays the role of a getter based on the following chemical formulas.7-9)
As shown in Eqs. (1) to (6), the impurity gases including O2, H2, H2O, CO, CO2, and CH4 in N2 chemically react with Zr and are removed through absorption into the Zr surface. However, the N2 gas reacts with Zr, as shown in Eq. (7), thereby losing its functionality as an N2 getter.
According to the binary phase diagram of the Zr–N system,10) Zr exposed to approximately 400 °C in the N2 condition contains 20 at% N during gettering. If more N is used, it rapidly forms ZrN compounds and loses its function as a getter. Consequently, to increase the lifetime as a getter, it needs sectional solid solution saturation of the Zr with N to slow the reaction or stabilize the surface with oxidation products.
Another problem is the possibility of an explosion due to a sudden nitrification reaction during N2 gettering. When a large amount of getters of 400 g or more are added for the gas purification of N2 of more than 20 sccm at 400 °C, the reaction in Equation (7) causes a highly exothermic reaction of ΔH=-365.26 KJ/mol [11]. If this situation continues, the accumulated heat can cause an exothermic reaction of over 2000 °C, resulting in an explosion that can melt not only the getter itself but also the metal container carrying the getters.
Therefore, in this study, it was confirmed for the first time whether the rapid nitrification reaction or the stable oxidation reaction occurred by increasing the temperature up to 550 °C in the 5N low-purity nitrogen purification process using a pure Zr porous getter.
As a result, an stable oxide was formed by dominant oxidation reaction on porous Zr getter by oxygen impurities in 5N low-purity nitrogen atmosphere within the whole range of temperatures up to 550 °C and restrained a rapid nitridation reaction.
2. Experimental Procedure
In this study, Zr powder was prepared to investigate the stabilization of Zr getters at different heat treatment temperatures.
Fig. 1 shows the optical microscope image of Zr powder (99 %, 45 μm, Avention. Co.), Zr pellet used in the experiment, and the SEM microstructure image at the top right. To be specific, Fig. 1(a) shows the optical microscope image of 1 g of Zr powder and Zr bulk powders with an average particle size of 45 um identified through the SEM microstructure at the top right.
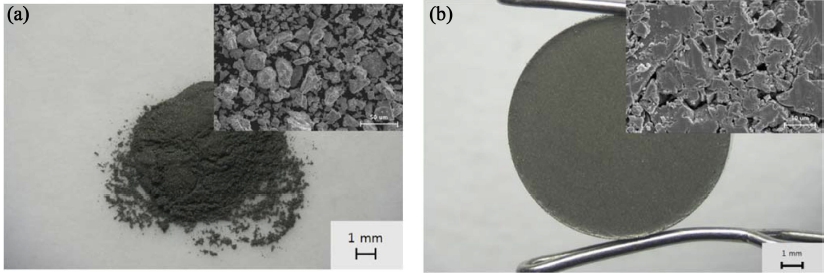
Fig. 1
Optical microscopy images of (a) Zr powder and (b) Zr pellet. Upper-right insets are SEM images.
Fig. 1(b) shows an image of a Zr pellet molded by injecting 1 g Zr powder into a cylindrical stainless mold of 10.00 mm diameter and applying a pressure of 5 ton. The manufactured Zr pellets have a diameter of 10.00 mm and thickness of 2.50 mm, and the FE-SEM image at 2000× magnification is presented at the top right. The SEM microstructure confirmed that Zr powders were concentrated by pressure, and micropores were present due to powder compression.
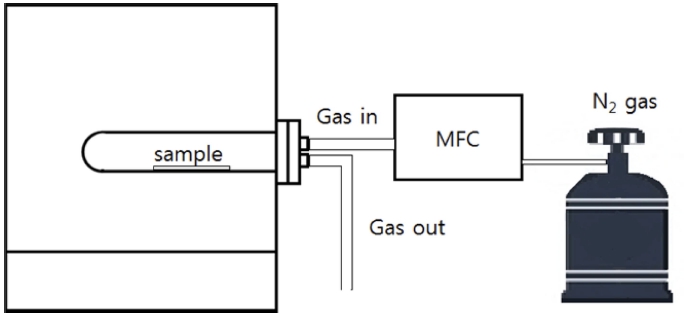
For each Zr getter prepared, as shown in Fig. 2, the target temperature was reached using a tube furnace (CA14P, Hantech), and the N2 (99.999 %) gas flow rate was adjusted to 40 sccm using an MFC (VIC-D210, MKP). The prepared samples were heated to 150, 250, 350, 450, and 550 °C, in the N2 atmosphere. Furthermore, during the heat treatment as a pre-stabilization process, it was heated up to the target temperature at a rate of 2 °C/ min and maintained for 10 min., and then cooled at a cooling rate of 1 °C/min.
Before and after the heat treatment, the macro shape changes were observed with a magnification of 10 using a low magnification optical microscope (815000, GIA Instrument Co.). The microstructure of the sample was investigated using field emission scanning electron microscopy (FE-SEM, S-4300, Hitachi), and EDS (EDS, JSM-6010PLUS/LA, JEOL) was used to examine the distribution of each element.
A micro-Raman spectrometer (UniRaman, Unithink Co.) was used to analyze the physical properties of the thin film formed on the surface. For each sample, spectra were collected for 60 scans with 10 seconds of exposure to examine the 300 ~ 2000 cm−1 region peaks with the accumulation mode centered at 1,200 cm−1.
X-ray diffraction (XRD, Smartlab, Rigaku Co.) was also performed with CuKα X-ray source using a 9 kW X-ray generator, tube current of 200 mA, and voltage of 45 kV. The scanning range was between 20° and 90° with the scan step of 0.02°.
3. Results and Discussion
Fig. 3 shows the macro images of Zr getters with or without heat treatment using a GIA optical microscope. Fig. 3(a) shows the Zr getter without heat treatment. The heat-treated Zr getters at 150 °C, 250 °C, 350 °C, 450 °C, and 550 °C are shown in Fig. 4(b), (c), (d), (e), and (f), respectively.
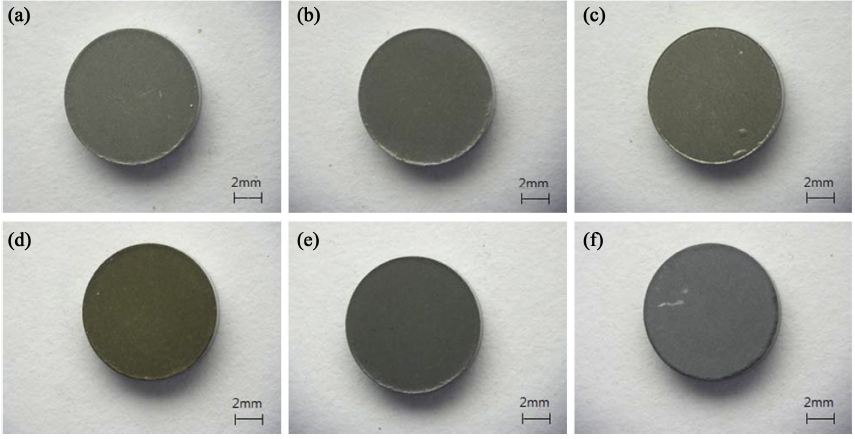
Fig. 3
Macro image of Zr getters with elevated temperatures of (a) as-prepared, (b) 150 °C, (c) 250 °C, (d) 350 °C, (e) 450 °C, and (f) 550 °C.
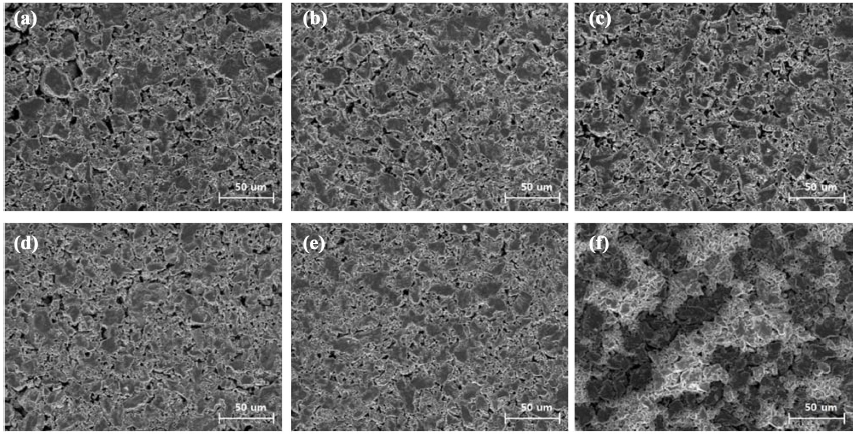
Fig. 4
SEM images of Zr getters with elevated temperature of (a) as-prepared, (b) 150 °C, (c) 250 °C, (d) 350 °C, (e) 450 °C, (f) 550 °C.
There was no change in the size of the getter diameter measured macroscopically. Fig. 3(a) and (b) showed colors similar to that of Zr powder, and the color of the surface began to change from (c). From (d) at 350 °C, the surface color changed to brown. After that, as the temperature increased, a darker stable layer appeared, as shown in (e) and (f). This finding was believed to be caused by the reactants of Zr on the surface.
Fig. 4 shows the microstructure result analyzed by SEM. The image before the heat treatment in Fig. 4(a) indicated that the particles with an average size of approximately 45 μm and the size of the bulk powder before compression, were mixed with approximately 5 μm pores, which is a typical pore size of porous materials. The SEM images of Zr getters from temperatures of 150 °C to 450 °C in (b) to (e) were not significantly different from (a). In particular, the surface color change identified in Fig. 4 was expressed without a significant effect on the SEM microstructure.
However, there was a clear difference in the surface contrast of the heat-treated samples at 550 °C as shown in (f), which was considered to be caused by different thicknesses of thin films formed as the heat treatment temperature increased.
Table 1 describes the EDS result of the SEM image in Fig. 4. The EDS result confirmed that the amount of oxygen increased with the increase of heat treatment temperature while no nitrogen element was found at the point. This result indicates that all surface getters were stabilized to be ZrO2 and preferably reacted with oxygen even though there was a lot of nitrogen nearby. However, the amount of oxygen decreases again at 250 °C, indicating an activation temperature around 200 °C, where the oxygen on the Zr surface is absorbed and eliminated in the reverse direction.6) In other words, the stabilization of ZrO2 on the surface was successful with the heat treatment above 250 °C.
Table 1
EDS result of Zr getter with elevated temperature of asprepared, 150 °C, 250 °C, 350 °C, 450 °C, and 550 °C.
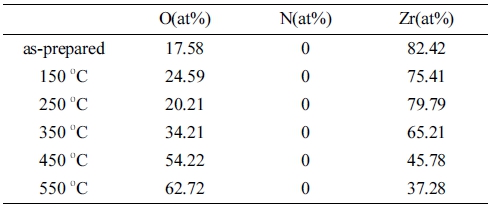 |
Fig. 5 shows the result of micro-Raman spectroscopy. After the preparation, the reference sample and the prepared samples at 150 and 250 °C did not show a characteristic spectral range due to strong metal properties. From the samples at 350, 450, and 550 °C, the peaks identified as ZrO2 were better measured between 480 and 632 cm−1.
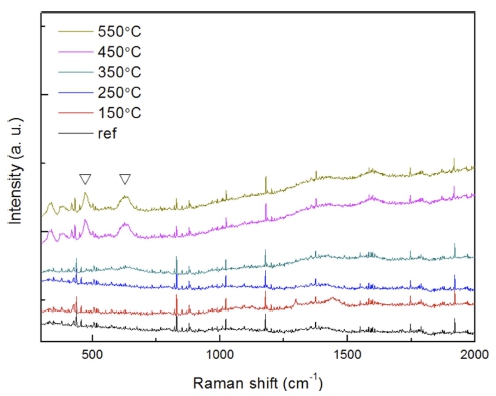
Fig. 5
Raman spectra of Zr getters with elevated temperatures of as-prepared, 150 °C, 250 °C, 350 °C, 450 °C, and 550 °C.
As this is characteristic of Raman analysis, the peaks did not appear below 250 °C, in which a thin oxidation layer was expected because light energy is reflected by the surface electron cloud layer in metals. The peak from the samples above 350 °C was judged to be a relatively thick ZrO2 layer formed on the surface as the heat treatment temperature increased. It was also consistent with the Raman result of m-ZrO2 on the monoclinic phase, which matched the peak indicated in the 500 ~ 750 cm−1 region reported by S. Ding et al..12)
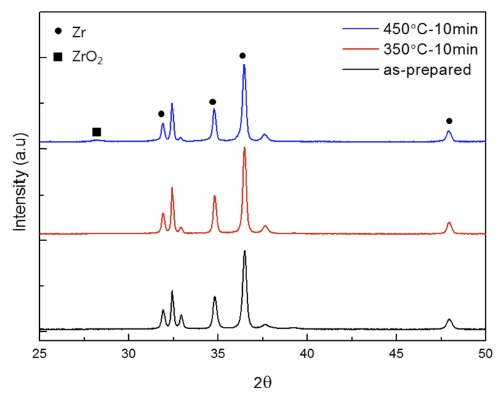
Fig. 6 shows the XRD results of the reference sample taken immediately after preparation and the treated samples at 350 °C and 450 °C. It was confirmed that the same Zr characteristic peak was observed in all three samples. Furthermore, ZrO2 was formed in the heattreated sample at 450 °C, which was consistent with the Raman analysis results shown above as m-ZrO2 was observed on the surface during the heat treatment at 450 °C or higher. The ZrO2 peak was not found at 350 °C, which indicates that ZrO2 may exist, as shown in the Raman result. However, this ZrO2 may exist as an amorphous phase with an insufficient crystallinity or has a thickness that cannot be identified by XRD resolution.
4. Conclusion
We examined the properties of Zr getters with temperature changes in the N2 condition with the impurity gas concentration of 10 ppm or higher. The Zr getter was stabilized with the oxidation layer rather than a nitrification layer by reacting with a trace amount of oxygen first in the N2 condition at 150 °C ~ 550 °C. Therefore, the porous Zr getters were stable enough to be used as a nitrogen getter as it eventually prevented the abrupt temperature rise caused by a possible exothermic reaction of nitrogen by the oxidation on the surface in the 5N purity N2 condition.
