


1. Introduction
Reactive oxygen species(ROS) like hydroxyl radicals (·OH) can be generated in natural water by the interactions between sunlight and light-absorbing substances, ROS may participate in the indirect photolysis of trace organic pollutants, therefore resulting in their environmental fates and ecological risks in natural water systems.1) Many studies showed that the heterogeneous photocatalysis through light illumination on a semiconductor surface was an attractive Advanced Oxidation Processes(AOPs). During this process, the generation of powerful reactive oxygen species(ROS) like superoxide radical anion(·O2−), hydroxyl radical(·OH), hydrogen peroxide(H2O2) and singlet oxygen(1O2) etc. takes place markedly. These oxidizing substances with higher reaction activity than common oxygen molecules can completely destroy various organic pollutants in wastewaters.2,3)
However, only approximately 3-5 % of the solar spectrum falling on the semiconductor can be used, which means that the efficient utilization of solar energy by the semiconductor is limited. Titanium dioxide(TiO2) or zinc oxide(ZnO), as a photocatalyst irradiated by ultrasound to produce an excited source of radicals, has been successfully used in the degradation of toxic organic compounds and dye pollutants. It is necessary to enhance the photocatalyst degradation efficiency and to search for new highly active photocatalysts.4)
Carbon-based materials, such as graphite, carbon nanotubes, graphene sheets and fullerene have been widely studied. Two-dimensional(2-D) graphene has emerged as high potential material and increasingly attracted attention owing to its fascinating physical properties including quantum electronic transport, extremely high mobility, high elasticity, and electromechanical modulation. As a simple and facile method, hydrothermal method has shown its advantages in the preparation of nanomaterials.5)
During the last few years, narrow band gap semiconductor quantum dots such as CdS, CdSe, PbS, InAs and InP have been used as photocatalysts.6,7) There has been much interest in the electronic structure of the transition-metal dichalcogenides. During the last decade a considerable number of experimental and theoretical studies have been reported on the so-called pyrites MX2, with M = Mn, Fe, Co, Ni and X2 = As2, S2 or Se.8) Crystal field splitting, correlation and intrinsic 3d bandwidth are all about the same magnitude in these compounds. Ag2Se is also an interesting candidate for broad band sensitizers. Ag2Se has a very small energy gap (Eg = 0.07-0.15 eV, 300 K).9) It is also the only stable composition that occurs in the phase diagram of the Ag- Se system.10) Ag2Se nanoparticles have been synthesized by various methods.11)
1,5-diphenyl carbazide(DPCI) can be oxidized by oxidizing substances into 1,5-diphenyl carbazone(DPCO), which can be extracted by organic solvents and display an obvious absorbance in a certain range of wavelength. 12) The generation of reactive oxygen species were detected through the oxidation reaction from 1,5-diphenyl carbazide(DPCI) to 1,5-diphenyl carbazone(DPCO). If the absorbances of DPCO extract liquors decreases after adding some kind of radical scavengers, it will demonstrate that there is a kind of corresponding ROS in the system.
In this study, graphene modified Ag2Se nanoparticles has been prepared via sonochemical and hydrothermal method. Interesting phenomena were also found in which the enhancement of photoactivity was attributed the photosensitization of graphene and the enhanced interfacial charge separation between graphene and Ag2Se particles.
2. Experimental
2.1. Experimental Materials
Graphene oxide which was prepared by a Hummers- Offeman method used as another carbon nanomaterial in our previous works. For the oxidization of carbon material,3-chloroperoxybenzoic acid(TCPBA) was chosen as the oxidizing agent and was purchased from Acros Organics, New Jersey, U.S.A. Benzene(99.5 %) was used as the organic solvent and was purchased from Samchun Pure Chemical Co., Ltd., Seoul, Korea. Silver nitrate (AgNO3), Selenium(Se) metal powder and ammonium hydroxide(NH4OH, 28 %) were purchased from DaeJung Chemicals & Metal Co., Ltd, Korea. Anhydrous purified sodium sulfite(Na2SO3, 95 %) was purchased from Duksan Pharmaceutical Co., Ltd, Korea. Methyl blue(MB, C16H18ClN3S, 99.99+ %) was used as model pollutant which purchased from Samchun Pure Chemical Co., Ltd, Korea, respectively. Texbrite BA-L(TBA) was purchased from Texchem Co. Ltd, Korea. All chemicals used without further purification and all experiments were carried out using distilled water graphene functionalized.
2.2. Synthesis of Ag2Se-graphene composite
The graphene nanosheets(54 mg) were under ultrasonication for 1 hour. Firstly, Na2SO3(5 g) and Selenium metal powder(0.5 g) were dissolved in 30 mL distilled water and refluxed for 1 h to form Na2SeSO3 solution. Then 30 mg graphene nanosheets and 22 mg AgNO3 were dispersed into a solution with the molar ratios of ethanol:H2O = 7:3, and the suspension was sonicated at room temperature for 1 h using a Controllable Serial- Ultrasonic apparatus(Ultrasonic Processor, VCX 750, Korea). Then, the Na2SeSO3 solution and 6 mL NH4OH (28 wt%, pH = 12) were added to above system, and the mixture was stirred rapidly at 100 °C for 8 h. The reaction mixture was allowed to cool to room temperature and the precipitate was filtered, washed with distilled water five times, and dried in a vacuum oven at 80 °C for 12 h before heat treatment at 500 °C for 3 h.
2.3. Characterization
XRD(Shimadzu XD-D1, Uki, Kumamoto, Japan) was used to identify the crystallinity of the composite with monochromatic high-intensity CuKα radiation(l = 1.5406 Å). SEM(JSM-5600, JEOL Ltd., Tokyo, Japan) was used to observe the surface state and structure of the prepared composite. The elemental mapping over the desired region of the prepared composite was determined by an EDX analyzer attached to the SEM. Then, the BET surface area was calculated by nitrogen adsorption. Highresolution transmission electron microscopy(HRTEM, JEM-3010, Japan) was used to observe the surface state and structure of the Ag2Se-graphene composites. Raman spectra were recorded at room temperature using amicro- Raman spectrometer in the backscattering geometry with a 514.5 nm Ar+ laser as an excitation source. The absorbance spectrum of the photocatalyst was recorded at room temperature in the range 300-800 nm using a UVVis spectrophotometer(Genspec III, Hitachi, Japan) equipped with an integration sphere.
2.4. Catalytic degradation of MB and TBA
The photocatalytic activities were evaluated by MB and TBA degradation in aqueous media under visible light irradiation. For visible light irradiation, the reaction beaker was oriented axially and held in a visible light box(8W, halogen lamp, KLD-08L/P/N, Korea). The luminous efficacy of the lamp is 80 lm/W, and the wavelength is 400 nm ~ 790 nm. The lamp was used at a distance of 100 mm from the aqueous solution in a dark box. The amount of the photocatalyst composite was 0.05 g/(50 ml solution). TBA solution(0.001 v/v) and MB solution(1 × 10⁻⁵ mol/L) were also prepared, respectively.
The reactor was placed for 30 min in darkness, in order to make the adsorption equilibrium. After the adsorption state, in the process of the degradation of methylene blue, a glass reactor(diameter = 4 cm, height = 6 cm) was used and the reactor was placed on a magnetic churn dasher. The suspension was then irradiated with visible light for a set irradiation time. Visible light irradiation of the reactor was done for 30 min, 60 min, 90 min and 120 min, respectively. Samples were withdrawn regularly from the reactor and dispersed powders were removed by using a centrifuge. The clean transparent solution was analyzed by UV-vis spectroscopy. In case of TBA the spectral range was from 250 nm to 350 nm and MB solution was from 250 nm to 800 nm. The absorbance value at the λmax of the dye solutions was obtained. The MB and TBA concentration in the solution was determined as a function of the irradiation time.
2.5. Evaluation of reactive oxygen species
Firstly, six 10.00 mL DPCIstocksolu-tions(1.00 × 10⁻² mol/L) were added into three 80 mL volumetric flasks, respectively. And then 50 mg Ag2Se-Gphotocatalysts were added to above DPCI solutions, respectively. All of the three solutions were diluted to 50 mL with double distilled water. For all three solutions, the final DPCI concentration and Ag2Se-G photocatalyst amount were 2.00 × 10⁻³ mol/L and 1.00 g/L, respectively. Among them, the reactors were put into a visible light apparatus away from light directly under visible light irradiation. After 180 min irradiation, from each sample 10.00 mL solution was taken exactly and extracted with benzene. And then, all extracted solutions were diluted to 10.00 mL with benzene solution and their UV-vis spectra were determined.
3. Results and Discussion
3.1. Elemental analysis of the prepared composite
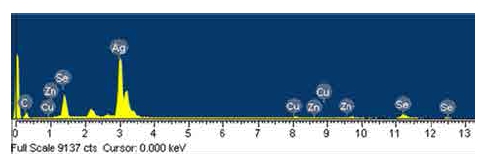
Fig. 1 shows the EDX patterns of the Ag2Se-G composites. EDX indicated C, Se and Ag as the major elements with small quantities of oxygen in the composites. The numerical results of EDX quantitative microanalysis of the samples are listed in Table 1. There were some small impurities, which were attributed to the use of graphene without purification. As shown in Fig. 1 for the products of the fullerene modified hydrothermal method. The ratio of Se/Ag was detected as 1/1.98 which is in complete agreement with the chemical formula of Ag2Se showing that no significant residue of the starting materials or the surfactant is remained in the product. The EDX quantitative microanalysis of carbon was increased with the increase of C70 content.
3.2. Surface characteristics of the samples
The micro-surface structures and morphologies of the different composites were characterized using SEM. Fig. 2 shows the macroscopic changes in the morphology of the composites. Ag2Se is shown to have a small particle size and good dispersion. It was supposed that the spherical particles in Ag2Se-G composites are Ag2Se particles on the surface of graphene. HRTEM was able to reveal clearly the presence of Ag2Se particles on the surface of graphene. Zhang et al. reported that a good dispersion of small particles could provide more reactive sites for the reactants than aggregated particles.13) At the same time, the conductivity of graphene can facilitate electron transfer between the adsorbed dye molecules and the catalyst substrate. By comparing Fig. 1(b-c) (after adding graphene), the dispersion of Ag2Se was a little deteriorated.
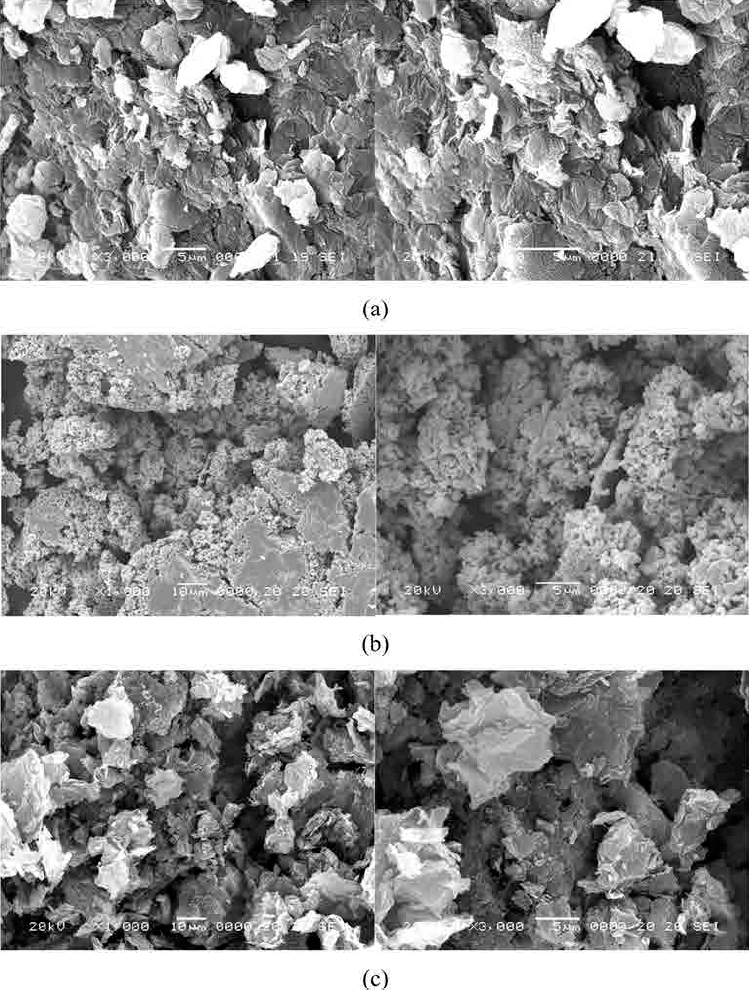
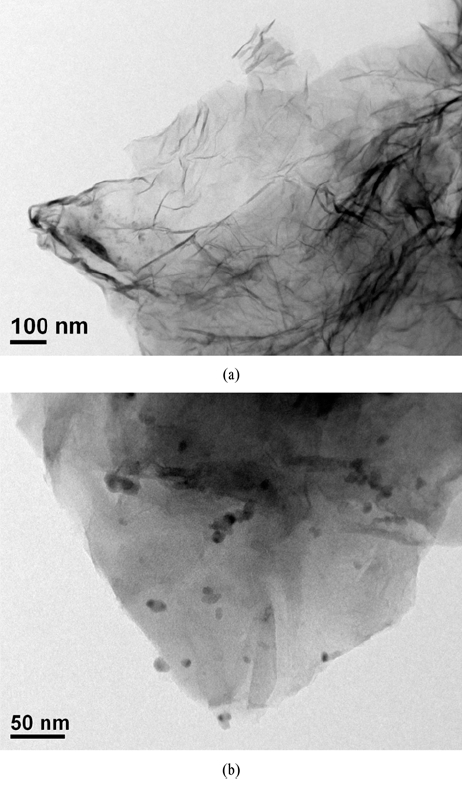
Fig. 3 shows HRTEM images of the Ag2Se-graphene composites. HRTEM is a technique used for analyzing the morphology, crystallographic structure, and even the composition of a specimen. Fig. 3 gives direct evidence that the graphene are in close contact with Ag2Se, and particles were observed upon enlargement of the images. This indicates that the surfaces of the Ag2Se particles are cleaned under exposure to the reaction conditions. Ag2Se particles were distributed uniformity with a size of approximately 30 nm, even though this caused partial agglomeration to form block particles. Fig. 3 shows large clusters with an irregular agglomerated dispersion of fullerene. Ag2Se nanoparticles were distributed outside the surfaces of the graphene with a size of approximately 9~10 nm, even though this caused partial agglomeration to form block particles. HRTEM also revealed the presence of fullerene particles on the Ag2Se particles.14)
3.3. Structural features of the catalyst
The FT-IR spectrum of graphene was rather simple and suggested extensive oxidation. The spectra of the crystalline materials showed well distinguished and sharp bands, whereas the amorphous spectra were less resolved. The hydration results established the importance of defined conditions for FT-IR(Fig. 4). They also suggested that this type of study can be performed on oxidized graphene. Fig. 4(a-b) show the FT-IR spectra of oxidized graphene, and Ag2Se-graphene composite, respectively.
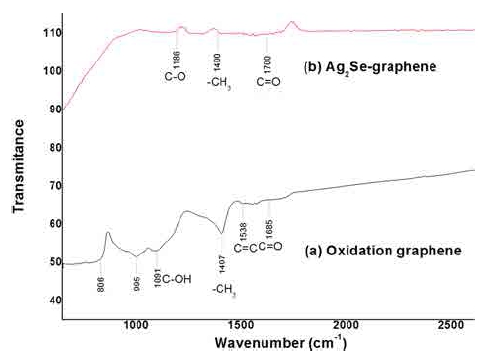
From Fig. 4(a), the peak at 995 cm−1 was assigned to the alkane bending vibration, which occurs between 650- 1000 cm−1, and the peak at 806 cm−1 were assigned to aromatic symmetric stretching modes, which occur in the range 690-900 cm−1. Strong C-O bands at approximately 1102 cm−1 and a strong C=C band at 1538 cm−1 were observed. The functional groups, C=O and C-OH, were indicated in the spectrum at approximately 1685, and 1091 cm−1. Meanwhile, -OH was also observed at approximately 1407 cm−1.
This confirms that artificial ageing is actually occurring in the surface, and that the types of structural changes inferred from the spectra are consistent with the mechanism proposed in the literature: the formation of O-H bonds resulting from the oxidation of the hydrocarbon triterperpenic molecules by the direct binding of O· and O-O radicals, followed by further oxidation to carbonylic functional groups.15,16)
In Fig. 4(b), the weak peaks at 1186 cm−1 was assigned to the C-O bands, respectively. The CH3 and C=C functional groups were observed at approximately 1400 and 1700 cm−1, respectively. Compared to the spectrum curves (a) and (b), the peak intensity of the functional group on oxidized graphene was weak and decreased. This is because some of the functional groups had combined with Ag2Separticles. The Ag2Separticles were bound to graphene with different functional groups.17)
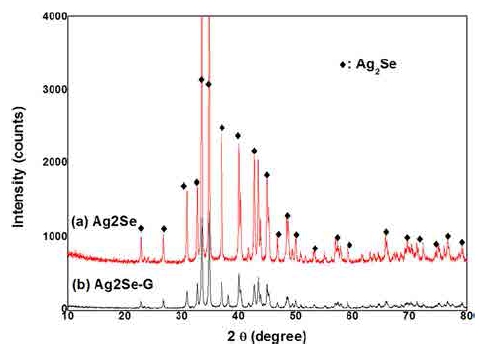
XRD was used to determine the crystallographic structure of the inorganic component of the composite. Fig. 5 shows the XRD patterns of the Ag2Se and Ag2Segraphene samples. The main sharp peaks, at 22.90, 26.75, 30.90, 32.7, 33.50, 34.70, 36.99, 39.96, 40.31, 42.65, 43.45, 43.74, 45.05, 48.43, 48.60 and 49.86 which were assigned to (002), (111), (102), (120), (112), (121), (013), (031), (122), (113), (201), (130), (032), (123), (014), and (212) crystal planes originated from the orthorhombic Ag2Se phase, which were in accordance with the results reported by Zhan et.al with the lattice parameters were close to a = 4.331 Å, b = 7.061 Å, and c = 7.763 Å(JCPDS card no. 14-0072).18) No impurity phase is detected. The broadening of these diffraction peaks indicates that the sample is nanosized. From the XRD patterns, it is also possible to compute the % crystallinity and crystal size. The amorphous-phase fraction of the sample may be determined using the ratio of the amorphous area(area not under the peaks) of the Xray diffractogram to the total area. Also, the peaks at different crystal planes of the Ag2Se-graphene nanocomposite, matched exactly with that of Ag2Se, indicating essentially no difference with respect to the type of crystalline phase in the two products. It was found that Ag2Se showed more crystallinity than the prepared Ag2Se-graphene nanocomposite. This is attributed to the adverse conditions created when adding graphene; which did not allow nucleation and crystal growth.19)
3.4. BET analysis
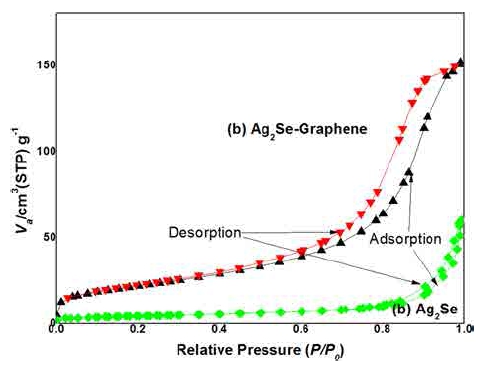
Nitrogen adsorption isotherms for the original graphene, and Ag2Se-graphene composites are shown in Fig. 6. The formation of type IV adsorption isotherms confirmed the major presence of mesopores on the surfaces of the samples. Characteristic features of the Type IV isotherm are its hysteresis loop, which is associated with capillary condensation taking place in mesopores, and the limiting uptake over a range of high p/po. The initial part of the Type IV isotherm is attributed to monolayer-multilayer adsorption since it follows the same path as the corresponding part of a Type II isotherm obtained with the given adsorptive on the same surface area of the adsorbent in a non-porous form. Type IV isotherms are given by many mesoporous industrial adsorbents.20,21) This indicates that the Ag2Se-graphene composites studied was mainly mesoporous in character, with a minor presence of wider pores where capillary condensation occurred. All of the isotherm shapes show similar types for all samples. Surface areas and pore volumes of the graphene were reduced due to deposition of Ag2Se. The BET surface area values of samples were shown in Table 1. The BET value was decreased from 278.48 m2/g of graphene to 52.26 m2/g of Ag2Se-graphene. It can be considered that the Ag2Se nanoparticles were introduced into the pores of the graphene, which decreased the BET surface area. The Ag2Se-graphene has the larger area which can affect the adsorption reaction. The adsorptive effect of Ag2Se-graphene was better than that of Ag2Se because the added graphene can enhance the BET surface area which can increase the adsorption effect.
3.5. Photocatalytic activity of samples
Fig. 7 shows the time series of MB degradation using pure TiO2, graphene, Ag2Se and Ag2Se-graphene compounts under visible light with different irradiation intensities. The spectra for the MB solution after visible light irradiation show relative degradation yields at different irradiation times. The dye concentration continuously decreased with an excellent rate, which was due to visible light irradiation. The concentration of MB was 2.0 × 10⁻⁵ mol·L−1, and the absorbance for MB decreased with increasing visible light irradiation time. Moreover, the MB solution increasingly lost its color as the MB concentration continued to decrease. Two steps are involved in the photocatalytic decomposition of dyes: the adsorption of dye molecules and degradation. After adsorption in the dark for 30 min with magnetic stirring, the samples reached adsorption-desorption equilibrium. In the adsorptive step, All of the composites showed different adsorptive effects, with graphene having the best adsorptive effect. The adsorptive effect of Ag2Segraphene was better than that of Ag2Se because the added graphene can enhance the BET surface area which can increase the adsorption effect.22) Ag2Se-graphene has better BET surface area than Ag2Se, which enhances the adsorptive effect. In the degradation step, the Ag2Se and Ag2Se-graphene composites showed a good degradation effect, as shown in the UV-vis absorption spectra. TiO2 and graphene have poor degradation effect under visible light, because the larger band gap energy. The Ag2Segraphene composites showed good adsorption and degradation effects. A comparison of the decoloration effects of the different catalysts showed that the degradation effect can be increased by an increase in the adsorption capacity.23)
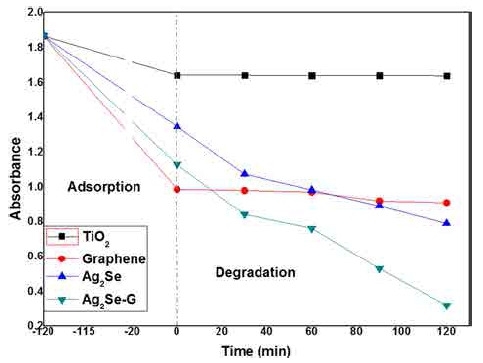
Fig. 8 is the UV-vis spectra of OPCO extract liquors in the presence of Ag2Se and Ag2Se-graphene composites under visible light irradiation. 1,5-diphenyl carbazide (DPCI) can be oxidized by oxidizing substances into 1,5- diphenyl car-bazone(DPCO). Under visible light irradiation, the Ag2Se-graphene samples turns into the excited state. That is, some electrons are transited from valence band(VB) to conduction band(CB). Simultaneously, the electron-hole pairs form on the surface or in the inner of Ag2Se-graphene samples. The electrons and holes react with the molecular oxygen(O2) dissolved in aqueous solution and water molecules(H2O) absorbed on the surface of Ag2Se-graphene particles, respectively, producing the superoxygen radical anions(·O2−) and hydroxyl radicals(·OH). These ·OH can oxidize 1,5-diphenyl carbazide( DPCI) into 1,5-diphenyl carbazone(DPCO). The DPCO can be extracted by the benzene solvent and show an absorbance at 560 nm wavelength. Sequentially, the produce and output of ·OH can be easily detected, and the photodegradation activity can be easily detected. From Fig. 8 we can see that, under visible light irradiation, the absorption peaks of DPCO around 560 nm show an obvious increase compared with the corresponding ones without any irradiation.24) And that, for different irradiation time under visible light the DPCO solution exhibits different absorbance.Fig. 9
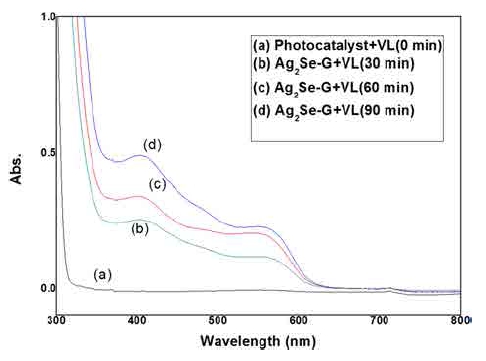
Fig. 8
UV/Vis spectra of DPCO concentration s after exposure to composites under visbile light at various time intervals.
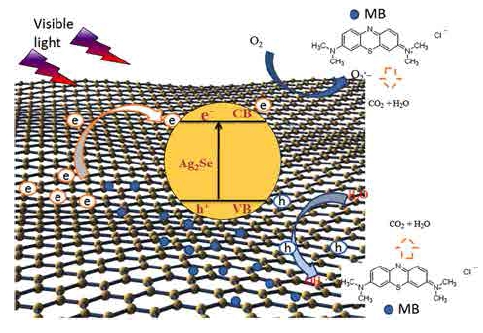
Fig. 9
Schematic diagram of the separation of photogenerated electrons and holes on the Ag2Se-graphene interfacec.
The main reasons why graphene is particularly efficient in mediating photodynamic therapy(PDT) is their extended π-system, which absorbs UV or visible light and generates ROS through energy and electron-transfer processes from the triplet and singlet states. The more extended is the π system, the higher is the PDT efficiency expected to be. The photodynamic activity of graphene is higher, because the former’s relatively larger cage.25) Changes in the electronic and geometrical structures of molecules, as well as their interaction with other molecules in the surrounding environment can be induced by the photo-excitation of these molecules. These electron transfer will take place in both inter and intra-molecular fashion. Because graphene were covalently bound to photoactive chromophores, so there were enhanced photo-induced intramolecular energy transfer or electron-transfer events. Furthermore, relative small variations in the irradiation wavelengths may cause changes in the photophysical behavior of dyes.26)
Based on the above experimental results, we can conclude that this degradation mechanism is suitable to explain the results of photocatalytic degradation using the prepared graphene composite. Fig. 10 shows a schematic diagram of the separation of photogenerated electrons and holes on the Ag2Se-graphene interface.
4. Conclusion
A novel Ag2Se-graphene heterojunction photocatalysts were successfully prepared in this study. The FT-IR results illuminated that the Ag2Se band transfers electrons to fullerene with functional groups attached. The adsorption and surface properties as structural and chemical composition of the Ag2Se-graphene composites were investigated. Surface areas and pore volumes of the samples increased due to deposition of fullerene compounds. The XRD results showed that the phase type was hexagonal Ag2Se phase and fullerene. The quantities of hydroxyl radicals generated can be analysis by DPCI degradation. The results demonstrated that the PGO oxidation of MB and TBA causing its concentration in the aqueous solution to decrease, can be attributed to the synthetic effects of electro-assisted PGO decomposition by Ag2Se and graphene. The Ag2Se-graphene composite catalyst prepared by the impregnation method demonstrates higher PGO activity than pure Ag2Se. Ag2Segraphene has the best degradation and adsorption effect due to high photosensitivity and relativity high adsorption effect of graphene.