1. Introduction
2. Experimental Procedure
2.1. Raw materials
2.2. Pretreatment of Ti surface
2.3. Preparation of Zn-doped TiO2 coating
2.4. Surface characterizations
2.5. Water contact angle measurement
2.6. Cell viability test
2.7. Electrochemical measurements
3. Results and Discussion
3.1. Basic characterization of Zn-TiO2@Ti samples
3.2. Wettability of the modified surface
3.3. Cell viability of Zn-TiO2@Ti samples
3.4. Electrochemical analysis
4. Conclusion
1. Introduction
As the global population ages and participation in high-risk sports among youth increases, bone-related health issues are becoming more prevalent, presenting significant medical, economic, and social challenges.1) Titanium (Ti) and its alloys, widely recognized for their superior wear, corrosion resistance, and remarkable biocompatibility, are extensively used in dental and orthopedic implants. However, the bio-inert nature and limited antibacterial properties of Ti-based implants necessitate further enhancements.2)
To date, various strategies have been explored to improve Ti implant performance, including surface modifications such as mechanical/(electro)chemical treatments, plasma ion implantation, plasma electrolytic oxidation, sol-gel processes, and micro-arc oxidation.3) These modifications often involve coating the implants with bioactive substrates like titanium dioxide (TiO2) or hydroxyapatite (HAP) to boost their antibacterial functionality.4) Further enhancements include doping TiO2 coatings with transition metals like iron,5) zinc (Zn),6) silver,7,8) and copper9) significantly improving implant functionality.10) Doping these metals into TiO2 not only improves photocatalytic efficacy by modifying its bandgap but also contributes to robust antibacterial effects.11)
Zn, in particular, is critical for promoting cell proliferation and bone development, making it essential for increasing osteoconductivity and biocompatibility, which are vital for faster healing and enhanced bone integration.6,12) Moreover, Zn doping can generate reactive oxygen species such as ∙O2- (superoxide), ∙OH (hydroxyl radical), and H2O2 (hydrogen peroxide) under visible light exposure.13) This capability is particularly valuable in enhancing the efficacy of photodynamic therapy of TiO2 nanoparticles.
A variety of innovative methods emphasizing biosafe properties have been developed to prepare Zn-modified Ti materials, using notable techniques such as electrodeposition, atomic layer deposition (ALD), magnetron sputtering, sol-gel technology, and the hydrothermal method to create zinc oxide (ZnO) nanoparticle-modified Ti implants.14) One specific approach involves the hydrolysis of zinc acetate with diammonium hydrogen phosphate, which creates Zn-containing nano-cluster structures on Ti that promote cell adsorption, proliferation, and osteogenic differentiation.15) Other methods have developed Zn-containing nanowires through acid etching and alkali heat treatments followed by immersion in ZnSO4 solution at 70 °C or Zn(NO3)2 at 40 °C for 24 h.16,17) These modifications have shown significant antibacterial effectiveness against common oral pathogens such as Staphylococcus aureus, Actinobacillus actinomycetemcomitans, and Porphyromonas gingivalis, which are often associated with implant-related infections. Furthermore, Zn-modified Ti, prepared using an alkali solution containing the [Zn(OH)4]2- complex, has demonstrated significant osteogenic potential in vitro.18)
The importance of Zn as a bioactive material underscores the necessity for continuous research and development in its incorporation into Ti plates. Although methods like electrodeposition and ALD offer control over nano-ZnO properties, further investigation into controlling micro/nanostructures and understanding their impact on implant functionality, particularly concerning the cytotoxicity of Zn, is crucial. This study aims to develop a Zn-doped anatase phase TiO2 nanostructured layer on Ti metal using a straightforward chemical and hydrolysis co-condensation method. It examines how different synthetic conditions affect surface morphology, phase composition, and mechanical properties, and assesses its compatibility with living cells, as evidenced by MTT [3-(4,5-Dimethylthiazol-2-yl)-2,5-Diphenyltetrazolium Bromide] assay results.
2. Experimental Procedure
2.1. Raw materials
The chemicals used in this study, tetrabutyl titanate [TBT, Ti(OC4H9)4, 99 %], zinc nitrate hexahydrate [Zn(NO3)2 ‧ 6H2O, 99 %], and ammonia water [NH3 ‧ H2O, 25~28 %], were purchased from Aldrich (Sigma Aldrich, USA) and used without further purification. All experiments were conducted using deionized (DI) water.
2.2. Pretreatment of Ti surface
Medical pure Ti plates of ASTM Grade 2 (Daito Steel Co., Ltd., Japan) were sequentially polished using SiC sandpaper (grain sizes #400, #600, #800, and #1200), then rinsed with DI water and ethanol multiple times to remove contaminants. The Ti plates were subsequently hydrothermally treated with 4 M NaOH at 85 °C for 2 h.
2.3. Preparation of Zn-doped TiO2 coating
Zn-doped TiO2 nanoparticles were synthesized using a hydrothermal method. Firstly, 0.57 M of Zn(NO3)2 ‧ 6H2O (0.17 g) were dissolved into 23 mL of DI water, stirred continuously until clear. Following this, 2 mL of TBT was added slowly and stirred for 30 min. Subsequently, 0.5 mL of ammonia water was added, and the mixture was stirred for another 30 min. The reaction mixture was then transferred into a Teflon-lined stainless steel autoclave (50 mL capacity) and heated in an electric oven at selected temperatures (130 °C, 150 °C, and 180 °C) for 24 h. The Zn-TiO2 coated Ti plates were washed several times with DI water and dried at 60 °C. These Ti plates coated with Zn-doped TiO2 are denoted as Zn-TiO2@Ti-X, where ‘X’ represents the synthesis temperature. For example, the sample synthesized at 150 °C is referred to as Zn-TiO2@Ti-150.
2.4. Surface characterizations
The surface morphologies and elemental compositions were evaluated using field emission scanning electron microscopy (FE-SEM, JSM-7001F, Hitachi, Japan) equipped with an energy-dispersive X-ray spectroscopy (EDS) module. The phase formation and structural analysis were conducted using powder X-ray diffraction (XRD) (Rint 1000, Rigaku, Japan) with Cu Kα radiation in the 2θ range of 10~70° and laser Raman spectrophotometry (Renishaw inVia Reflex Raman microscope, Renishaw, Gloucestershire, UK) with an excitation wavelength of 532 nm. The chemical bonds between the elements were analyzed and measured via X-ray photoelectron spectroscopy (XPS, Multilab 2000, UK).
2.5. Water contact angle measurement
To evaluate the hydrophilicity of the surface, water contact angles were measured using a goniometer. The procedure was as follows: the Ti plate was placed on a level table, the image recording was started using the software, and a drip of distilled water was placed on the sample. The image recording was completed after 30 s. Then the first image was selected, which showed that the drop had completely settled on the sample. The contact angle was determined using the software (DropSnake analysis plugin). At least five samples were tested for each modification and results are presented as the average of these measurements.
2.6. Cell viability test
MG63 osteoblast-like cells, obtained from the Korean Cell Line Bank, were cultured in high-glucose Dulbecco’s modified Eagle medium (DMEM, Gibco, Sigma Aldrich, USA) supplemented with 10 % fetal bovine serum (FBS, Gibco, Sigma Aldrich, USA), 100 units/mL penicillin, and 100 mg/mL streptomycin. To assess the cytotoxicity of Zn-doped TiO2@Ti, MTT assays were conducted. Zn-TiO2@Ti and NaOH-etched Ti specimens were placed in a 48-well plate and sterilized by UV irradiation for 30 min on each side. MG63 cells were then seeded at a density of 1 × 10⁵ cells/well on the sample surface and cultured in an incubator at 37 °C with 5 % CO2. After 24 h, MTT solution was added and incubated for an additional 3 h. The culture medium was subsequently removed, and 1 mL of dimethyl sulfoxide (DMSO) was added to dissolve the formazan crystals. Absorbance was measured using a Cytation3 Multi-Mode Reader (Biotek, VT, USA), As a control, MG63 cells were also cultured in empty well without specimens. Each MTT experiments were repeated five times.
2.7. Electrochemical measurements
The corrosion resistance of the samples was assessed through potentiodynamic polarization experiments, using a Wonatech Zive SP2 potentiostat in a 0.9 % NaCl solution the experimental setup consisted of a standard three-electrode system, where a spiral platinum wire acted as the counter electrode, a Hg/HgO electrode served as the reference, and the samples themselves were used as the working electrode. The exposed surface area of the samples was maintained at 1 cm2. The potential was swept from -2.0 to 2.0 V at a rate of 0.5 mV/s.
Electrochemical impedance spectroscopy (EIS) measurements were conducted over a frequency range of 100 MHz to 100 kHz. All polarization experiments were repeated five times to ensure the reliability and reproducibility of the results.
3. Results and Discussion
3.1. Basic characterization of Zn-TiO2@Ti samples
The crystal phase of TiO2 is determined by the arrangement of Ti and oxygen atoms within the crystal lattice, which is influenced by a variety of factors such as solvent used, the type of precursor, calcination temperature, pH levels, additives, and reaction duration.19)Fig. 1 illustrates the synthesis of Zn-TiO2@Ti-X, which employs a simple hydrolysis co-condensation approach. Initially, Ti plates are etched with NaOH to introduce hydroxyl (OH)-functional group on Ti surface, enhancing its reactivity.20) Subsequently, these etched plates are placed in an autoclave and treated hydrothermally. The reaction medium used is an ammonia water solution containing titanium butoxide and zinc nitrate hexahydrate, and the process is conducted at specific temperatures: 130 °C, 150 °C or 180 °C. In this reaction, ammonia water serves as a hydroxide anion generating agent, facilitating the hydrolysis co-condensation of Ti and Zn precursors with the OH-functionalized Ti surface.21) This process leads to the formation of Zn-doped TiO2 nanoparticles, which are subsequently coated onto the Ti plates. The choice of heating temperature is found to be a crucial factor in controlling the final crystalline phase of the Zn-doped TiO2 on the Ti plates.
XRD and Raman spectroscopy were conducted to determine the crystalline phases present in the Zn-TiO2@Ti samples. Fig. 2 displays the XRD patterns of obtaining Zn-TiO2 coatings synthesized at different temperatures, highlighting how the crystal phase is significantly affected by the reaction temperature. The patterns show peaks corresponding to the anatase form of TiO2 (PDF#01-084-1285, space group: I41/amd) and the rutile form of TiO2 (PDF# 89-0552, P42/mnm), as depicted in Fig. 2(a).22) Peak intensities, marked by different symbols, are assigned to the anatase and rutile phases of TiO2, as well as Ti substrate. For the sample synthesized at 130 °C, no Zn-related crystalline phases were detectable; only Ti substrate peaks were visible. For the sample synthesized at 150 °C, solely the anatase phase of TiO2 was observed. However, upon increasing the synthesis temperature to 180 °C, a mixed phase of anatase and rutile was observed in the Zn-TiO2@Ti-180 samples. This transition is influenced by the substitution of a metal ion with a valency less than +4, as well as by temperature changes, both of which introduce oxygen vacancies on the anatase surface.23) These vacancies facilitate a structural rearrangement that favors the formation of the rutile phase.
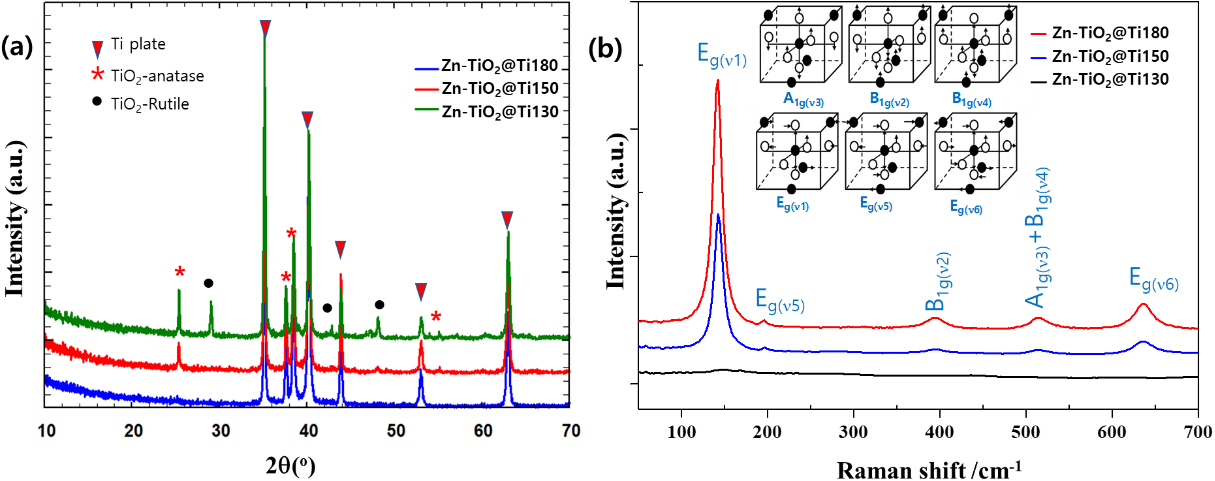
Fig. 2.
(a) XRD pattern of Zn-doped TiO2 on Ti plates synthesized at different temperature, (b) Raman spectra of Zn-doped TiO2 on Ti plates synthesized at different temperature (inset: Schematic of molecular vibrations in symmetry allowed Raman modes of anatase phase of TiO2.24)
The Raman spectroscopy data presented in Fig. 2(b) also provide insight into the structural characteristics of the synthesized TiO2. Due to its sensitivity to the crystal structure, Raman spectroscopy can distinctly identify different phases through their active modes. The results demonstrate that both samples exhibit the same crystalline phase, confirmed by the Raman active modes at 134 cm-1, 382 cm-1, 500 cm-1, and 618 cm-1, corresponding to the Eg, B1g, A1g+B1g, and Eg phases of anatase TiO2 crystal, respectively.24) Notably, the Raman spectra of TiO2 anatase was not altered by the presence of Zn dopants, and no Zn induced Raman peaks were observed in Zn-doped TiO2@Ti samples. This suggests that Zn dopants may occupy substitutional sites within the host TiO2 lattice. While both anatase and rutile phases were detected by XRD for Zn-TiO2@Ti-180 samples, Raman spectroscopy primarily highlighted the anatase structure. This observation can be attributed to the higher crystallinity of the anatase phase, as corroborated by subsequent SEM images. The combined XRD and Raman analyses confirm the successful coating of Zn-doped anatase TiO2 on Ti substrates, which is more desirable for biocompatible implant coating. It should be noted that the predominance of the anatase phase is particularly beneficial for both biocompatibility and photocatalytic activity, offering advantages over the rutile phase in these applications.25)
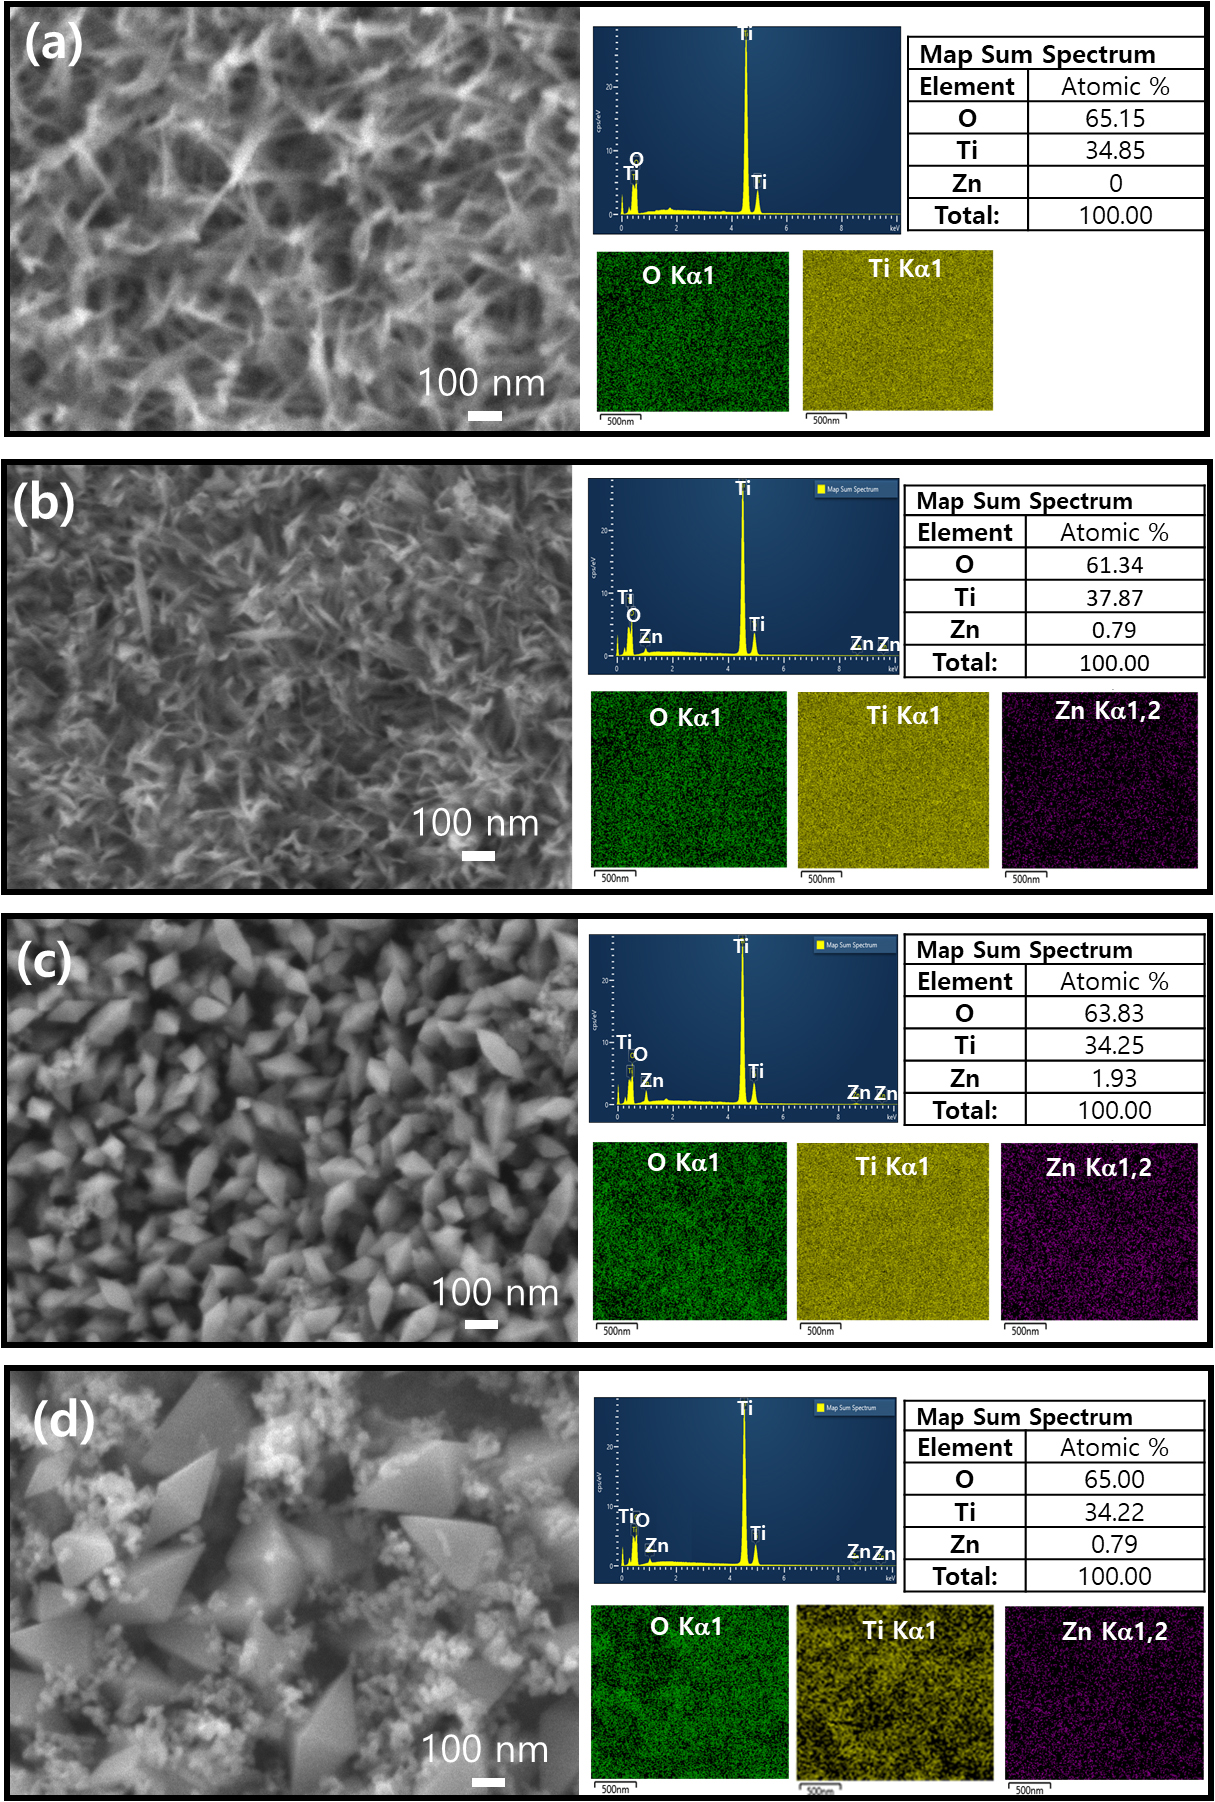
The morphologies of Zn-doped TiO2 surfaces on Ti plates, synthesized at different temperatures of 130 °C, 150 °C and 180 °C), were characterized using FE-SEM. Fig. 3(a) shows a bare Ti surface after being etched with NaOH, which appears to have a rough, irregular texture which likely contributes to increased surface area and potentially improves the adhesion of subsequent coatings. The accompanying energy dispersive EDS spectrum confirms the presence of Ti and oxygen, indicating a clean etch without residual contaminants. The etched Ti plates exhibit a relatively high oxygen content at 65 mol%, indicative of TiO2 layer formation.18) This would have beneficial effect since this oxygen would react with other coating atoms (e.g., Ti, or Zn) by hydrolysis aided by ammonia water. The FE-SEM image for the sample processed at 130 °C [Fig. 3(b)] bears a resemblance to the etched Ti substrate in morphology. However, Fig. 3(c, d) depict the uniform Zn-doped TiO2 coating on the Ti substrate, showcasing two distinct nanoparticle morphologies. The magnified images clearly show that particles are well-defined geometry, which is characteristic of bipyramidal shaped anatase TiO2. The particles synthesized at 150 °C have 70~100 nm in diameter and 150~200 nm in length, as shown in Fig. 3(c), whereas for the particles synthesized at 180 °C have 150~250 nm in diameter and 300~500 nm in length, along with irregular nanoparticles, as observed in Fig. 3(d). Despite the obvious differences in morphology, EDS mapping analysis indicates a consistent elemental composition. The EDS mapping images provide color-code element distribution: the green, yellow, and purple likely representing oxygen, Ti, and Zn, respectively, demonstrating the successful incorporation of Zn-doped TiO2 on the surface of Ti surface. The consistent coloration across the EDS maps suggests a uniform distribution of these elements across the sample surface. All samples, synthesized at varying temperatures, exhibited a comparable atomic ratio of Ti to O. The Zn content in the coatings, as determined by EDS analysis, ranged from 0.8 to 1.5 mol%.
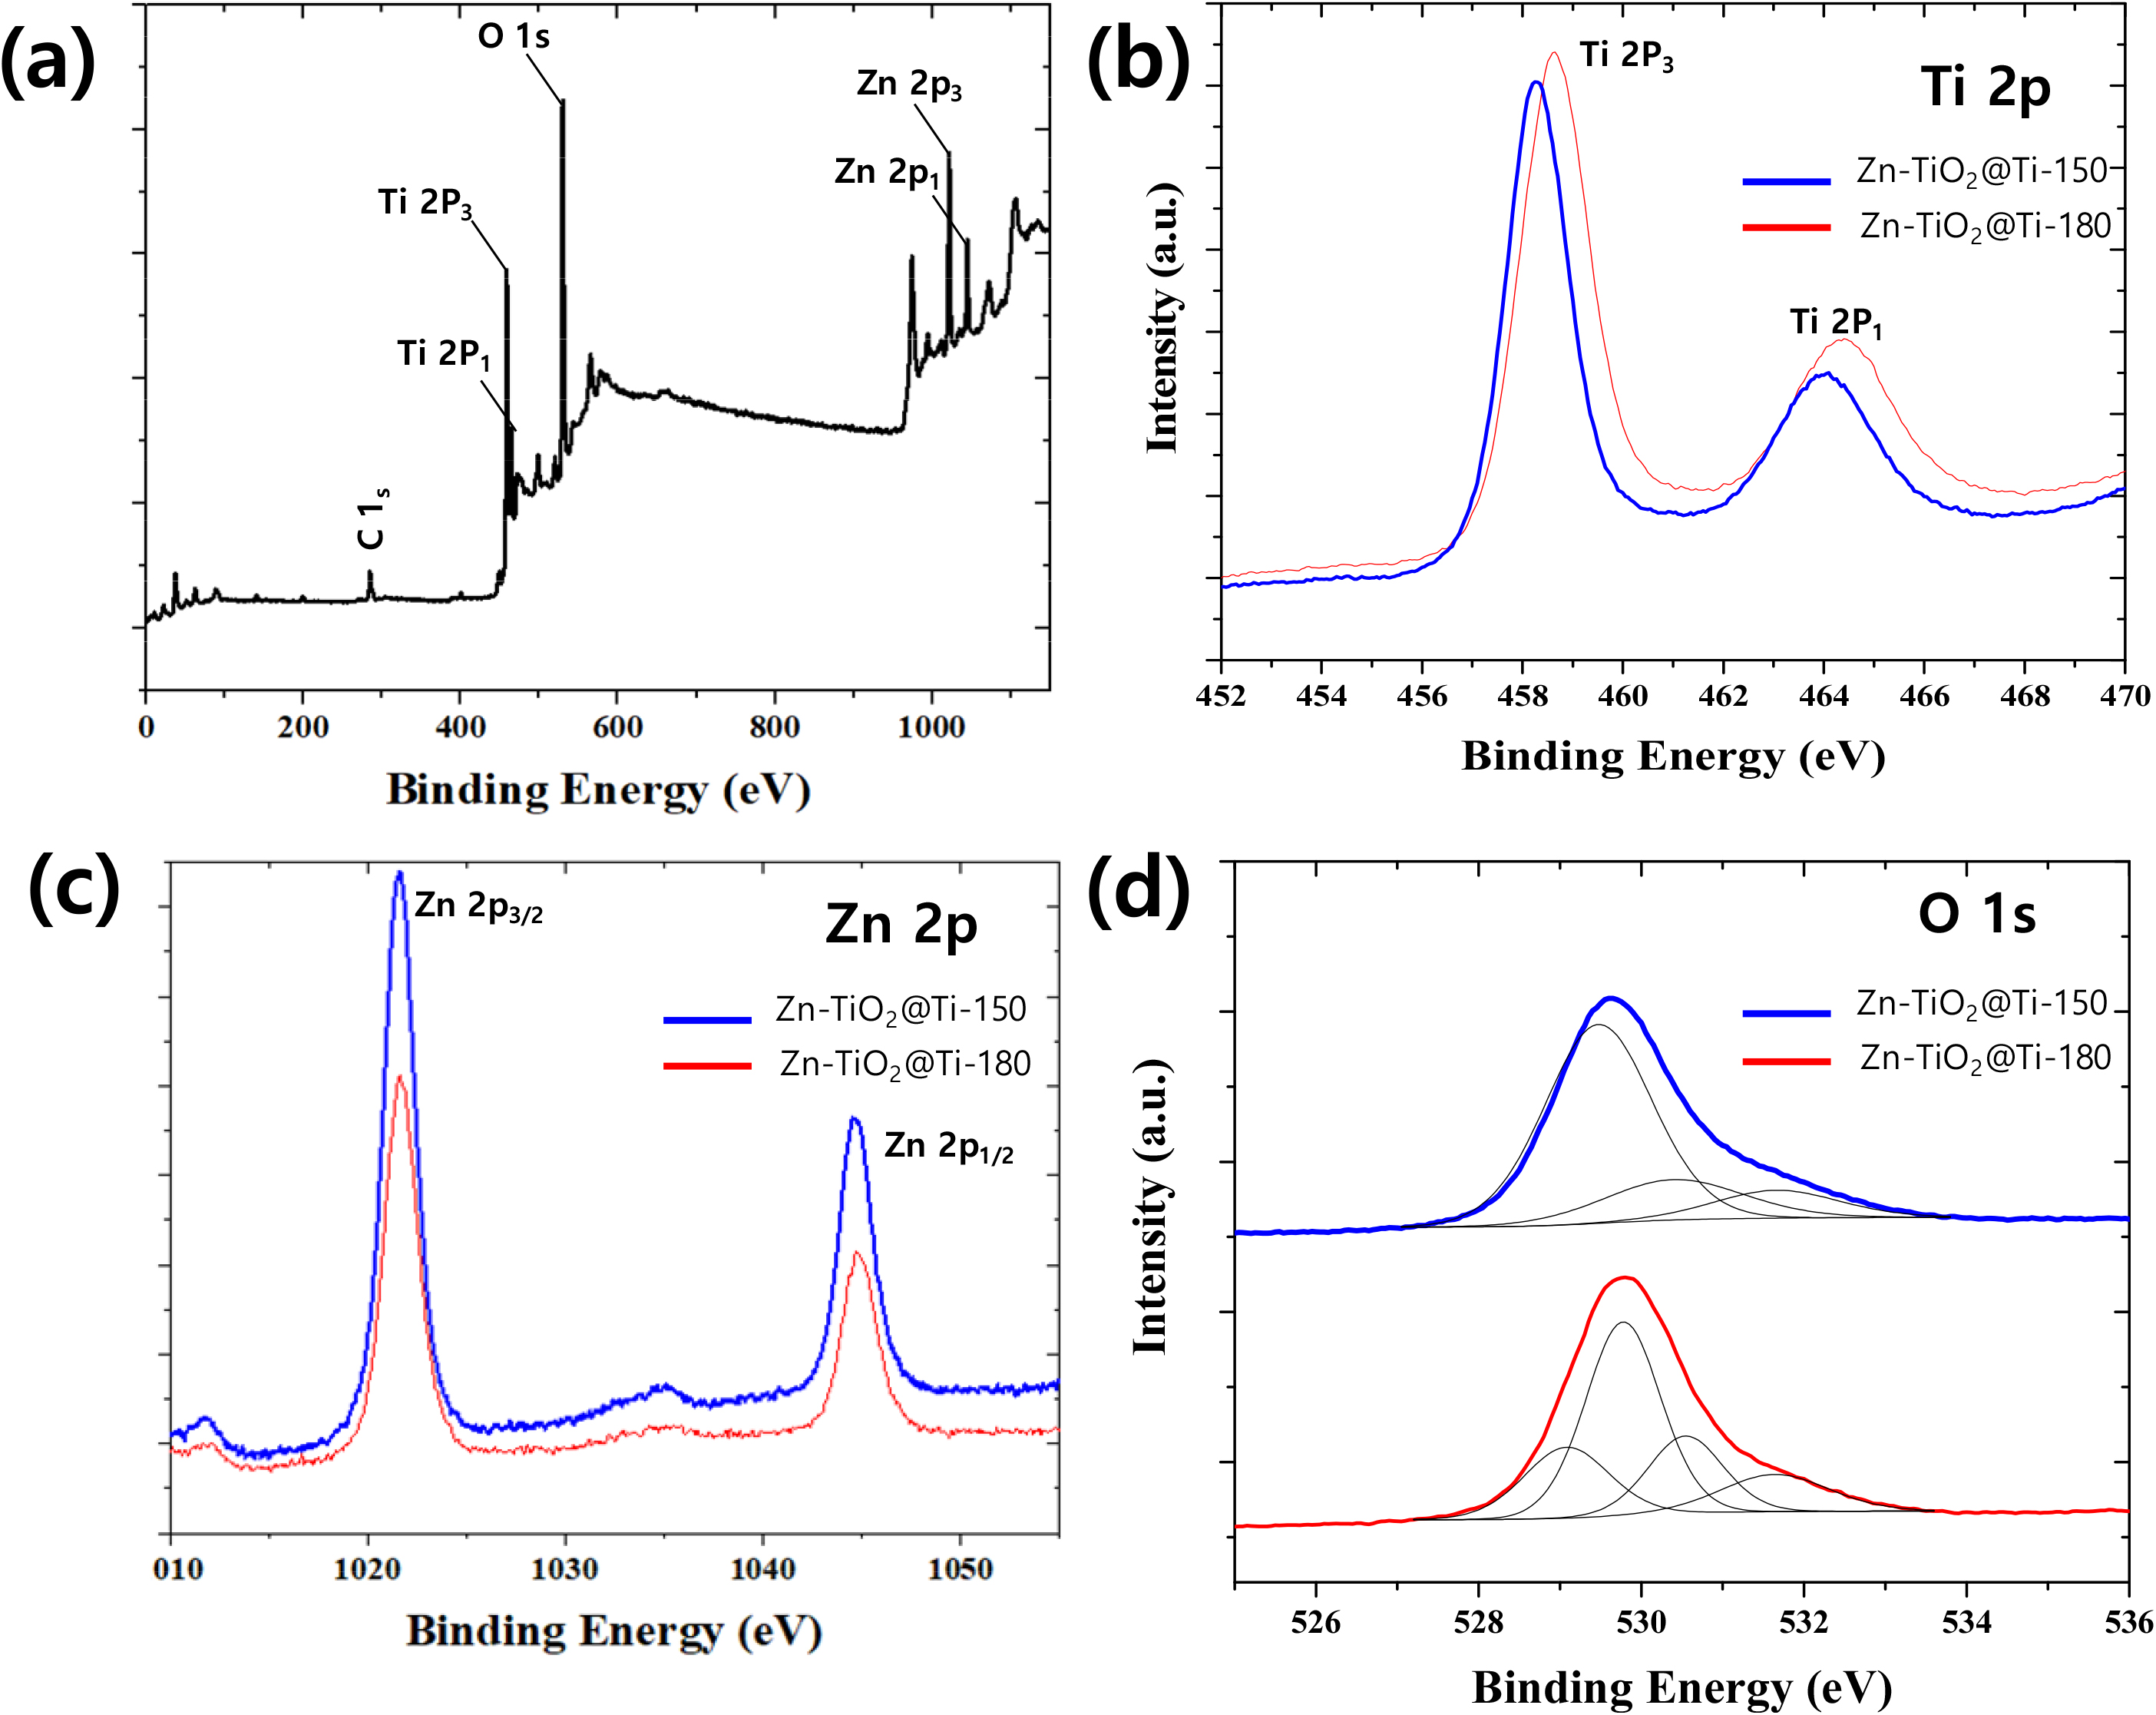
XPS is further used to testify the composition and valence state of elements in Zn-TiO2@Ti. C1s peak located at 284.6 eV is selected as reference. The XPS survey spectrum of Zn-TiO2@Ti [Fig. 4(a)] indicated the presence of Ti, O, and Zn elements. Fig. 4(b) shows the Ti 2p spectra of the Zn-doped TiO2@Ti obtained at different temperature. The two peaks are located at 464.3 and 458.6 eV correspond to Ti 2p1/2 and Ti 2p3/2 and the binding energy difference between these two peaks are of about 5.6 eV, which supports the chemical element state of Ti4+ assigned in an anatase TiO lattice.26) Increasing the reaction temperature, the two spin-orbit components are shifted to higher binding energy due to the change in the electronic interactions of Ti atoms owing to the substitution of Ti4+ by Zn2+ in Zn-doped TiO2@Ti obtained at 180 °C.27) The Zn 2p1/2 and Zn 2p3/2 spectrum determined from Zn-TiO2@Ti is shown in Fig. 4(c), which displays characteristic peaks at 1,044.9 and 1,021.7 eV, respectively. The energy splitting of the two peaks is 23.1 eV, which is relevant to chemical element state of Zn2+.28) The asymmetric peak of O 1s spectrum is deconvoluted into four peaks at 531.6, 530.5, 529.8, and 529.1 eV, as shown in Fig. 4(d). The peak at low BE of 529.1 eV and 529.9 eV were attributed to the oxygen ions in the hexagonal crystalline structures surrounded with Ti or zinc ions. Additionally, the peak at the high BE of 531.6 eV was assigned to hydroxyl oxygen (OH) on the sample surface. Importantly, the peak at the middle BE of 530.5 eV is attributed to oxygen vacancies (VO). The intrusion of a dopant with a lower charge than Ti4+ can alter the concentration of these oxygen vacancies.29) All the results from XPS demonstrate the successful synthesis of Zn doped TiO2 coating on Ti surface.
3.2. Wettability of the modified surface
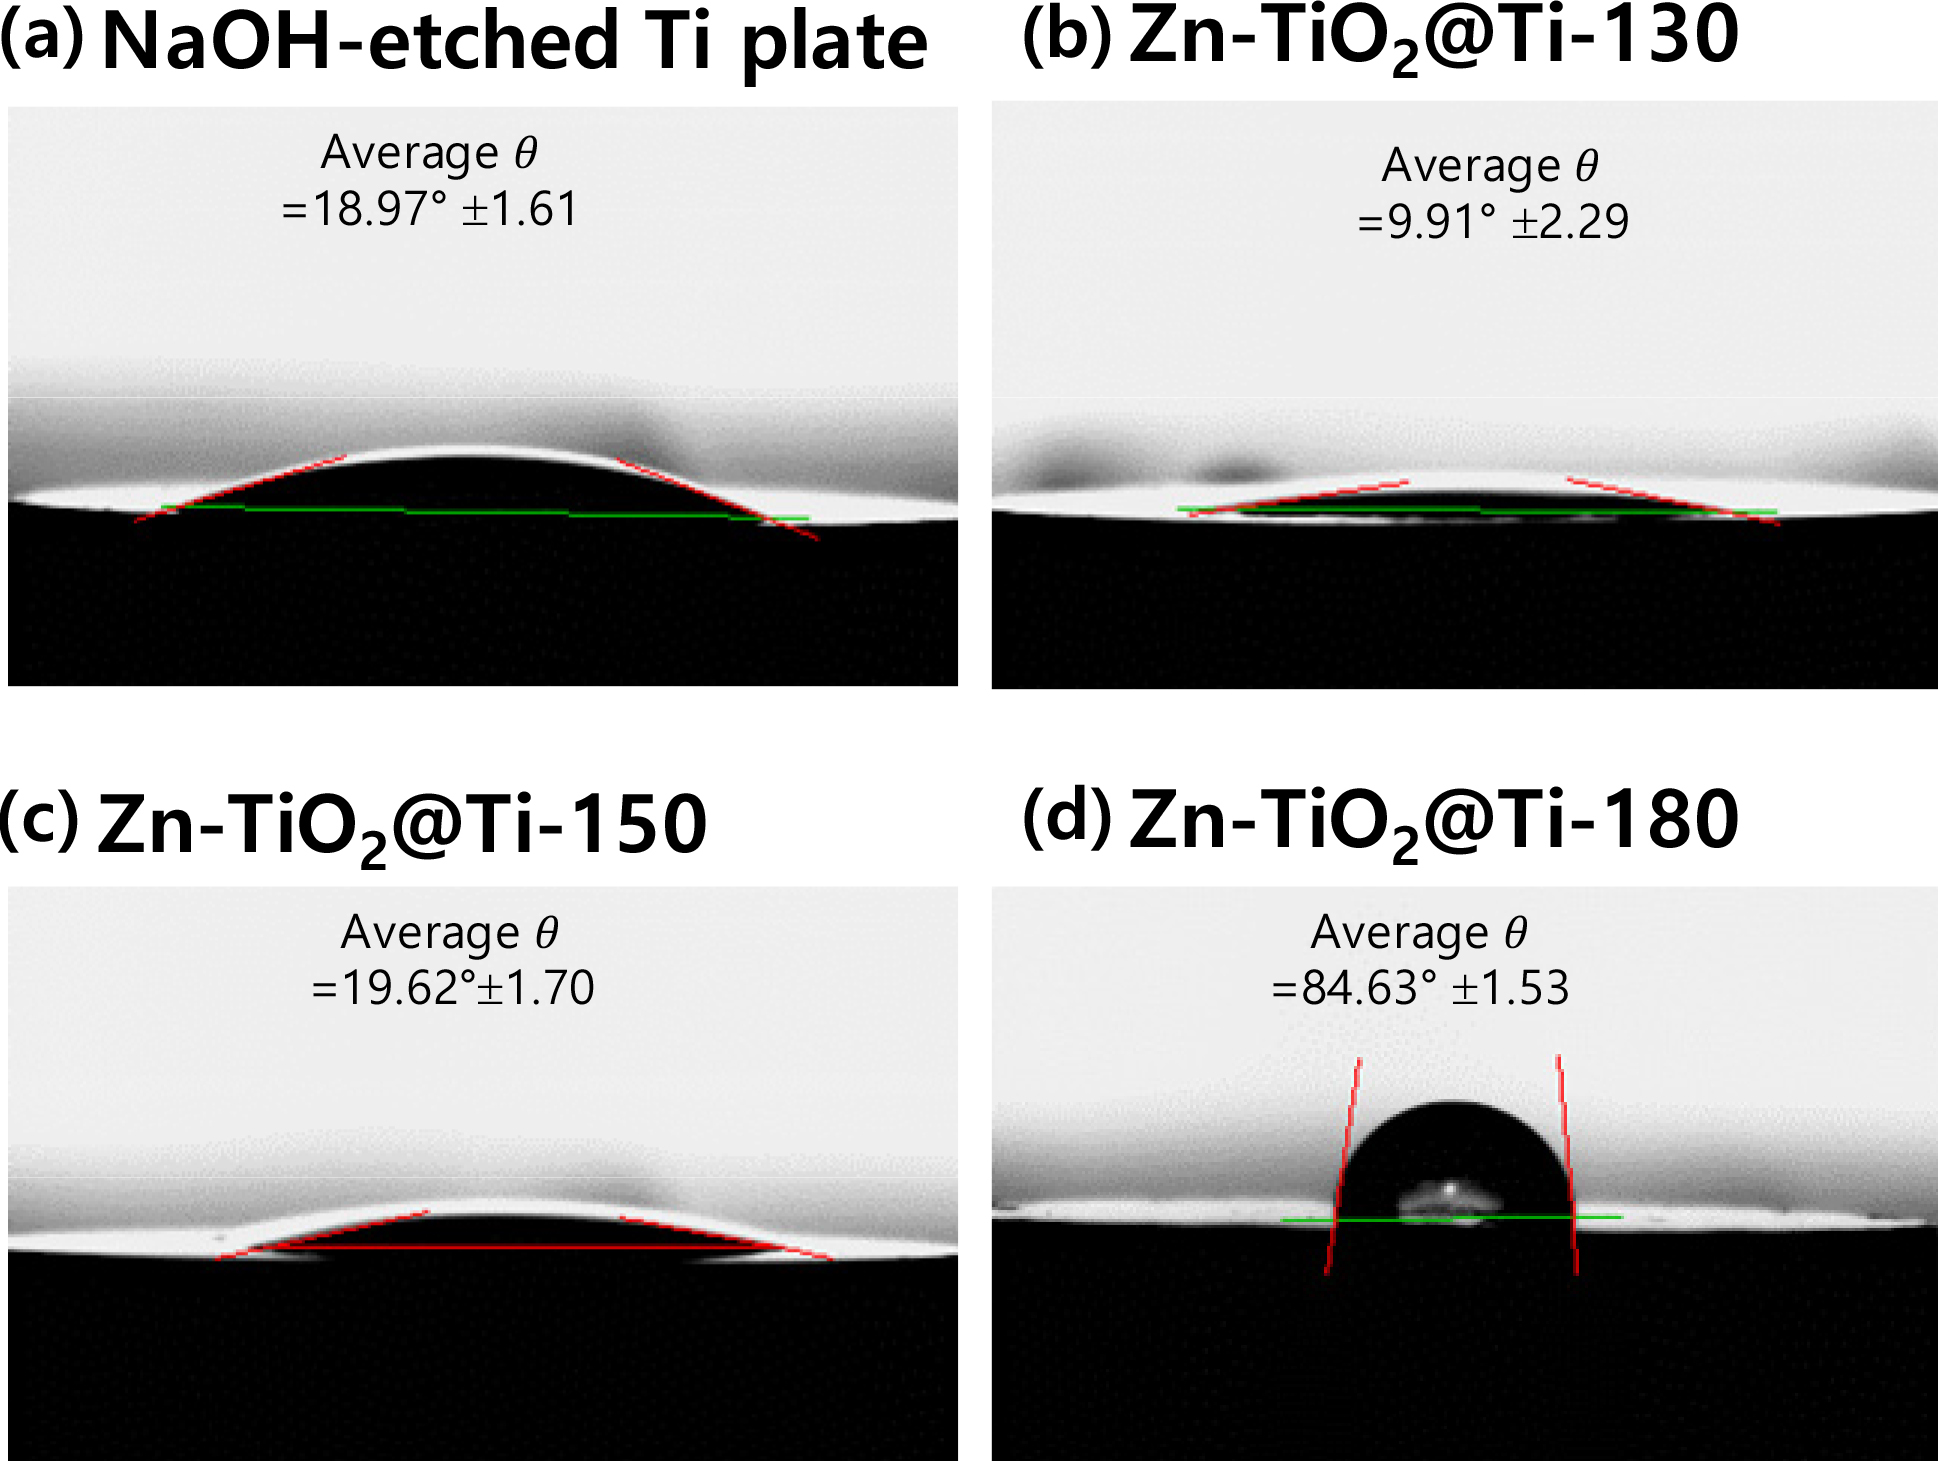
The hydrophilicity is one of the desirable properties on any implant surfaces, as it significantly influences cell adhesion, spreading, and proliferation.30,31) Notably, among the three crystal structures of TiO2—rutile, anatase, and brookite—the anatase structure exhibits higher wettability due to the distinct atomic bonding configurations.32) The wettability of the TiO2 surface was evaluated using water contact angle measurements. As depicted in Fig. 5, the NaOH-etched Ti showed a water contact angle 18.97 ± 1.61°, indicative of enhanced hydrophilicity due to the abundance of hydroxyl groups on the surface post-etching process.33) This hydrophilicity was further improved after the hydrolysis and condensation of Ti and Zn sources with ammonia water, which led to the formation of nanometer-sized anatase TiO2 on the Ti surfaces. The presence of nanosized the Zn-doped anatase phase TiO2 layer further reduced the contact angle to 13.03 ± 1.70°, reflecting an increase in hydrophilicity, which is critical for material biocompatibility.34) Consequently, the layers of Zn-doped anatase TiO2 are expected to positively influence the cytocompatibility of the materials, though further research is required to confirm these findings. Conversely, the Zn-TiO2@Ti surface treated at 180 °C became more hydrophobic, with a contact angle of 84.63 ± 1.53°, presumably due to the larger particle sizes and the presence of the rutile phase.
3.3. Cell viability of Zn-TiO2@Ti samples
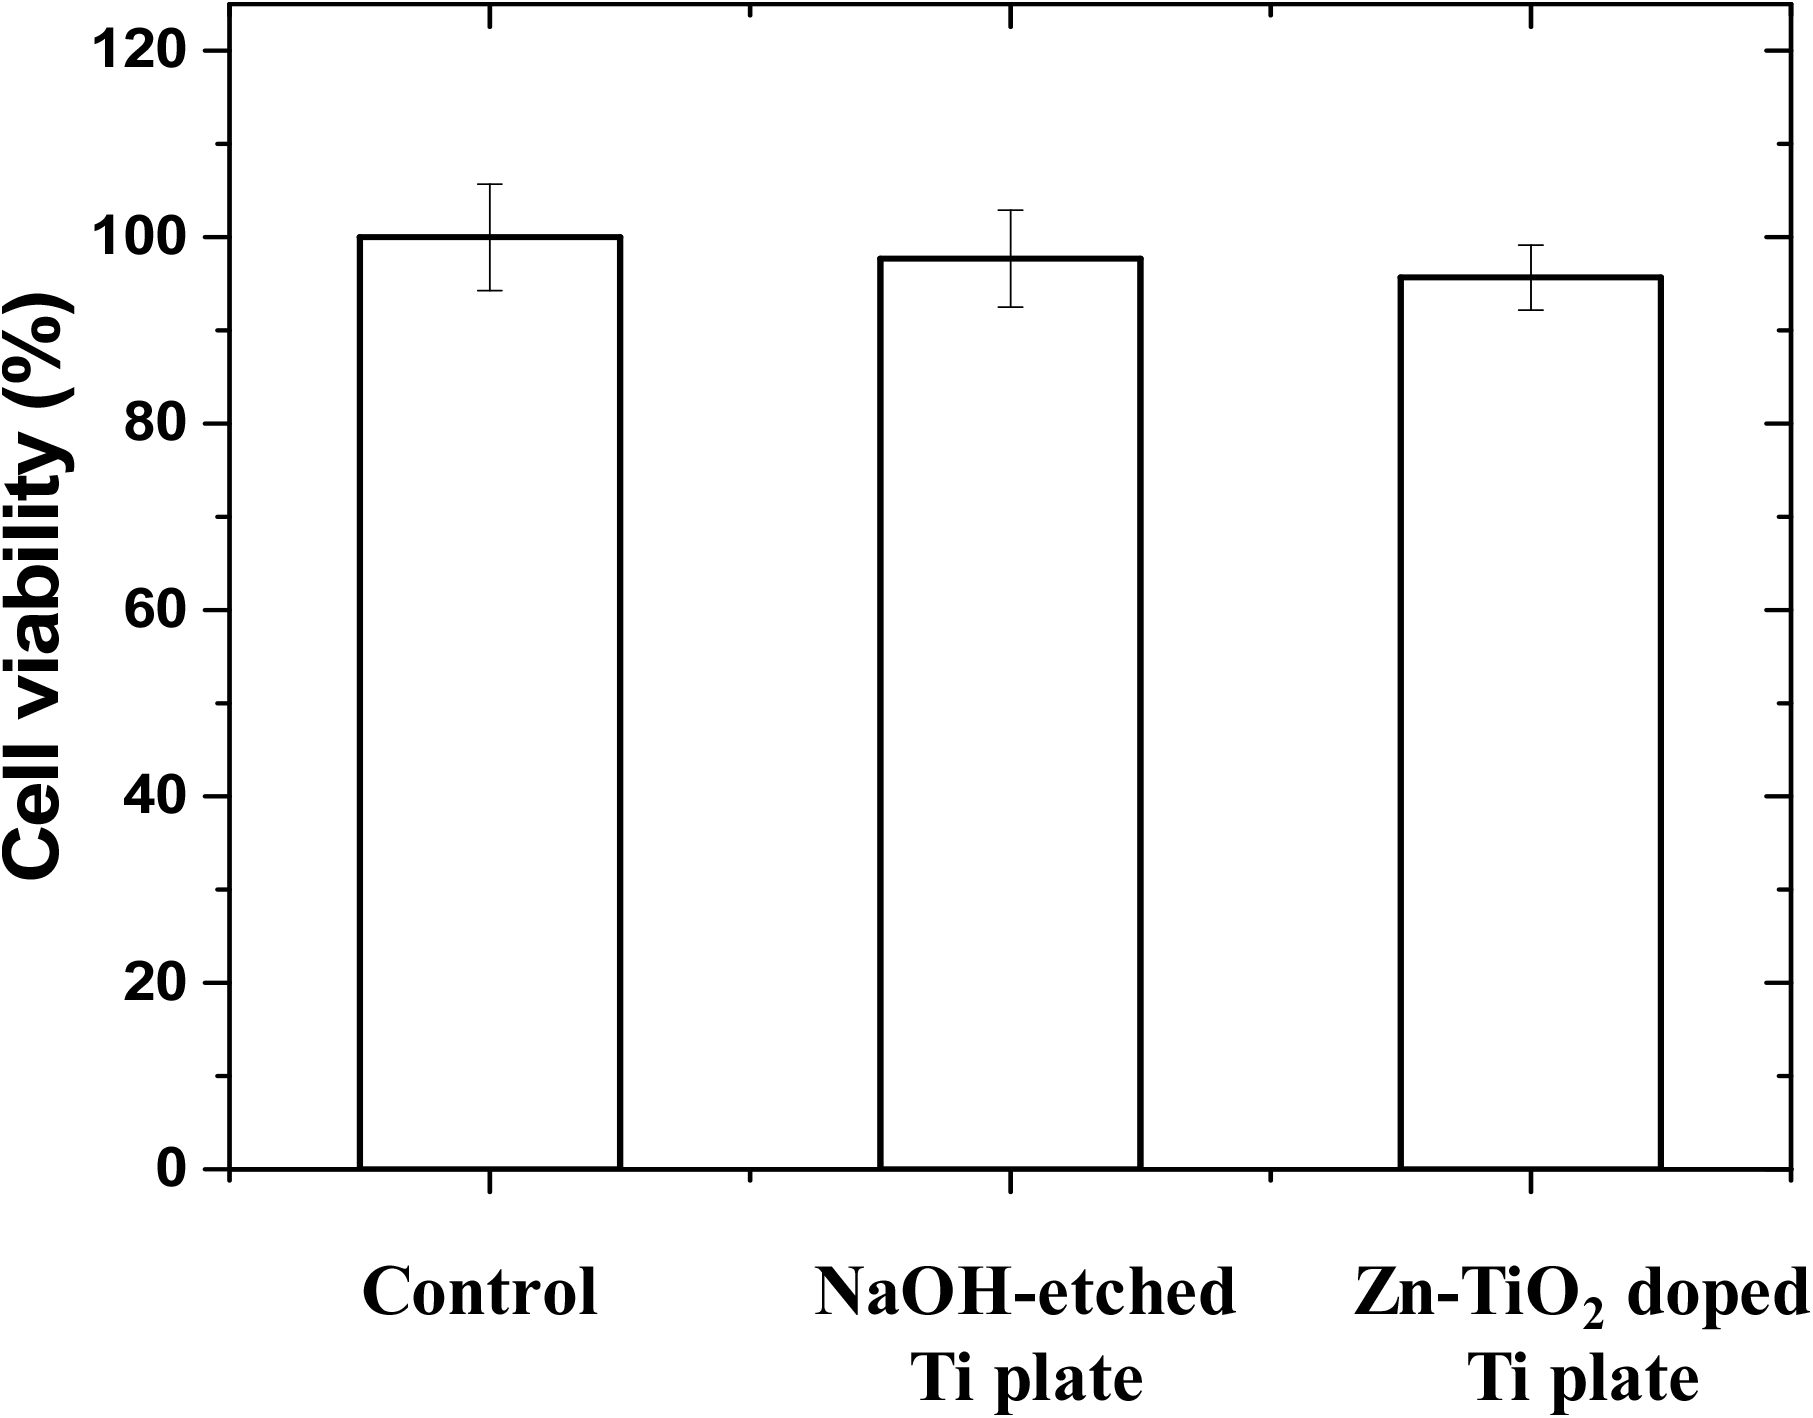
Cell viability is determined using an optical analyzer and expressed as the percentage of viable cells relative to the total number of cells.35) This measurement is crucial for evaluating the biological activity of materials intended for medical applications. In this work, the MTT assay against MG63 osteoblast-like cells was utilized to assess the response of cells of the NaOH-etched Ti plate and Zn-doped TiO2 Ti plate. As shown in Fig. 6, the minimum cell viability ratio was about 97.7 ± 5.2 % for NaOH-etched Ti plates and 95.7 ± 3.5 % for Zn-doped TiO2 coated Ti plates (Zn-TiO2@Ti-150), indicating the high biocompatibility of these materials (p < 0.05). Compared to the control, both Ti substrates displayed only a slight, statistically insignificant decrease in cell survival, confirming that the presence of Zn does not negatively impact osteoblast cells. The nanosized anatase Zn-doped TiO2 has enhances the wettability of the Ti surface without compromising cell viability. This illustrates that the method of NaOH etching followed by hydrolysis co-condensation is an effective technique for easily applying Zn-doped TiO2 coatings onto Ti surfaces, suitable for diverse biomaterial applications.
3.4. Electrochemical analysis
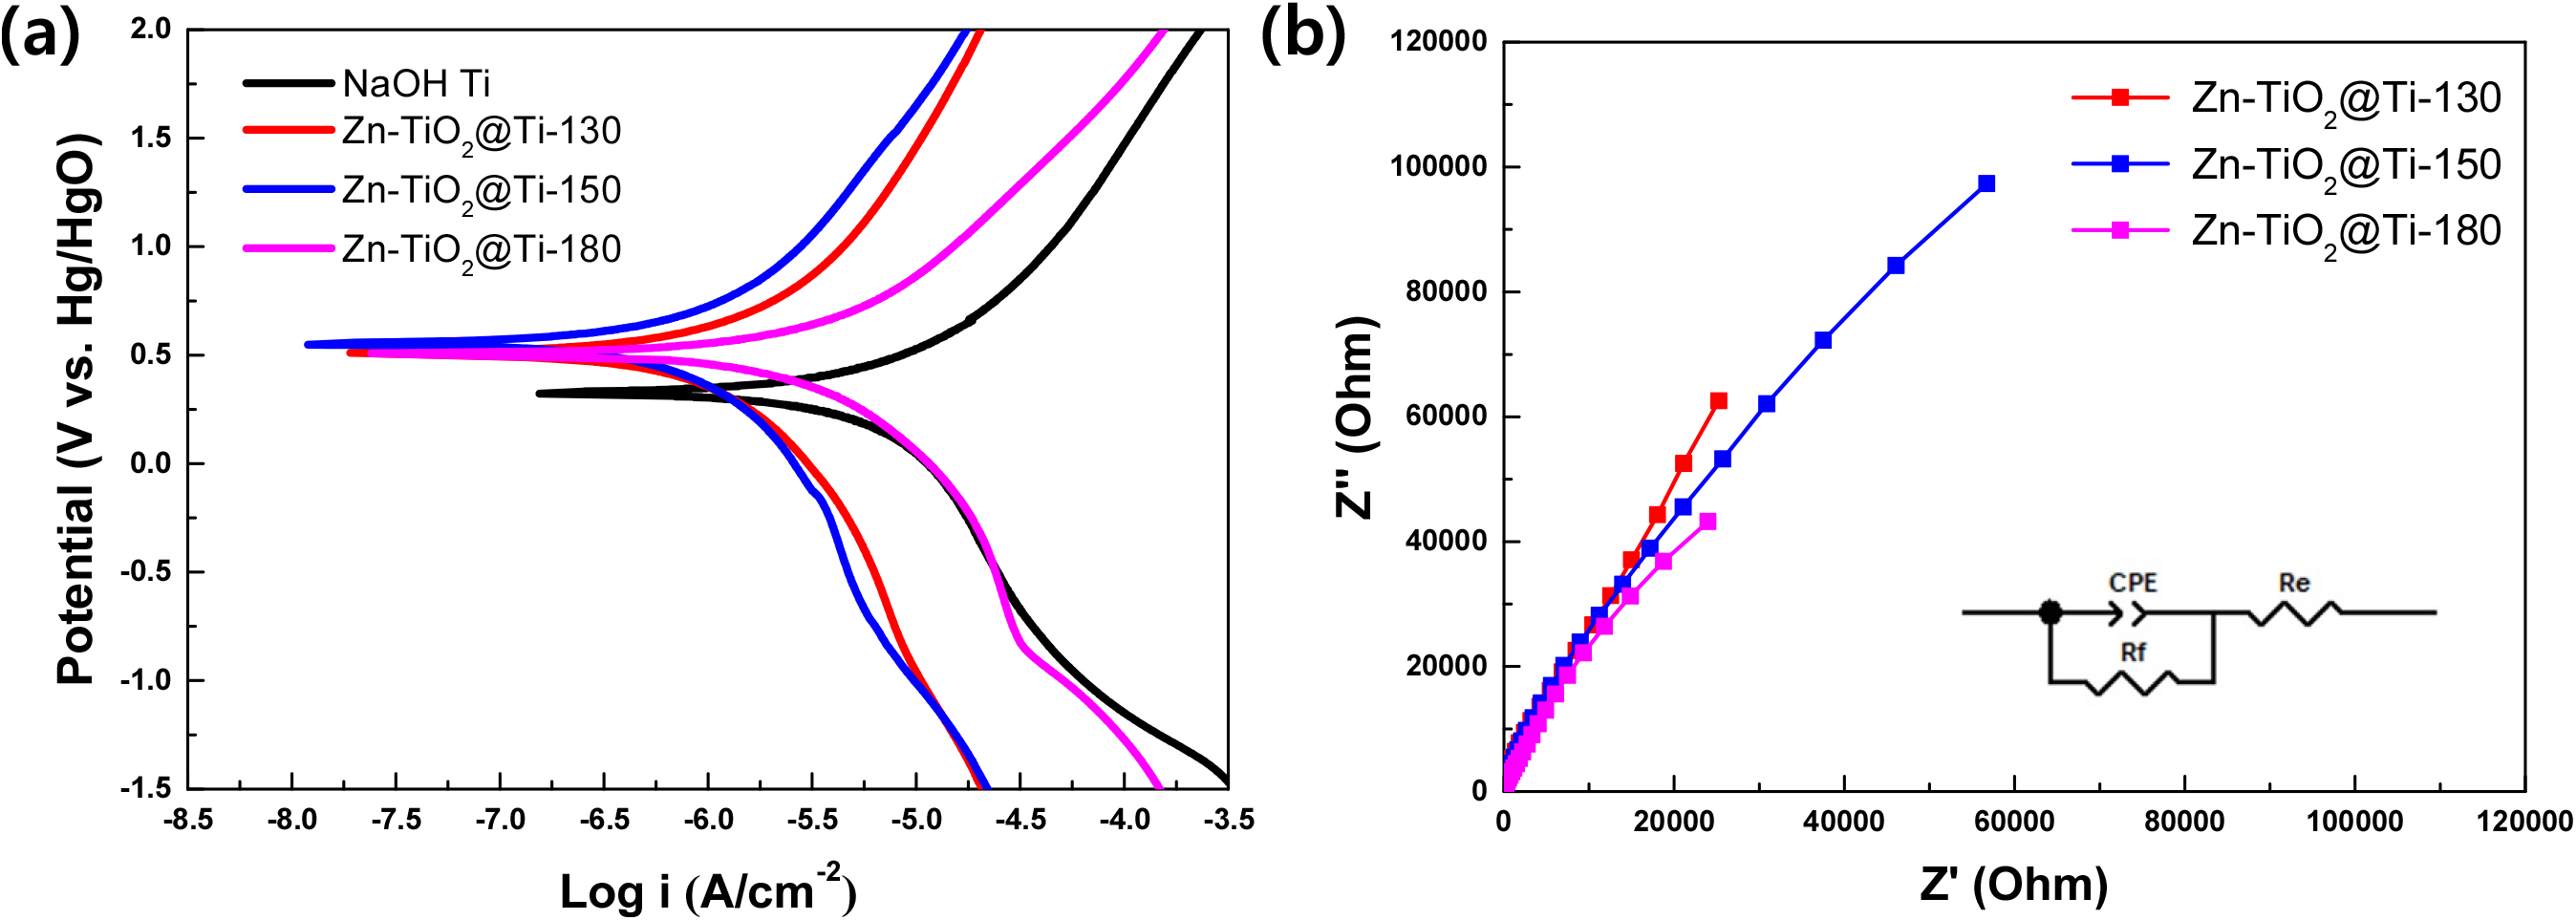
The potentiodynamic polarization and EIS measurements provide comprehensive insights into the corrosion resistance of the specimens. The polarization curves reveal the electrochemical behavior, while the Nyquist plots from EIS highlight the charge transfer resistance.36) By comparing these results, we can determine the relative corrosion resistance of the different specimens tested in the 0.9 % NaCl solution. The potentiodynamic polarization curves, shown in the Fig. 7(a), illustrate the anodic and cathodic behaviors of the samples, with specific focus on the corrosion potential (Ecorr) and corrosion current density (icorr). The calculated values of Ecorr and icorr for each sample are summarized in Table 1. The Zn-TiO2@Ti-150 sample demonstrates the highest corrosion resistance, indicated by its more noble corrosion potential of 0.55 V vs Hg/HgO and the lowest corrosion current density of 1.30 µA/cm². In contrast, the NaOH@Ti sample exhibits a corrosion potential of 0.32 V vs Hg/HgO and a much higher corrosion current density of 10.27 µA/cm², indicating poor corrosion resistance compared to the other samples. Meanwhile, the Zn-TiO2@Ti-130 sample exhibits a corrosion potential of 0.51 V vs Hg/HgO with a corrosion current density of 2.18 µA/cm². The electrochemical properties are further explored through EIS. The Nyquist plot of EIS measurements serves as a tool for investigating the ion transport kinetics at the electrode-electrolyte interface.36) A smaller semicircle diameter in the plots indicates reduced resistance at the electrode-electrolyte interfaces, reflecting improved carrier transportation performance. Specifically, the Nyquist plot in Fig. 7(b) reveals that the Zn-TiO2@Ti-150 sample exhibits better electrochemical performance compared to Zn-TiO2@Ti-130, as evidenced by the smaller semicircle diameter, which implies lower charge transfer resistance and enhanced ion transport kinetics. On the other hand, the Zn-TiO2@Ti-180 sample shows the smallest semicircle, indicating the best electrochemical performance among the three samples. The Zn-doped TiO2 coated Ti samples exhibit greater corrosion resistance compared to the NaOH-treated Ti samples. Additionally, the anatase structure enhances the corrosion resistance of the implant Ti surface more effectively than the rutile structure. This is likely due to the fact that the anatase phase provides a higher surface area and better bonding with the substrate using co-condensation, which improves the barrier properties and reduces the rate of corrosion. Moreover, the presence of Zn ions may contribute to the formation of a more stable and protective oxide layer on the Ti surface.
Overall, the study concludes that Zn-doped TiO2 coatings, particularly those with an anatase structure, significantly improve the corrosion resistance of Ti implants, making them more suitable for biomedical applications.
Table 1.
Electrochemical parameters extracted from Tafel plots for various surface-modified Ti samples. The parameters include corrosion potential (Ecorr), corrosion current density (Icorr), cathodic Tafel slope (βc), and anodic Tafel slope (βa).
4. Conclusion
This study successfully developed and characterized Zn-doped TiO2 nanostructured layers on Ti substrates through a straightforward chemical etching and hydrolysis co-condensation method. The dominance of the anatase phase, noted for its superior biocompatibility and photocatalytic properties, is crucial for medical implant applications. Through careful adjustment of the synthetic conditions, we achieved Zn-doped nanosized bipyramidal anatase TiO2 on the Ti plates. Wettability studies indicated that Zn doping substantially increased the hydrophilicity of the Ti surfaces, which is beneficial for cell adhesion and proliferation. The cell viability tests further confirmed that the Zn-doped TiO2 coatings do not adversely affect the cytocompatibility, maintaining over 95 % cell viability, thus showing potential for improving the performance of dental and orthopedic implants. EIS reveals that Zn-doped TiO2-coated Ti samples exhibit better corrosion resistance compared to NaOH-treated Ti. Specifically, Ti coated with Zn-doped TiO2 in the anatase structure shows higher corrosion resistance than those in the rutile structure. Therefore, using anatase-structured Zn-doped TiO2 coatings on Ti implants would be more beneficial. Future research could focus on in vivo testing to further validate the clinical applicability of these coatings in orthopedic and dental implants.


