

1. Introduction
Collagen is one of the main and most abundant proteins in human tissues and other organisms.1-6) So far, more than 28 different types of collagen have been identified.7,8) Each of which has a different molecular structure, amino acid sequence and its own function.8) Due to good compatibility and good biodegradability, this protein has been widely used in food, cosmetics and biotechnology industries.9) Type I collagen is the major structural protein and also the most abundant type of collagen in human and animal skin.10) Mostly, type I collagen is isolated from the skin and bone of terrestrial animals, such as pigs, cattle and chickens. However, religious prohibitions and concerns about the prevalence of Bovine Spongiform Encephalopathy (BSE), Foot and Mouth Disease (FMD), Transmissible Spongiform Encephalopathy (TSE), and avian influenza to humans have limited the use of this type of collagen.10,11) The collagen extracted from skin and scale of different fish species have been considered.11) The primary reasons for using fish skin collagen include its excellent biocompatibility, low antigenicity. 11) great cell adhesion,12) and suitable biodegradability compared another biopolymer.7) The fish collagen as a scaffold for hard and soft tissue engineering has been studied.13-20) The methods such as using acidic and enzymatic components can well extract the collagen from tissues.21) Collagen has a relatively poor fiber structure, and low solubility in aqueous solution, but is readily soluble in acidic media. Hence, acidic solutions such as acetic acid, citric acid, or other acids are often used for its extraction and formation.22,23) Studies have showed that low-temperature extraction using organic acids can greatly preserve the three-dimensional and helical structures of collagen and the biological activity of collagens.7) Unfortunately, most of the collagens extracted from fish tissues have disadvantages such as high-water absorption, fast biodegradability, and also low denaturation temperature that can change their structure in room temperature. Physical, chemical, and enzymatic cross-linking methods have been used to improve and modify the mentioned problems. The N-(3-Dimethylaminopropyl)-N′-ethyl carbodiimide hydrochloride (EDC), as one of the most known chemical cross-linkers, are used for cross linking many biomaterials, especially proteins, by linking carboxylic acid and amine functional groups.13) In this study, collagen was extracted from a special species of fish (Ctenopharyngodon Idella), and investigated its properties. Then, the extracted collagen was formed as a porous scaffold, and modified with EDC cross linker to be suitable for tissue engineering applications.
2. Materials and Method
2.1. Collagen extraction
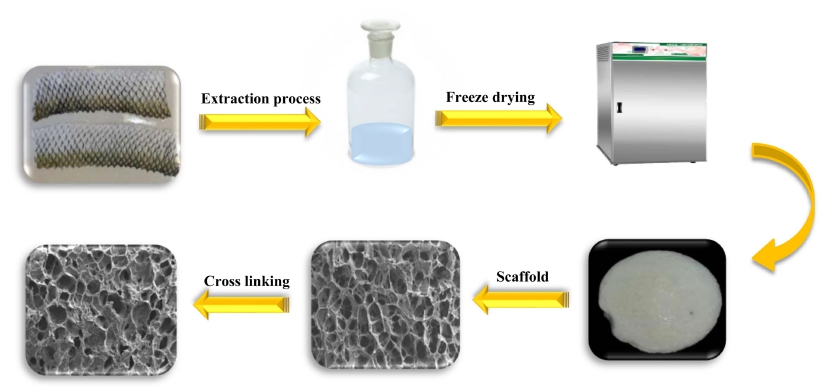
Fish skins from Fresh Grass Carp (Ctenopharyngodon Idella) were purchased from the fisheries center (Gilan Province, Iran) and scrubbed after washing with cold distilled water. Fish fat was removed from the skins using 10 % n-butyl alcohol for 24 hours. The defatted skins were mixed with 0.1 M NaOH at a ratio of 1:20 (w/v) for 6 hours to remove non-collagenous proteins and pigments. The mixture was then filtered using doublelayer gauze and rinsed with distilled water. The treated skins were swollen with 0.5 M acetic acid after drying in the air. The minced skins were continually stirred in the solution before being filtered. The filtrates were centrifuged at 10,000 r/min for 30 minutes at the same temperature of 4 °C. Collagen is allowed to precipitate by adding 2.5 M NaCl and stored for 24 hours. The precipitates were centrifuged for 20 minutes at 4 °C at 10,000 rpm, then re-dissolved in 0.5 M acetic acid. The obtained collagens were dialyzed (12 kDa cut-off) for 1 day against 0.1 M acetic acid and 2 days against deionized water, with the solution replaced every 8 hours, and they were then lyophilized (Fig. 1).
2.2. Sodium dodecyl sulphate polyacrylamide gel electrophoresis (SDS-PAGE)
SDS-PAGE of the type I collagen was performed using 5 % (Stacking) and 7.5 % (Running) polyacrylamide gels in a vertical slab (1 mm thick) under reducing conditions. The samples were diluted with SDS-PAGE sample buffer containing 5% (v/v) 2-mercaptoethanol, and then incubated in a boiling water bath for 5 minutes. The delayed reducing methods were used to distinguish α1 and α2 chains. Equal volumes of the collagen samples were then loaded into each sample slot to accurately compare the intensity of the protein bands. Finally, the gel was stained by Coomassie blue (Sigma, USA). The relationship curve of relative molecular weight (Mw) and relative mobility (Rm) of type I collagen chains (α1 and α2) were drawn based on the known relative Mw of type I collagen chains.24-26)
2.3. Porous scaffold
The extracted collagen was solved in HCl solution (1 mM) to form a stable solution with a 5 mg/mL con- centration and stirred at 1,000 rpm for 1 hour. Then the obtained solution was quickly poured into a template to freeze at -80 °C, then lyophilized for 24 h. The freezedried scaffold was cross-linked in 0.1% EDC solution in ethanol/water (90/10), pH: 5.5 for 4 hours, and washed with ultrapure water for several times.
2.4. FTIR analysis
The non-crosslinked and cross-linked scaffolds were weighed and mixed by grinding with potassium bromide (KBr). The mixture was pressed into tablets to prepare for measurement by a Fourier transform infrared spectroscopy (FTIR) (BoMem Model MB100), at room temperature of 25 °C, the scan range of 500 ~ 4,000 cm-1.
2.5. DSC analysis
The denaturation temperature was determined by differential scanning calorimetry (DSC) (Diamond DSCPerkinElmer, USA). The non-crosslinked and crosslinked scaffolds were dissolved in 0.05 M acetic acid, with a concentration of 5 mg/mL. Approx. 2 mg samples were sealed in an aluminum pan with an empty pan as reference. The endothermal curve of the sample was recorded at a temperature range in a nitrogen atmosphere.
2.6. Structural analysis
Scanning electron microscopy was used to study the structure of the scaffolds. The samples were covered with a thin layer of gold, and then the imaging process was performed by scanning electron microscope (SEM) (Cambridge Stereo-scan (S-360)) at 20 v.
2.7. Degradation test
The mass loss of scaffold samples as a function of exposure time into a collagenase solution was monitored using an in vitro enzymatic degradation assay (Sigma- Aldrich, USA). PBS containing 5 U/mL type I collagenase was used to degrade 20 mg of the 100 μm thick freezedried scaffolds. At 37 °C, the tubes were put in a shaking water bath. To maintain adequate enzymatic activity, the collagenase solution was replaced every eight hours.27) The samples were weighed at various periods, and the percentage of weight loss was estimated using the eq. (1).
Where Wi represented the initial dry weight of scaffold, and Wf: the dry weight of the recovery fragment of scaffold after the degradation.
2.8. Cell study
The toxicity of the scaffolds was evaluated by the MTT test, which is based on the formazan dye and reduction of MTT (dimethyl thiazole-2,5-diphenyl tetrazolium bromide). In this study, epithelial cell line (CHL-1: human melanoma cell line) was cultured on the samples. The samples were placed in sterile conditions in the center of each plate with cell suspension, and then incubated at 37 °C with 5 % CO2 for 24 hours. After 24, 48, and 72 hours, the cell surface media was removed, and the cell layer was washed with PBS, and then 20 μl of MTT stock solution was poured onto the cell layer and placed in 37 °C. Finally, the percentage of living cells was calculated at a wavelength of 570 nm.28) The fish collagen scaffolds were cut into 1 cm2 square and put in 24 cell culture plates with 10,000 epithelial cells to assess cell proliferation, and adhesion. At 37 degrees Celsius, the cells were grown in whole-cell culture media containing 10 % bovine fetal serum, penicillin/streptomycin, and L-glutamine. After 5 days, the samples were fixed with glutaraldehyde, and then dehydrated with ethanol. The samples were kept in a dryer and dried to be prepared for evaluation by Scanning Electron Microscope (SEM) (Cambridge Stereo-scan, S- 360) analysis.29,30) The proliferation rate of epithelial cell line (CHL-1: human melanoma cell line) on membranes was measured using the MTT [3-(4,5-dimethylthiazol-2- yl)-2,5- diphenyl tetrazolium bromide; Sigma, Germany] assay. UV irradiation was used to sterilize the disc-shaped membranes (Diameter: 3 mm) in a 96-well plate. In 200 μL of DMEM-F12 supplemented with 10 % FBS and 1 % penicillin/streptomycin (100 μg/mL), 4 × 10³ cells per well were transferred to the scaffolds and cultured at 37 °C, 5 % CO2, and 95 % humidity. As a control, samples were cultured in the same conditions without the membrane (Tissue culture polystyrene) (TCPS). This experiment was carried out three times. Culture media was removed after 24, 48, and 72 hours. A fresh medium containing 20 μL of MTT solution (5 mg/mL) was added to each well, followed by incubation at 37 °C for 4 hours to convert MTT into formazan crystals by the living cells' mitochondrial succinate dehydrogenases. After removing the media, 100 μL DMSO (Dimethyl sulfoxide; Sigma- Aldrich, USA) was added to dissolve the formazan. After all of the formazan crystals had been dissolved, the absorbance of each well was measured using a microplate spectrophotometer at 570 nm using 630 nm as a reference wavelength (BioTech, ELx800, USA).
On hydrogel membranes, epithelial cell line (CHL-1: human melanoma cell line) were cultivated to assess cell adherence and morphology. 10,000 cells were seeded on disc-shaped membranes (diameter: 1cm) that were put in 24 cell culture plates. The cells were grown at 37 °C with 5 % CO2 in DMEM-F12 supplemented with 10 % FBS and 1 % penicillin/streptomycin (100 μg/mL). Every two days, the culture media was replaced. After examination by phase contrast microscopy, the samples were fixedfor 2 hours in a glutaraldehyde solution (2.5 percent), washed with PBS (5 minutes), and lastly dehydrated using a serial dilution of ethanol. The samples were dried, then coated with a thin layer of gold (Joel fine coat, ion sputter for 2 hours) to produce surface conductivity and evaluated by scanning electron microscopy (SEM) under a 25-kV accelerated voltage (Philips XL30; Philips, Netherlands).
3. Results & Discussion
3.1. SDS-PAGE analysis
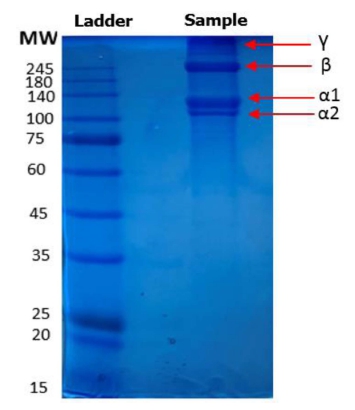
SDS-PAGE was used to determine the protein patterns of the isolated collagen (Fig. 2). The protein pattern of C. Idella's extracted collagen was identical to that of collagen type I, mostly comprised of typical α1, α2, and β chains. The band intensity of the α1 chain was higher than that of the α2 chain, with molecular weights about 100 (α2) and 140 (α1) kDa, which corresponds to the type I collagen structure.31) There was no additional electrophoretic band below the α2 chain band, indicating that the collagen had not been digested into small molecules and that the basic collagen structure had been retained. Fig. 2 also displays a chain with a large molecular weight (250 KDa). The patterns were identical to those seen in type I collagen from bovine achilles tendon,21) as well as collagens from a variety of different fish species previously reported.32-34)
3.2. FTIR analysis
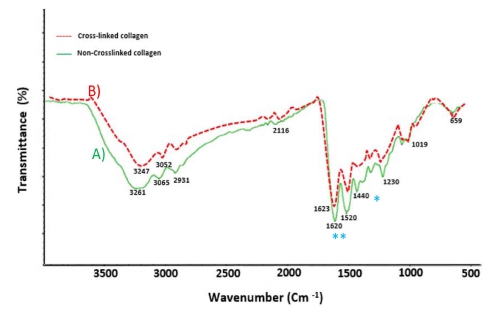
As shown in Fig. 3(A), the spectra of extracted collagen of fish skin has chemical structure similar to collagens extracted from bovine achilles tendon.21) The collagens from fish skin had characteristic absorption bands of type I collagen: the absorption peaks of the amide A and B appeared at wavelengths 3,250 and 3,060 cm-1. The band at 2,900 cm-1 were related to the asymmetric stretching vibration of CH2 groups. The C=O stretching vibration of the polypeptide backbone results in an amide I and II bands with a characteristic absorption peak within the range of 1,620 and 1,520 cm-1.35) The absorption peak of the amide III band is a combined peak generated by the C-N stretching vibration and in phase N-H bending vibration and appears within the range of 1,230 ~ 1,320 cm-1,36) which is distinct from other proteins and is related to the triple-helical structures of collagens. After EDC crosslinking (Fig. 3B), the wave number of collagen bands are almost the same as non-cross-linked samples. The Amide I band, which is the most important band for the analyzing the secondary structure of proteins, decreased in intensity (**) after crosslinking. This due to the formation of new covalent bonds because crosslinking. Which may be due to the formation of new covalent bonds in the crosslinking process. Moreover, the characteristic carboxyl stretching observed in the collagen spectrum (1,390 and 1,440 cm-1) decrease (almost disappears, *) after the crosslinking process. This proves that carboxyl groups participate in the crosslinking process. Thus, the decrease in amide I intensity and the weak peak of the carboxyl group indicate a more covalent network structure and the formation of new bonds.
3.3. DSC analysis
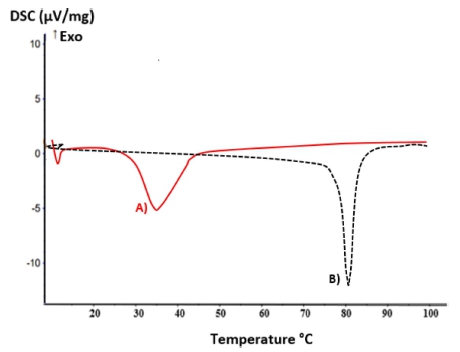
The disintegration of collagen's triple-helical structures into random coils is related to various physical processes, including viscosity, sedimentation, and diffusion. Fig. 4 shows that the denaturation temperature of extracted collagen is 30 °C, which is stable at room temperature. On the other hand, the denaturation temperature of collagens recovered from fish skins depends on the fish species and the temperature of their habitat. Collagen derived from cold-water fish has lower hydroxyproline concentrations and lower thermal stability than collagen derived from warm-water fish.34) The cross-linked collagen with EDC can increase the denaturation temperature up to 80 °C. So, they can be used for in vivo studies.
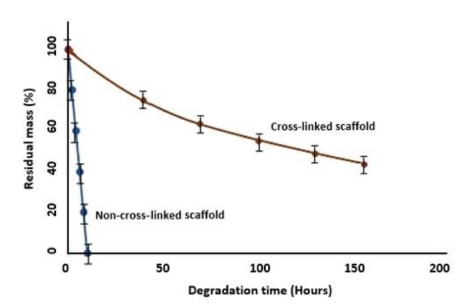
3.4. Degradation results
The biodegradation is an index which implies how long a scaffold can withstand to support tissue regeneration.37) As mentioned, collagen scaffolds aren’t stable sufficient, and rapidly degrade.38,39) Enzymatic degradation can accurately mimic the in vivo conditions,40) so collagenase enzyme was used to evaluate the enzymatic degradation of the collagen scaffold. In vitro degradation was characterized by indicating the residual mass percentage of the scaffold as a function of time (Fig. 5). The cross-linked scaffolds derived from fish skin collagen demonstrated better degree of stability, with only a ~ 50 % reduction in mass after a week, while the non-crosslinked samples were totally destroyed after 10 hours. These findings showed that cross-linked collagen with adjustable biodegradation rate has high potential to be used in tissue engineering applications.
3.5. Cell study
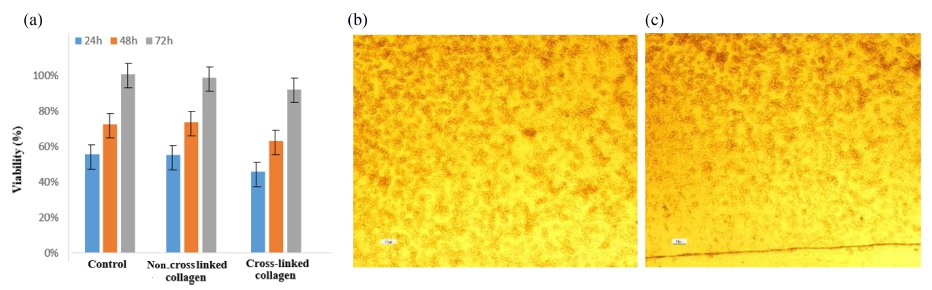
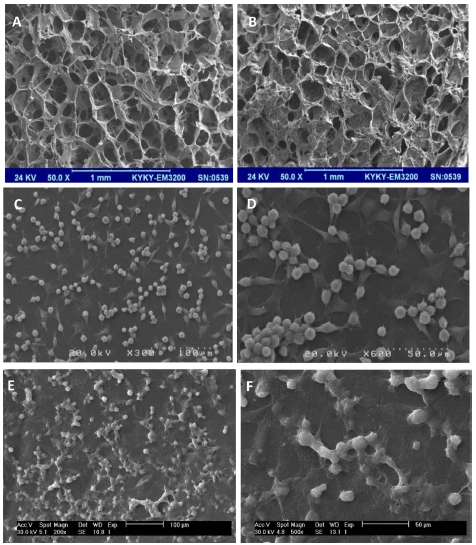
Fig. 6(A) demonstrates good bioavailability or metabolic activity for all samples, and no significant differences were observed among cross linked, non- crosslinked, and control samples. The optical microscope images [Figs. 6(B) and (C)] showed that both of the samples have good cell adhesion and proliferation. The results showed that EDC as a chemical crosslinker with the used concentration has no effect on cytotoxicity and is suitable for biomaterial designs. SEM images of the non-crosslinked and cross-linked scaffolds showed that the average pore size of the non-cross linked collagen (150 μm) was a little more than cross-linked scaffolds (100 μm) [Figs. 7(A) and 7(B)], that can be because of the crosslinking and assembling the collagen fibers. The cell results also showed that [Figs. 7(C)-(F)] the cells were successfully attached to the scaffolds. The cross-linked samples showed good adhesion, and no difference in viability and cell adhesion illustrated between samples.
4. Conclusion
The collagen as a biomaterial mainly extracted from bovine and porcine tissues which require high purification due to the transmission of common diseases between humans and animals. In this study, the collagen was successfully extracted from Ctenopharyngodon idella fish skin, and then designed as a scaffold, and finally modified by EDC cross-linker to improve its properties. The denaturation temperature as one of the noticeable disadvantages increased with cross-linker, to be suitable for medical application in body temperature, while using the crosslinker didn’t change its biological properties such as cell viability and adhesion. In addition, such a collagen that is stable in the room temperature, and also improves with low concentration cross linkers can be used for medical designs especially in tissue engineering.
