1. Introduction
2. Experimental Procedure
2.1. Material synthesis
2.2. Characterization
2.3. Electrochemical test
3. Results and Discussion
3.1. Characterization of material
3.2. Electrochemical test
4. Conclusion
1. Introduction
Lithium-ion batteries (LIBs) are receiving significant attention due to their high energy density and operating voltage. These batteries are widely used across various applications, including portable electronic devices, energy storage systems (ESS), and electric vehicles (EVs).1,2) In particular, the global interest in EVs is increasing due to the concern about environmental pollution. Consequently, the industry demands high-performance LIBs with higher energy density, leading to extensive research and development efforts.3,4,5) LIBs operate based on the electrochemical reaction as lithium ions move between the cathode and the anode. Battery performance, including operating voltage, energy density, and capacity, is highly dependent on the properties of cathode materials.6,7) As a result, research has dominantly focused on optimizing the cathode active materials, synthesis methods for precursors, thermal treatment processes, and additional coating and doping techniques.8,9,10) These studies aim to develop batteries with enhanced performance and stability. Lithium transition metal oxide cathode materials are typically synthesized by preparing precursors as a hydroxide form, which are thoroughly mixed with lithium sources to obtain the desired lithium transition metal oxide cathode materials.11) During the synthesis process, the final structure of the material is seriously affected by heat treatment temperature, heating rate, dwell time, etc.12,13) Therefore, optimization of heat treatment conditions is important in order to achieve high energy density and stability in the final cathode materials.
Our study explored a novel precursor synthesis method to replace the commonly used coprecipitation method for hydroxide precursor synthesis. This new method produced smaller hydroxide precursors compared to conventional methods, and we investigated optimal heat treatment conditions to enhance battery performance. As the glycine-based synthesis method is novel, direct comparisons with conventional methods are not yet available. However, we have noted in the introduction that future studies can compare this method with coprecipitation after further optimization of particle size, morphology, and electrochemical properties.
2. Experimental Procedure
2.1. Material synthesis
Ni(OH)2 was synthesized using the conventional coprecipitation method using nickel sulfate, NaOH, and ammonia solution. Meanwhile, glycine was used instead of ammonia to form the precipitate in this study. The synthesized precursor was then mixed with a lithium source at a molar ratio of 1.02 : 1 (Li : Ni) and calcined. The calcination process involved preheating at 400 °C for 4 h, followed by heating at 710 °C, 730 °C, 760 °C, and 770 °C for 12 h, with a cooling rate of approximately ~5 °C/min. In addition, to examine the effect of preheating time, samples were preheated for 8 h at 400 °C and then heat-treated at 730 °C for 12 h, with a cooling rate of ~5 °C/min. Lastly, to study the impact of the cooling rate, samples were preheated at 400 °C for 4 h and then heated at 730 °C for 12 h, followed by rapid cooling directly to room temperature. The rapid cooling rate is estimated to be significantly faster, around ~20 °C/min, though the exact rate is unknown.
2.2. Characterization
The material properties of the synthesized lithium nickel oxide cathode active material were analyzed using a powder X-ray diffractometer (XRD, D2 Phaser, Brucker, USA), a scanning electron microscope (SEM, Cara, Tescan), and a soft X-ray absorption spectrometer (Soft-XAS). XRD measurements with Cu-Kα radiation (λ = 1.5418 Å) were conducted to determine the crystal structure and phase. SEM was used to observe the size and morphology of the synthesized particles. Finally, Soft-XAS analysis was carried out at the 10A2 beamline of the Pohang Accelerator Laboratory to identify the oxidation states of the transition metals in the active material.
2.3. Electrochemical test
Electrochemical properties were evaluated using a 2032-type coin cell with a lithium metal chip as the cathode. To prepare the anode, a slurry was created by mixing the anode active material in N-Methyl-2-pyrrolidone (NMP) at a ratio of 90 : 5 : 5 with carbon black (Denka black) as the conductive material and 8 wt% polyvinylidene fluoride (PVDF) as the binder. The slurry was then dried in a vacuum oven at 120 °C for 24 h. The cells were assembled in a glove box under an argon atmosphere. Charge/discharge capacities were measured using a charge/discharge system at a rate of 0.1 C within a voltage range of 2.7~4.3 V at room temperature.
3. Results and Discussion
3.1. Characterization of material
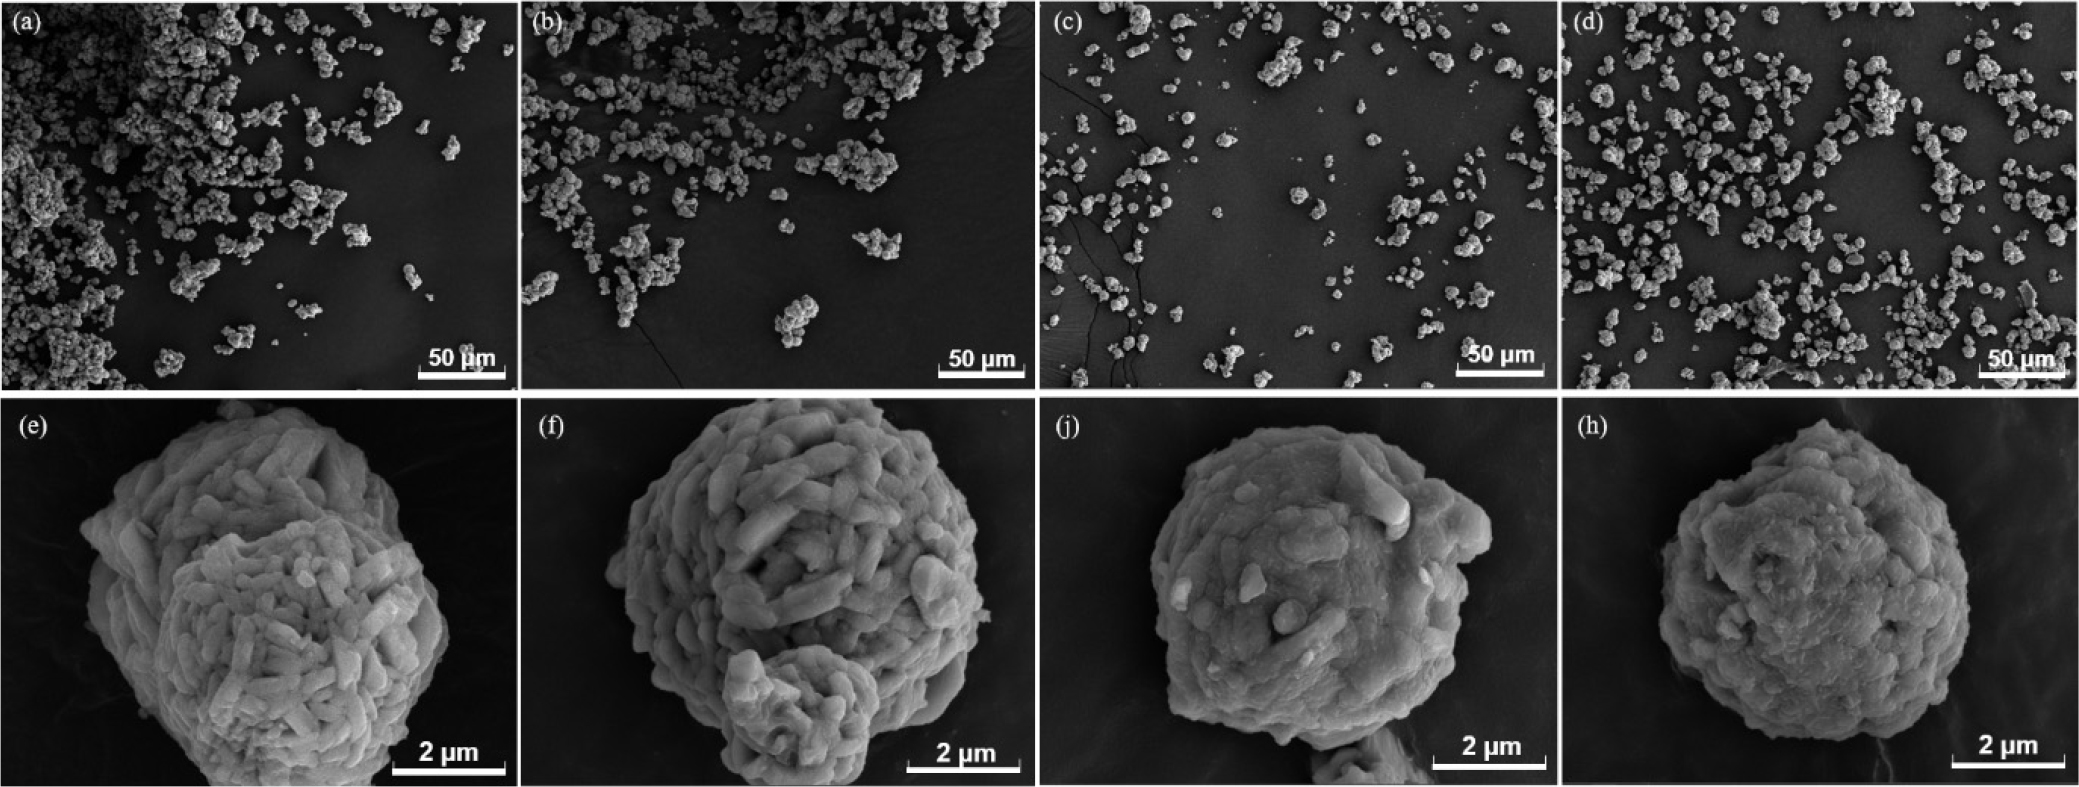
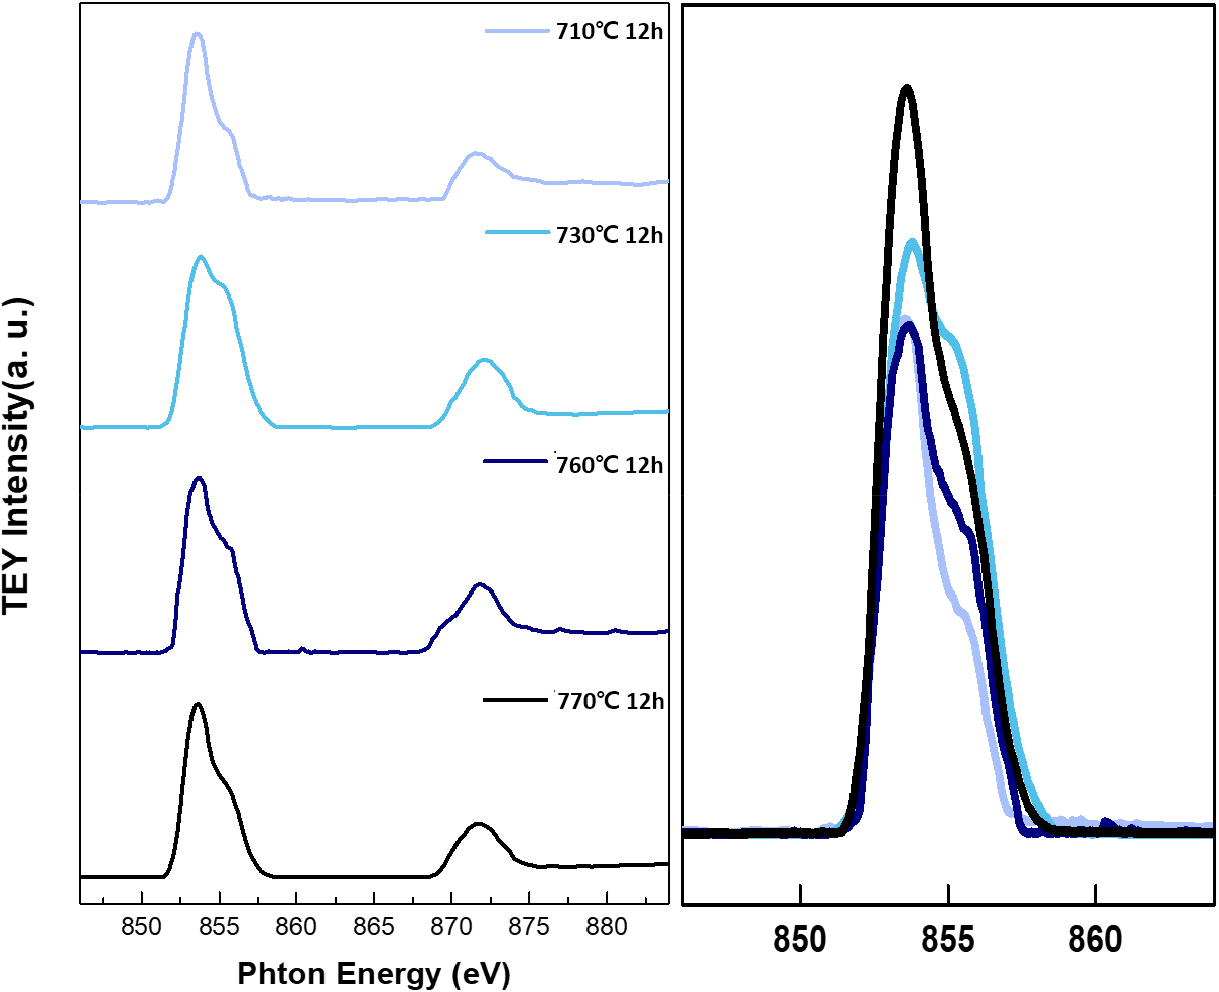
Firstly, XRD was employed to analyze the crystal structure of synthesized lithium nickel oxides, as shown in Fig. 1(a). All cathode active materials were synthesized without any additional impurities and matched well with the reference peaks of lithium nickel oxide (ICDD 00-062-08), confirming that all precursors were successfully crystallized to the lithium nickel oxide with the layered structure. Due to the similar ionic radii of Ni2+ and Li+ ions, cation mixing between Ni and Li can occur in LiNiO2.14) The XRD diffraction peak originates from the crystal plane, with the intensity related to electron density at the plane. Thus, cation mixing can be estimated by comparing the (003) and (104) peak intensities of the XRD pattern.15,16,17)Table 1 presents the ratio of (003) and (104) peak intensities, I(003)/I(104), of the cathode materials prepared under different heat treatment conditions. As shown in Table 1, the LiNiO2 heated at 730 °C for 12 h exhibited the highest I(003)/I(104) ratio, followed by those heated at 760 °C, 710 °C, and 770 °C. This suggests that cation mixing in the lithium nickel oxide could be minimized by optimum heating condition, 730 °C for 12 h. SEM analysis was also performed to examine the shape and size of the synthesized particles, as depicted in Fig. 2. The particles generally have a size of approximately 3~4 µm. SEM images reveal that samples heated at 710 °C and 730 °C exhibit primary particle structures and a polycrystalline morphology. In contrast, samples calcined at 760 °C and 770 °C display morphologies close to single crystals due to a severe sintering process. Since the primary aim of the heat treatment does not lie in synthesizing active materials with single crystal morphology, the higher temperature, such as 760 °C and 770 °C, is not suitable.18,19) Furthermore, Soft-XAS was investigated to confirm the oxidation state of nickel in the synthesized active material (Fig. 3). Soft-XAS observation indicates that Ni2+ content was relatively high in samples, particularly at 710 °C and 770 °C. In contrast, higher fractions of Ni3+ could be observed in samples calcined at 730 °C and 760 °C. The cathode material calcined at 730 °C exhibits the highest Ni3+ content. Overall, analysis of the material properties of the synthesized lithium nickel oxide suggests that the optimal heat treatment temperature exists within the 730~760 °C range. In contrast, the calcination temperature of ~730 °C is most favorable.
Table 1.
XRD patterns of LNO samples: (a) By heat treatment temperature, (b) By heat treatment condition.
| Sample | I(003)/I(104) ratio | Sample | I(003)/I(104) ratio |
| 710 12 h | 1.545 | Pre-heating 8 h | 2.132 |
| 730 12 h | 1.878 | Rapid cooling | 2.105 |
| 760 12 h | 1.788 | ||
| 770 12 h | 1.469 |
Additional experiments were carried out by extending the preheating time and accelerating the cooling rate after calcination. The XRD diffraction patterns for samples prepared under these conditions are also presented in Fig. 1(b). The diffraction patterns were consistent with previous ones, confirming the successful synthesis of LiNiO2 with the layered structure without impurity phases. Notably, both samples synthesized from the extended preheating time and the rapid cooling exhibited higher I(003)/I(104) ratios, indicating smaller cation mixing. Specifically, the sample synthesized from the increased preheating time showed the highest I(003)/I(104) ratio, likely due to the formation of the layered structure with fewer defects.20,21)Fig. 4 shows SEM images under different conditions, confirming that the 703 °C sample exhibits a similar primary particle morphology, with an overall particle size of approximately 3~4 µm.
3.2. Electrochemical test
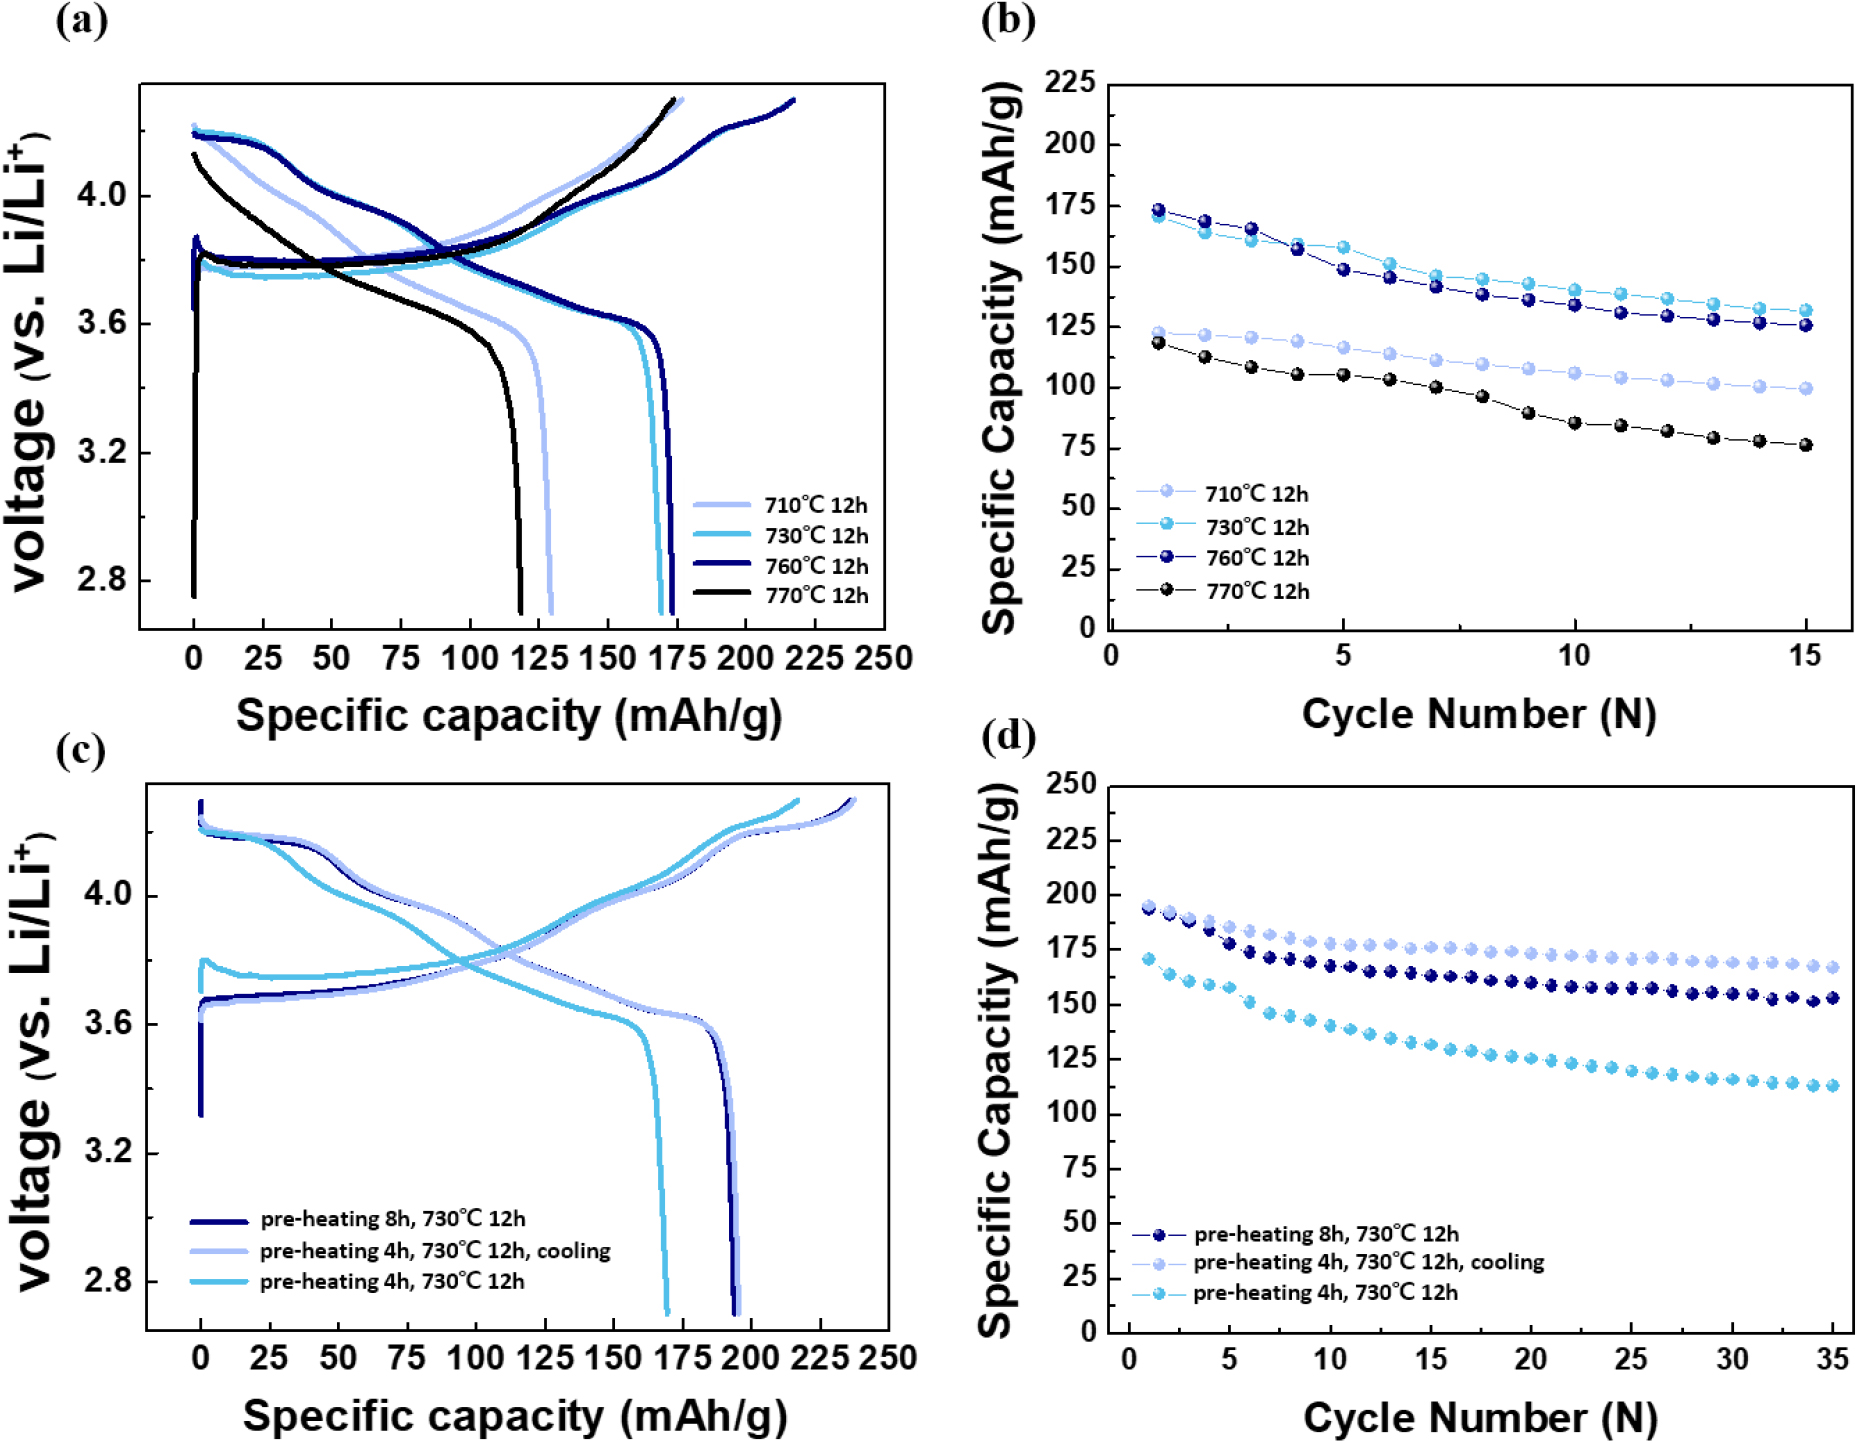
In addition to material properties, electrochemical properties were studied by galvanostatic cycling at 0.1 C with the voltage range between 2.7 and 4.3 V (Fig. 5). As predicted from the material characterization results, LiNiO2 cathodes calcined at 730 °C (170 mAh g-1) and 760 °C (173 mAh g-1) revealed higher discharge capacities in the first cycle compared to the samples calcined at 710 °C (130 mAh g-1) and 770 °C (120 mAh g-1). These results indicate that the optimal heat treatment temperature for the small-sized lithium nickel oxide synthesized using glycine lies in the range of 730~760 °C [Fig. 5(a)]. As shown in Fig. 5(b), the 710 °C sample retained 80 % of its capacity, while the 730 °C, 760 °C, and 770 °C samples retained 77 %, 72 %, and 64 % of their capacity, respectively, with the 710 °C sample showing the best cycle retention. When considering both the initial discharge capacity and the cycle performance, 730 °C can be determined as the optimal heat treatment temperature. However, the discharge capacity of LiNiO2 calcined at 730 °C is still far lower than the theoretical capacity of LiNiO2, ~275 mAh g-1, considering reversible (de)intercalation of Li+ from the structure. Again, we compared the battery performance of samples with different thermal histories, extended preheating times, and rapid cooling rates. The capacity vs. voltage curves and capacity retention are displayed in Fig. 5(c, d). As presented in Fig. 5(c), cathode materials with extended preheating time and rapid cooling rate exhibited higher discharge capacities. This observation is consistent with the observation from XRD, suggesting that these modifications could lead to the formation of a layered structure with fewer defects. A longer preheating time is expected to allow sufficient time to develop a well-formed layered structure, leading to a more homogeneous material and improved performance.22,23) Additionally, rapid cooling post-calcination can significantly impact the phase purity and particle size distribution of LiNiO2.24,25) For instance, previous studies have demonstrated that rapid cooling can help preserve high-temperature phases and prevent the formation of undesirable phases that may occur during slow cooling.26) This can result in enhanced electrochemical performance, including better capacity retention.

Fig. 5.
LNO samples: (a) First charge-discharge curves (0.1 C) by heat treatment temperatures, (b) Cycle performance graph (0.1 C) by heat treatment temperatures, (c) First charge-discharge curves (0.1 C) by different heat treatment conditions, and (d) Cycle performance graph (0.1 C) by different heat treatment conditions.
4. Conclusion
This study focused on optimizing the heat treatment temperature for smaller Ni(OH)2 precursors that were synthesized using glycine, and our findings are as follows:
(1) The optimal calcination temperature lies between 730 °C and 760 °C for a 3~4 µm-sized precursor to form the well-ordered layered structure.
(2) Extending the preheating time and increasing the cooling rate further improved performance. These enhancements are likely due to the formation of a well-developed layered structure with fewer defects.
However, the current discharge capacity is still lower that the theoretical capacity of lithium nickel oxide. The future work will include doping and/or coating for LiNiO2.


