

1. Introduction
2. Experimental Procedure
2.1. Materials
2.2. Concrete mixing ratio
2.3. Production methods
3. Results and Discussion
3.1. Compressive strength
3.2. Axial compressive strength
3.3. Freeze-thaw cycle experiment
4. Conclusion
1. Introduction
China has faced significant challenges in recent years regarding the management of construction waste and the sustainable use of resources. As urbanization accelerates, construction demolition waste now accounts for 30-40 % of urban solid waste.1,2,3) Additionally, China consumes approximately 40 % of the world’s cement and steel annually, leading to increasingly scarce natural resources.4,5,6) To address this situation, the government has restricted the extraction of natural resources and promoted recycled construction aggregates (RCA) as a key alternative material.7,8)
This study systematically explores performance optimization strategies for recycled concrete. By comparing recycled coarse aggregates of different particle sizes and replacement rates, the study focuses on testing key indicators such as compressive strength, chloride ion permeability, and freeze-thaw resistance,9,10,11) while also analyzing the influence of foundational performance parameters like aggregate density and water absorption rate.12,13) The findings reveal that the flowability of recycled concrete is generally lower than that of ordinary concrete, necessitating adjustments to the mix design to ensure construction performance; chloride ion permeability exhibits a trend of initially decreasing and then increasing; notably, when using coarse recycled aggregates with a particle size of 40 mm and a replacement rate of approximately 50 %, the compressive strength of the concrete reaches a peak, whereas conventional-sized aggregates exhibit a decreasing trend in strength as the replacement rate increases.
These findings provide important evidence for the resource utilization of construction waste. The study indicates that by reasonably selecting aggregate particle size and optimizing the replacement ratio, not only can the mechanical properties of recycled concrete be improved, but the reuse rate of construction waste can also be significantly enhanced. In practical applications, the mix design should be adjusted according to engineering requirements to ensure both strength and workability.14,15,16) From a broader perspective, this research provides a feasible technical pathway for promoting the green transformation of the construction industry and alleviating resource shortages, holding significant practical value for achieving sustainable development goals.
Given that recycled aggregates primarily originate from construction demolition waste, they are relatively inexpensive to obtain. Using recycled aggregate concrete with a 50 % replacement rate significantly reduces the cost of aggregate consumption in construction projects while also decreasing the volume of construction waste sent to landfills and conserving land resources. In the long term, as natural aggregate resources become increasingly scarce, the economic benefits of recycled aggregates will become even more evident.
2. Experimental Procedure
2.1. Materials
The raw cement was from Anhui Conch Cement Co., Ltd. and the standard type of ordinary silicate cement 425 was used, natural coarse aggregate (NCA) was used with two particle sizes, medium and small stones, fine aggregate was used with river sand medium sand, recycled aggregate was from Hefei Yu K’ung Utilization Co., Ltd. Polycarboxylate superplasticizer (PCE) water reducing agent was from Jiangsu Subot New Material Co., Ltd. Fresh water suitable for drinking was used as the water for mixing different concrete. The cement used in this experiment was P.O 42.5 ordinary silicate cement. The X-ray fluorescence spectrometry (XRF) measured chemical makeup is depicted in Table 1.
Table 1.
Chemical composition of cement (wt%).
| Oxide | Na2O | MgO | Al2O3 | SiO2 | P2O5 | SO3 | K2O | CaO | TiO2 |
| Percentage | 0.329 | 0.764 | 7.069 | 20.655 | 0.103 | 4.284 | 0.581 | 61.749 | 0.448 |
And the basic performance of the cement to do various tests as shown in Table 2, the batch of cement materials are in line with national standards.
Table 2.
The basic properties of cement mortar.
| Water/Binder ratio |
Normal consistency (%) |
Initial set (s) |
Final set (s) |
Water-retention rate (%) |
Performance density (g/cm3) |
Compressive strength of 28 d (MPa) | |
| PC | 0.4 | 28.3 | 139 | 276 | 97.54 | 2.05 | 31.8 |
2.2. Concrete mixing ratio
P designed C30 plain concrete with a water-cement ratio of 0.6. The concrete mix is shown in Table 3.
Table 3.
Quantity of each component of concrete.
According to the experiment, the natural aggregate and recycled aggregate used in the experiment were sieved, 5 kg of raw material was weighed in each group, and the particle grading curves of the two aggregates were made according to the sieving experiment, as shown in Fig. 1.
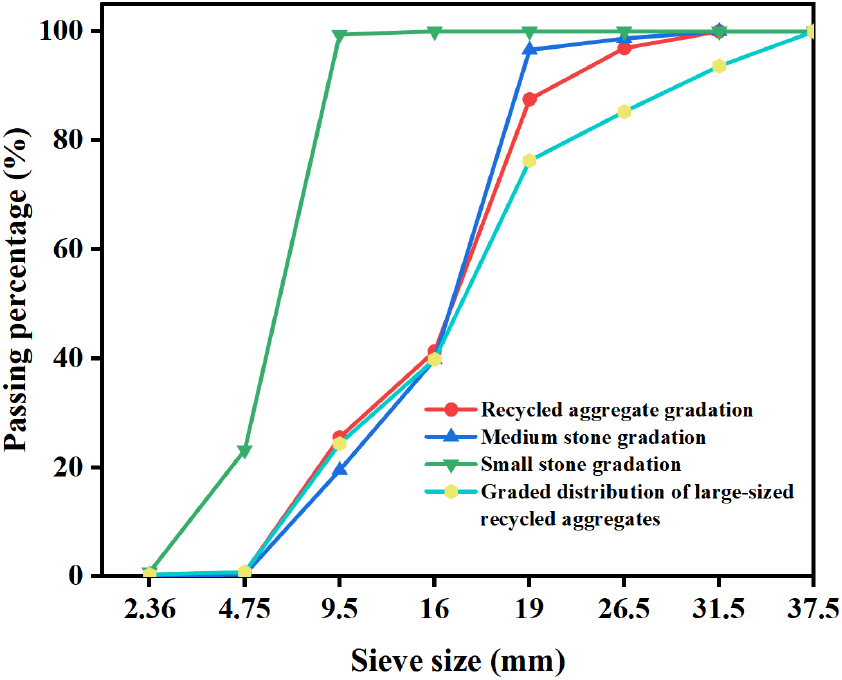
As can be seen from Fig. 1, the maximum particle size of recycled aggregate is larger than that of the medium stone of natural aggregate, and the gradation curve measured by sieving out the fragments with a particle size larger than 31.5 mm in the recycled aggregate is close to that of the natural aggregate. As can be seen from Fig. 2, the workability of freshly mixed concrete was measured in terms of slump. The texture and shape of RCA play a significant role in processing performance. The sharp, angular shape of RCA and its high water absorption rate reduce the workability of RCA concrete. To measure the workability of RCA concrete, a slump test was conducted. The slump values observed in the experiments showed a gradual decrease with increasing replacement rate, with a slower decrease before 50 % replacement rate and a faster decrease thereafter. At the same replacement rate, the slump of concrete using larger-sized recycled aggregates was slightly lower. Tables 4 and 5 exhibit the physical properties of aggregates. Table 6 shows the air content and unit mass of concrete test specimens.Due to the rough characteristics of recycled aggregates, the air content increases to a certain extent as the replacement rate increases. At the same time, because the density of recycled aggregates is lower than that of natural aggregates, the unit mass of concrete test blocks gradually decreases as the air content increases and the proportion of recycled aggregates increases.
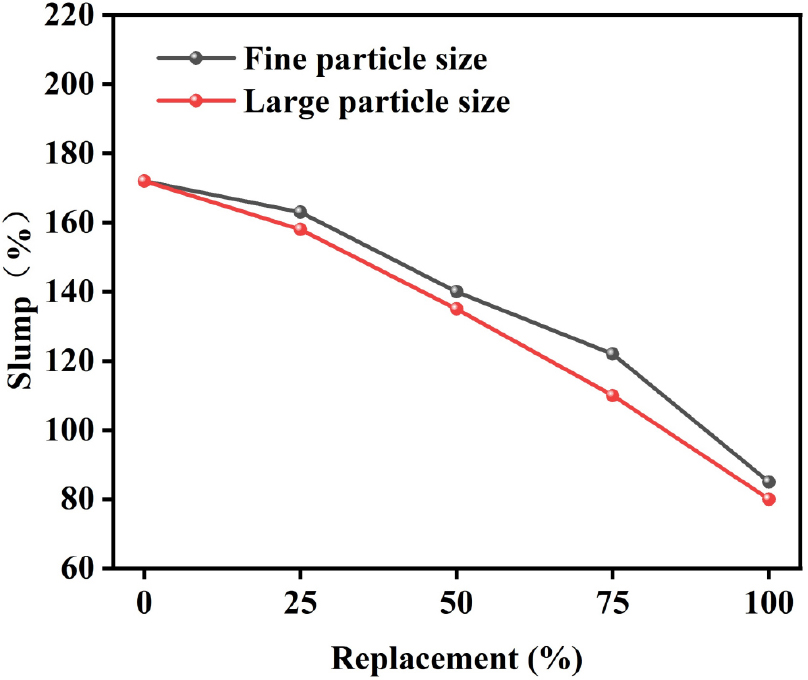
Table 4.
Apparent density and bulk density of two coarse aggregates.
| Apparent density (kg/m-3) | Packing density (kg/m-3) | |
| Crushed concrete | 2685.4 | 1346.5 |
| Natural coarse aggregate | 2917.9 | 1389.3 |
Table 5.
Comparison of two coarse aggregate crushing indexes and standards.
Table 6.
Gas content and unit mass.
2.3. Production methods
2.3.1. Preparation of concrete test blocks
The process for preparing the concrete samples was a two-step process. Initially, we blended the cement with the coarse and fine aggregates for a full minute before introducing water and keeping the mix moving for an additional three minutes. Next, the newly mixed concrete was carefully poured into the molds and then subjected to a 15 s vibration session on a vibrating table. After a 24 h wait, the molds were removed, and the samples were cured in a controlled environment at 20 degrees Celsius and 95 % relative humidity for a duration of 28 days.17)
2.3.2. Test methods and steps
For compressive strength testing, cubic specimens measuring 200 mm on each side were used, while axial compressive strength assessments employed smaller samples sized 100 × 100 × 300 mm. The evaluation of relative dynamic modulus of elasticity (RDME) loss required elongated prismatic specimens with dimensions of 100 × 100 × 400 mm. Importantly, each experimental condition was tested using three identical specimens to ensure reliable results.
2.3.3. Mechanical strength
The testing setup employed a Sansi-brand automatic press operating at a loading rate of 1000 newtons per second. For every mixture variation, three cube-shaped test samples measuring 200 millimeters on each side were fabricated. These specimens underwent an initial curing phase under controlled environmental conditions (20°C ± 2°C temperature and 90 % ± 5 % relative humidity) for one full day. Following this, they were transferred to a drying chamber maintained at 45 °C ± 5 °C, where they remained until reaching a stable, unchanging mass.
3. Results and Discussion
3.1. Compressive strength
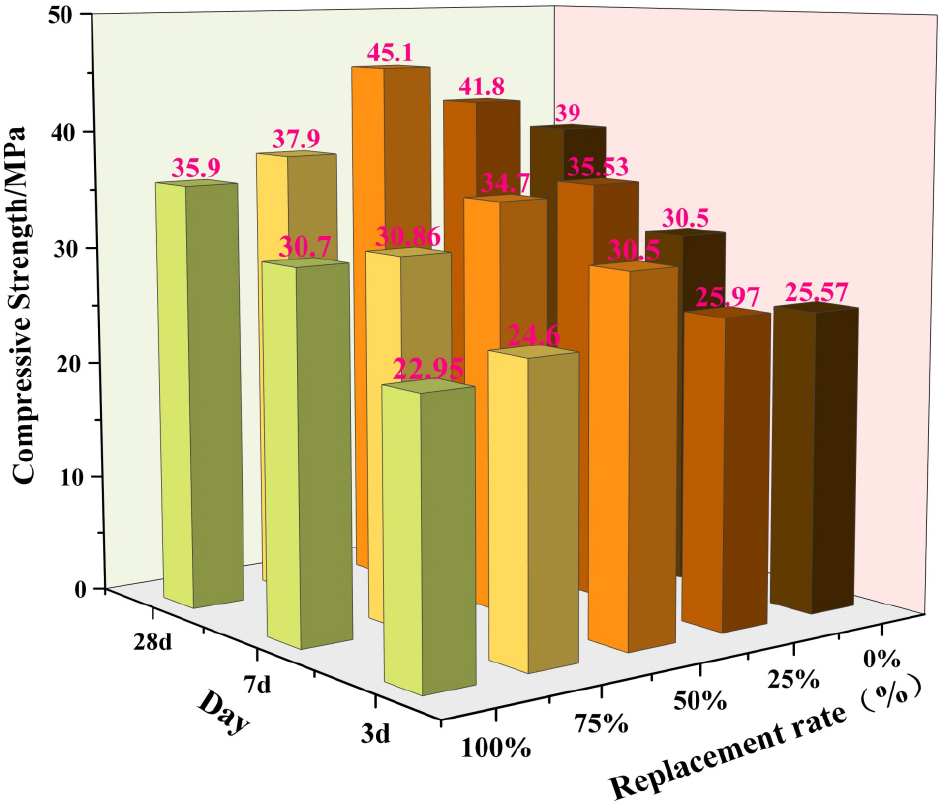
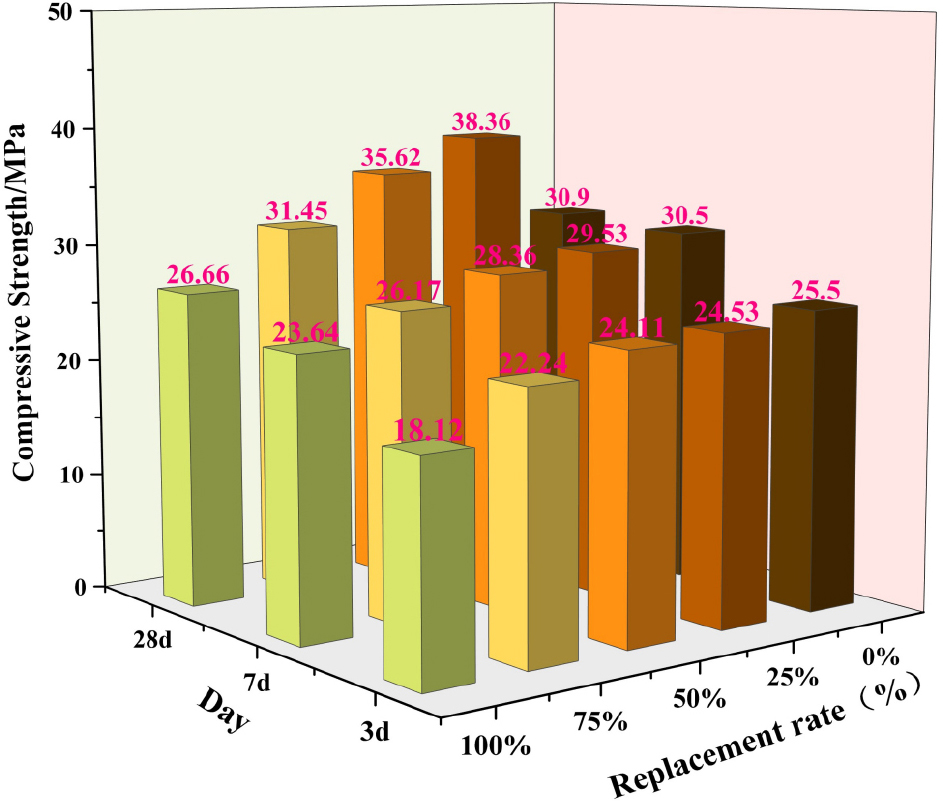
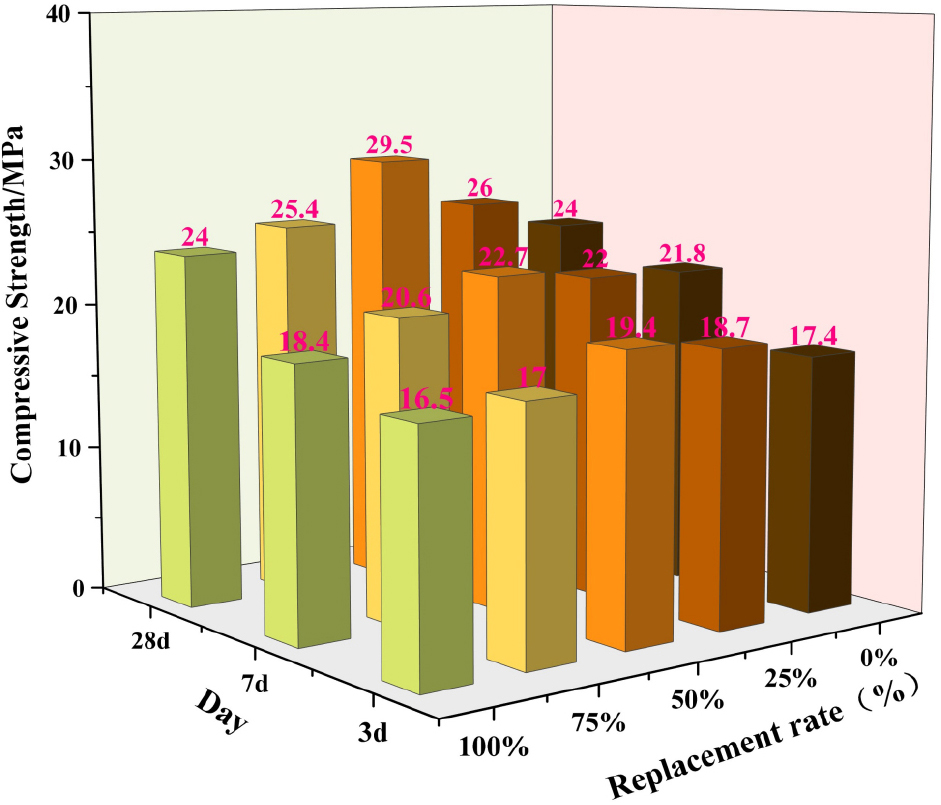
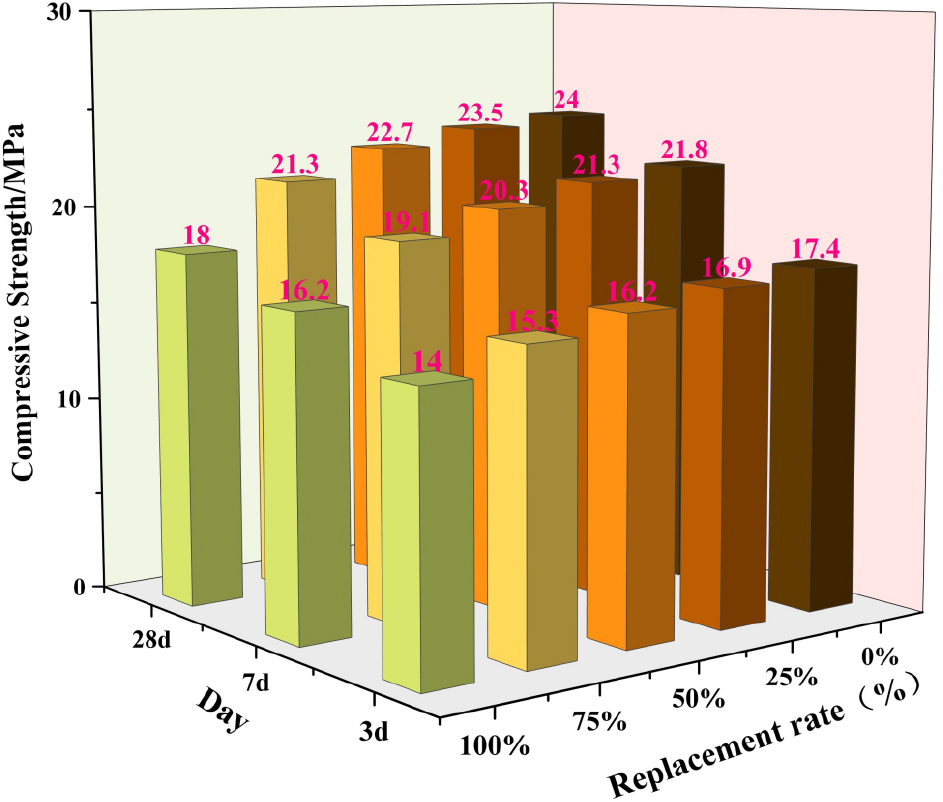
Fig. 3 displays material compression resistance concrete containing different proportions of large-size recycled concrete aggregates at 7 d, 14 d, and 28 d. With the increase of the replacement rate of crushed concrete, its standard 28 d cubic compressive strength and axial compressive strength are showing an increasing and then decreasing trend, for the replacement impact of recycIed aggregates on concrete’s compressive s trength is a complex result of a variety of conditions, first, the destruction of concrete specimens begins at the aggregate-mortar interface, and in these cases, as the largest particle size grows, the interfacial transition zone (ITZ) total surface area decreases in total surface area and therefore has the potential to improve the ITZ (at lower cement contents, e.g., 375 kg/m3),18,19,20) leading to higher compressive strengths for larger sized aggregates. Secondly the particle size of the crushed concrete recycled aggregate during the rising substitution rate is larger than the natural aggregate, and as the substitution rate grows, the crushed concrete recycled aggregate’s larger particle dimensions increase. provides a stronger skeleton for the concrete; thirdly, there is a hardened cement paste on the crushed concrete, which has a rougher surface, which is more conducive to a stable bonding with the cementitious material, i.e., the cement paste, and improves the internal modulus of elasticity; and fourthly, as the substitution rate rises and reaches a high level, as the crushing index of recycled aggregates of crushed concrete is lower than that of natural aggregate concrete, this change is the dominant factor which leads to the decreasing strength at higher substitution rates. Fig. 4 shows that the strength of concrete specimens made by replacing NCA with recycled coarse aggregate of the same size as NCA decreases with the increase of the replacement ratio, which is due to the large crushing value of the recycled aggregate itself that adversely affects the strength of the concrete.
3.2. Axial compressive strength
According to the analysis in Fig. 5, the axial compressive strength of the crushed concrete showed an obvious phenomenon of first increase and then decrease after the use of large-size recycled coarse aggregates. At the initial stage of strength increase, this is mainly attributed to the fact that coarse aggregate reduces the total surface area of the ITZ within the concrete, attenuating the effect of this unfavorable factor on the strength of the concrete, which results in a significant reduction of the void ratio within the concrete, thus significantly increasing the overall strength of the concrete. However, as the experiments progressed, the concrete was mixed with some aggregates with large crushing index, which caused serious damage to the concrete skeleton structure, which in turn led to a significant decrease in the axial compressive strength. Fig. 6 shows a gradual decrease in axial compressive strength of regular size recycled aggregate concrete with the same compressive strength.
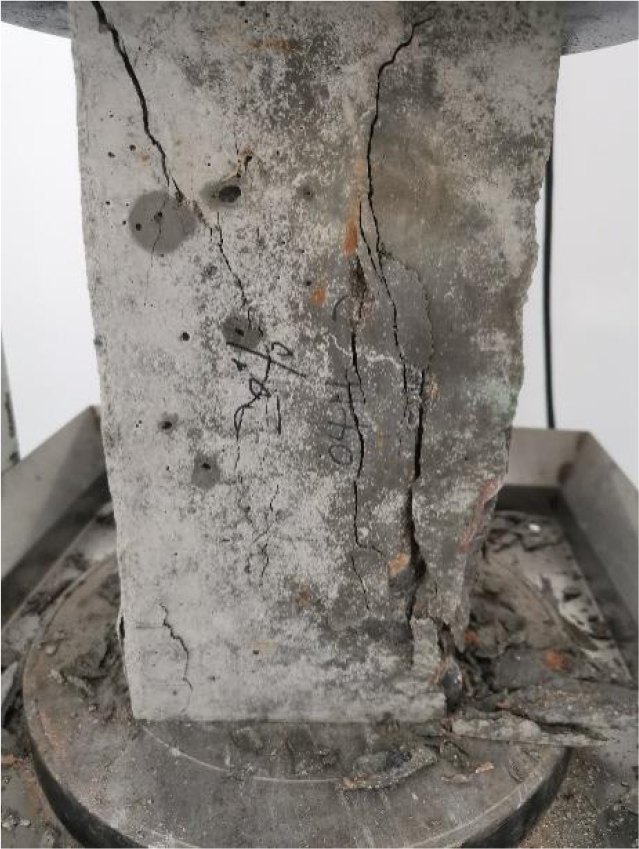
In further observations, it was noted that during the axial compressive strength testing, the specimens tended to crack first from all sides. As the load continued to increase, the number of cracks gradually increased and spread around the test block. When the specimen is close to the damage point, the sound produced when the concrete crumbles can even be heard clearly, and the cracks have been through the entire upper and lower surfaces of the specimen,21,22) as shown in Fig. 7, and this phenomenon fully verifies that the strength of the concrete at this point in the test. Significant changes in the process.
3.3. Freeze-thaw cycle experiment
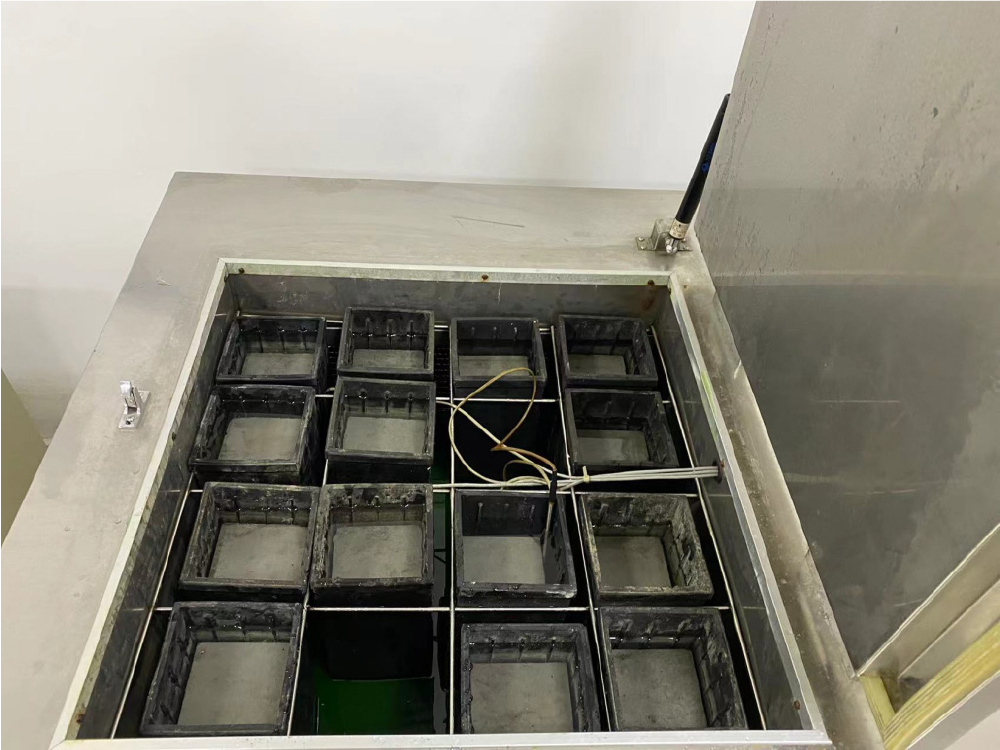
In the standard curing room or the same conditions of the specimen should be maintained in the maintenance age of 24 d when the test specimen of freeze-thaw test from the maintenance place in advance, and then should be placed in the frozen sleeve specimen 20 °C water soaking, soaking the water surface should be higher than the top surface of the specimen 20-30 mm.23,24) in the water soaking time should be 4 d. Sample should be in the age of 28 d to start when the test of freeze-thaw test. Always in the water to raise the pulling specimen, when the specimen maintenance age reaches 28 d, can directly carry out subsequent experiments. In this study, a freeze-thaw machine with 16 containers (Fig. 8) was used, of which 15 containers were used for placing freeze-thaw cycled concrete specimens. The final container was designated for control specimens, with a centrally embedded thermometer to ensure precise and consistent temperature regulation. This setup facilitated automated, repeatable freeze-thaw cycles at predetermined temperatures. The testing procedure adhered to the national standard GB/T 50082-2009, which outlines the following protocol.
After 25 freeze-thaw cycles, the specimen was removed and the surface of the specimen was wiped with a towel so that the specimen was in a saturated and dry state. The mass loss DWni after freeze-thaw cycles can be calculated by Eq. (1):
In the formula:
∙Awn - rate of mass loss (%) of the no. 1 concrete specimen after N freeze-thaw cycles, accurate to 0.01 %.
∙Woi - mass of concrete specimen before freeze-thaw cycle test (g).
∙Wni - mass of the first concrete specimen after N freeze-thaw cycles (g).
The dynamic modulus of elasticity of concrete can be calculated from Eq. (2):
Where: Ed-modulus of dynamic elasticity of coagulation (Mpa).
∙a - side length of the square cross-section specimen (mm).
∙L - length of the specimen (mt).
∙W - the mass of the specimen (kg), accurate to 0.01 kg.
∙f - the fundamental frequency of transverse vibration of the specimen (Hz).
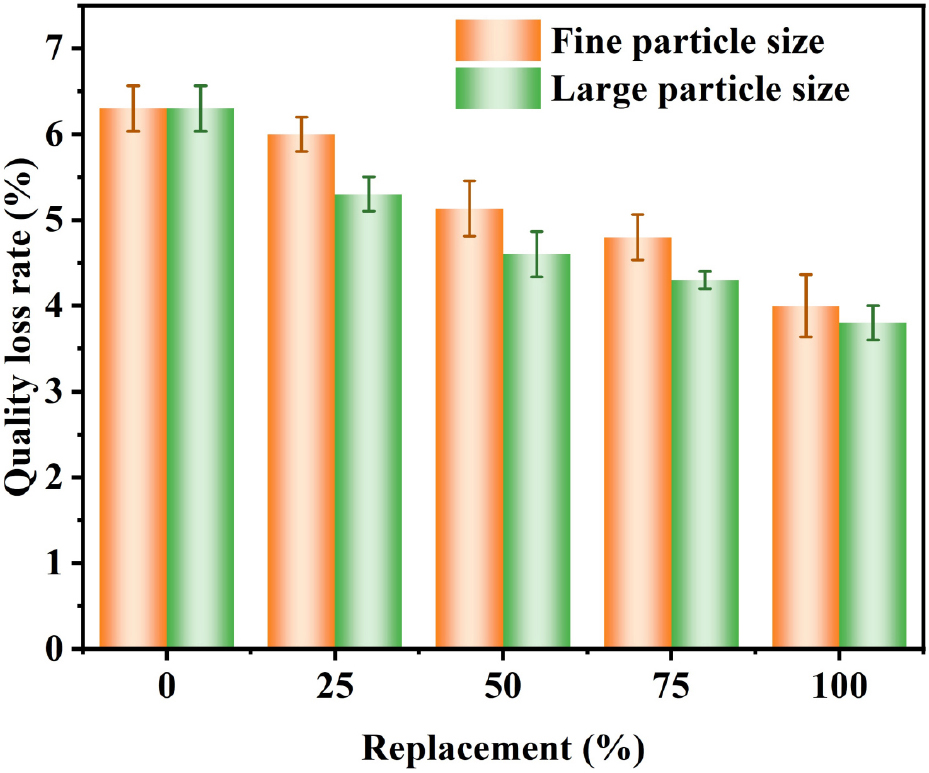
3.3.1. Loss of quality
The mass loss of concrete specimens made of large and small sized recycled aggregates after freeze-thaw cycles is given in Fig. 8. Observing the diagram, it is apparent that the concrete specimens without recycled aggregate have the highest mass loss, and all concrete mixes incorporating recycled aggregate exhibit higher freeze-thaw cycle resistance than the reference mix, regardless of the maximum particle size of the coarse aggregate and the recycled aggregate incorporation ratio. This shows that the inclusion of recycled aggregates is of some relevance. As previously reported, The durability of concrete under freeze-thaw conditions is significantly influenced by the inclusion of RCA. Concrete containing CCW exhibits enhanced resistance to freeze-thaw damage, likely due to its reduced scaling rate. Fig. 8 illustrates that as the proportion of CCW in the mix rises, so does the material’s ability to withstand repeated freezing and thawing. This trend suggests a clear correlation between CCW content and improved freeze-thaw performance. Notably, the mixture with complete replacement of NCA with CCW demonstrated the highest level of freeze-thaw resistance, irrespective of coarse aggregate particle size or the number of cycles, as evidenced by the data in Fig. 9. The control mixes with smaller particle sizes were less resistant to freeze-thaw cycling. The fact of the matter is that the particle size of the aggregate employed in concrete batching greatly impacts its freeze-thaw durability. Mixes featuring coarser aggregates tend to exhibit higher resistance, which might be attributed to the expanded overlap and the increased number of interface transition areas, which improves the penetration of the ITZ. The finer the coarse aggregates, the higher the total porosity of the concrete. The decrease in the effective water-cement ratio resulted in less water being absorbed by the specimen, which led to a higher resistance to free thawing cycles.
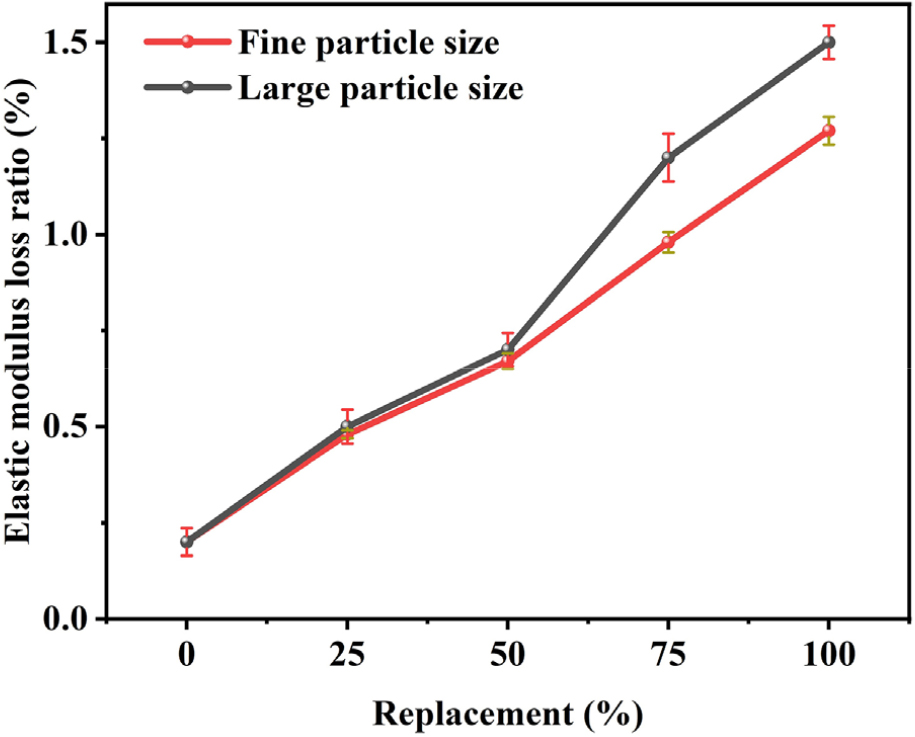
3.3.2. Relative dynamic modulus of elasticity
Fig. 10 gives the dynamic modulus of elasticity of concrete specimens made of large and small size recycled aggregates after freeze-thaw cycles. It can be seen that the dynamic modulus of elasticity of the specimens made of small size recycled aggregate decreases faster after freeze-thaw cycle.This is because there are many interconnected cracks within the recycled aggregate concrete.25,26) If the specimen is saturated, the cracks are filled with water. When the water in the cracks begins to freeze, the increase in volume that accompanies the freezing of the water requires an expansion equal to the volume of frozen water. The expansion stress at the tip of the crack is very high, resulting in much faster degradation of the concrete. The more the initial recycled aggregate replacement, the more cracks are initially present and the more likely the specimen is to form new cracks. The internal compactness of the specimen decreases and the relative dynamic elastic modulus decreases.
3.3.3. RCM chloride migration experiment
Following the completion of the experiment, the sample block was meticulously sliced, and a 0.1 mol/L solution of silver nitrate was meticulously applied to its exposed cross-section. Post a short resting period, as depicted in Fig. 11, a white precipitate formed at the base of the sample block. The sample block was then carefully sectioned into ten identical pieces, with the penetration depth of each segment being meticulously documented.
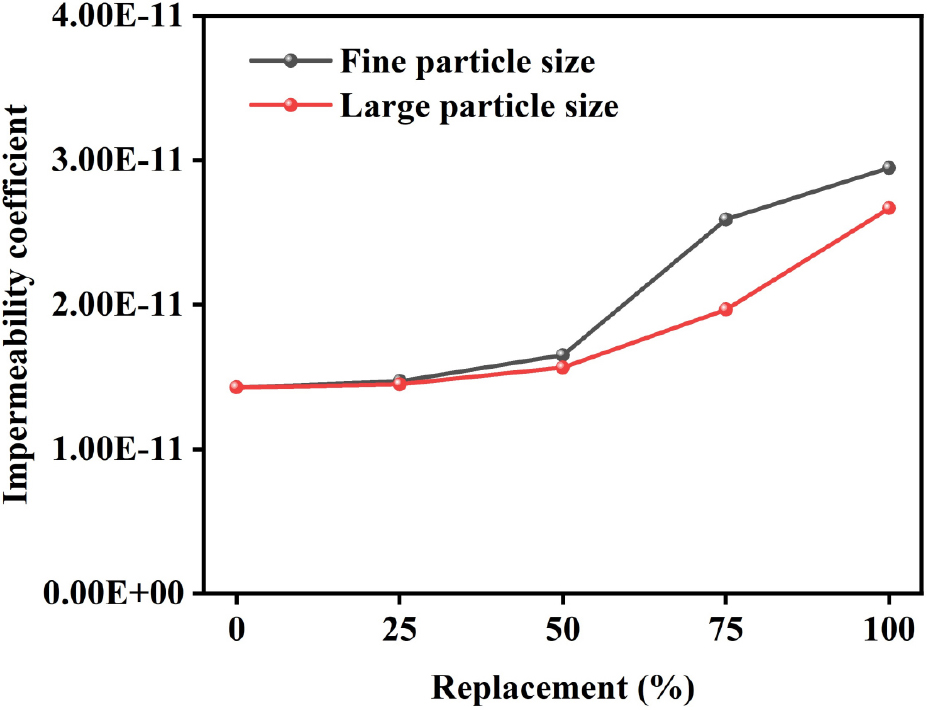
As can be seen in Fig. 12, the diffusion coefficient of chloride ions decreases gradually with the increase of the replacement rate of recycled aggregates, but with the increase of the replacement rate, the advantage of chloride ion resistance of concrete incorporating oversized recycled particles becomes more and more obvious. This is because, at the same replacement rate, concrete prepared with large-grain recycled aggregates has a lower total specific surface area of aggregate in contact with mortar than concrete prepared with small-grain recycled aggregates. Fewer ITZs reduce the penetration pathways for chloride ions, thereby enhancing the concrete’s resistance to chloride ions.
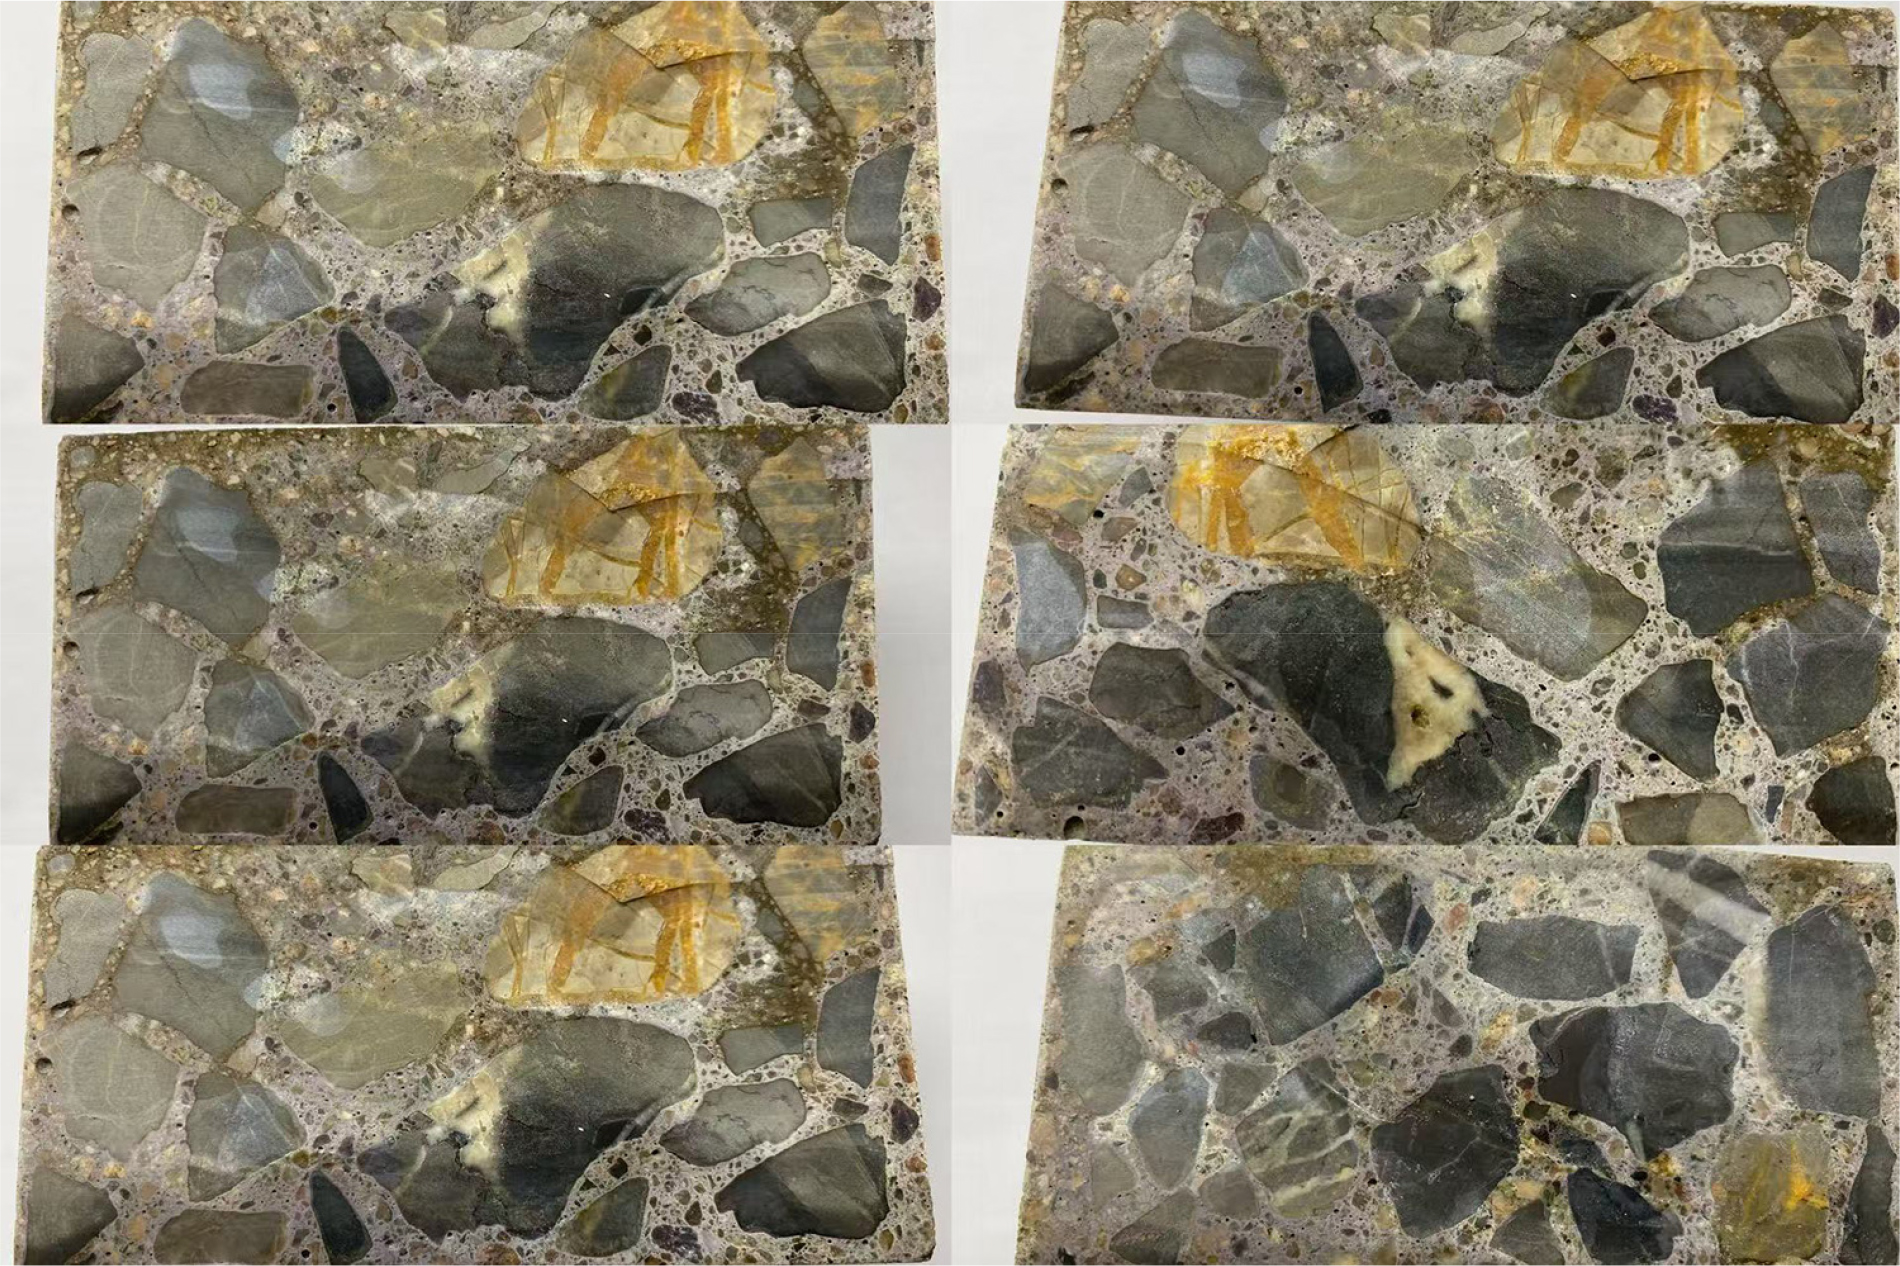
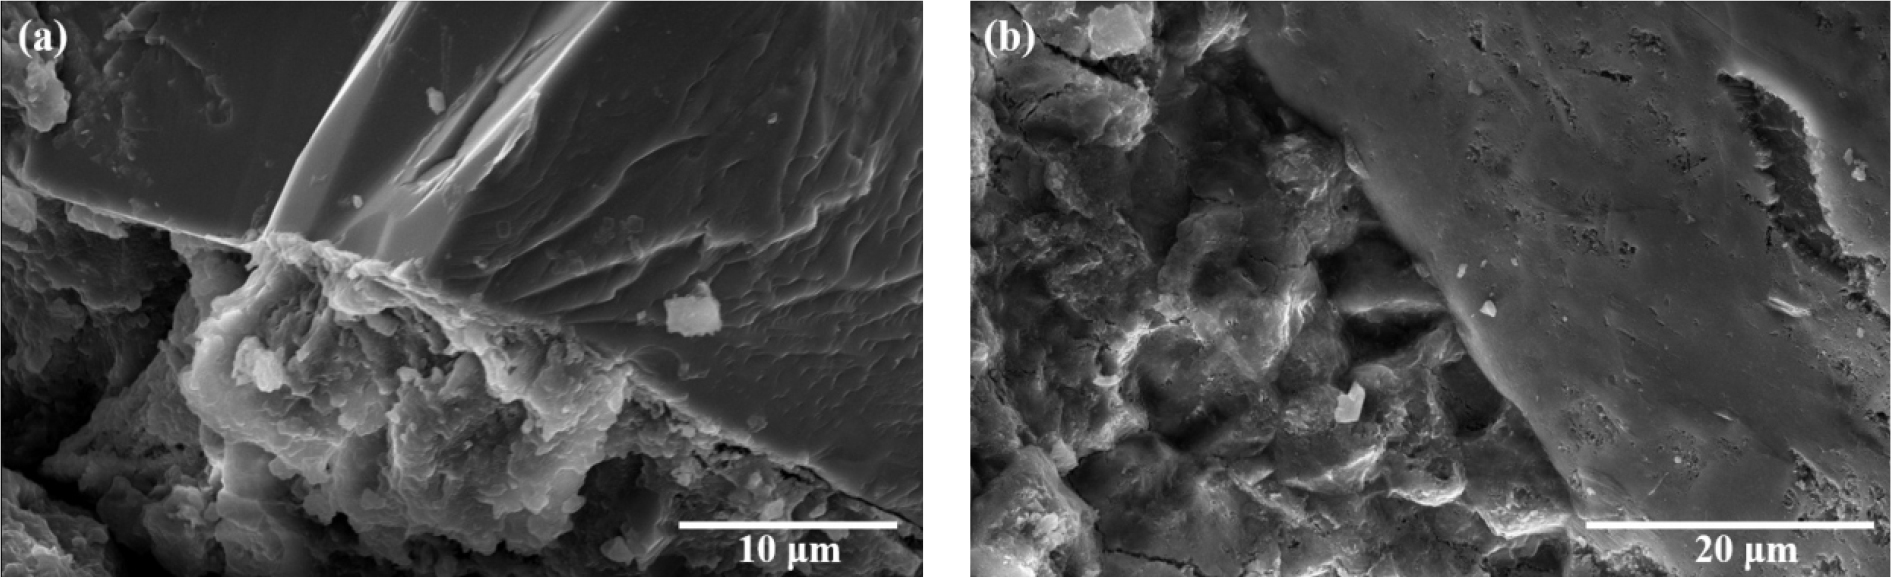
Studies have shown that the initial shear zone has a great influence on the mechanical properties and durability of concrete. Microcracks tend to develop in the initial crack zone when concrete is loaded. In the SEM images of RCA-containing concrete and RBA-containing concrete shown in Fig. 13(a) and Fig. 13(b), the interface between mortar and aggregate can be clearly seen. It can be observed from Fig. 13 that the RCA-containing concrete has some discontinuous voids near the transition zone, while the RBA-containing concrete has visible microcracks in the ITZ.In addition, it can be seen from Fig. 13(b) that there are some internal voids in the RCA. This could explain why concrete with RCA exhibits reduced compressive strength compared to concrete without RCA.
4. Conclusion
Based on the results obtained from this experimental study, the following conclusions can be drawn: The compressive strength of concrete incorporating recycled aggregates with sizes comparable to natural aggregates gradually decreases as the replacement ratio increases. However, for mass concrete using recycled aggregates, the compressive strength initially increases and then decreases with increasing replacement ratio, reaching a peak value of 45 MPa at a 50 % replacement level after 28 d. A similar trend is observed in axial compressive strength, with a maximum value of 29.5 MPa also at a 50 % replacement ratio after 28 d.
Concrete containing recycled aggregates exhibits superior freeze-thaw resistance compared to that made with natural aggregates. In particular, large-sized recycled aggregates demonstrate significantly enhanced freeze-thaw durability over small-sized aggregates, showing lower mass loss and a smaller reduction in dynamic elastic modulus.
Recycled aggregates with larger particle sizes also show improved resistance to chloride ion penetration, indicating better durability performance in chloride-rich environments.
