

1. Introduction
Piezoelectric ceramics are smart materials that can convert electrical energy to mechanical energy and vice versa. They are used in various electronic devices such as sensors, ultrasonic transducers, actuators, and energy harvesters. In addition, piezoelectric ceramics are being investigated to develop new functional devices.1-4) Current commercialized piezoelectric ceramic materials are based on Pb(Zr,Ti)O3. These materials contain a high amount of lead, which is a harmful element. Therefore, a piezoelectric ceramic composition that does not contain lead must be developed.5,6) Among various lead-free piezoelectric ceramic compositions, (K0.5Na0.5)NbO3 (KNN)-based ceramics exhibit high Curie temperatures and excellent piezoelectric properties. Hence, they are being studied as a representative lead-free candidate composition to replace Pb(Zr,Ti)O3-based materials.7-9) In particular, the control of the phase transition temperature to improve piezoelectric properties is being actively investigated, and numerous compositions containing alkaline earth (AE) metal ions have been reported. AE metal ions are mainly added to (K,Na)NbO3 ceramics in the form of AETiO3 or AEZrO3, which can satisfy stoichiometry and electrical neutrality. Various microstructures and piezoelectric and dielectric properties have been reported according to the type of AE metal.10-16) However, there are few studies on (K,Na)NbO3 ceramics doped only with AE metal ions mainly because they are not suitable for achieving an electrically neutral composition.
In this study, it is reported that when (K,Na)NbO3 ceramics are doped with AE metal ions, the volatilization of alkali ions is suppressed during high-temperature sintering. Thus, the grain growth behavior of doped (K,Na)NbO3 ceramics is different from that of pure (K,Na)NbO3 ceramics. The changes in the microstructures with the sintering duration (ts) are examined for ceramics doped with 2 mol% AE metal ions (Ba2+, Sr2+, and Ca2+) at the K+ site. The cause of microstructural changes is discussed on the basis of a two-dimensional (2D) nucleation and growth mechanism. There is a correlation between the size of doped divalent AE metal ions and volatility of monovalent alkali ions. Furthermore, the microstructure of sintered ceramics is determined by the magnitude of the critical driving force required for 2D nucleation, which depends on the vacancy concentration.
2. Experimental Procedure
KNN and (K0.48Na0.5X0.02)NbO3 (X: Ca, Sr, Ba) ceramic powders were prepared via solid-state synthesis using K2CO3 (99 %, Kojundo Korea Co.), Na2CO3 (99 %, Kojundo Korea Co.), Nb2O5 (99.9 %, Kojundo Korea Co.), CaCO3 (99.99 %, Kojundo Korea Co.), SrCO3 (99.9 %, Kojundo Korea Co.), and BaCO3 (99.95 %, Kojundo Korea Co.) raw material powders. The raw material powders were weighed according to the intended composition. They were mixed for 24 h by utilizing a conventional ball-milling process in a nylon container using yttria-stabilized zirconia balls (SciLab) and anhydrous ethanol (99.9 %, Samchun Pure Chemical Co.). The slurries were dried at 80 °C after the first milling and mixing process. Then, the dried powders were calcined at 800 °C for 3 h. The calcined powders were milled again for 72 h using the same ball-milling process. The dried powders were molded into disks with a diameter of 16 mm by applying a uniaxial pressure of 100 MPa and then sintered at 1,100 °C for 0~30 h. The structural analysis of each specimen was performed using an X-ray diffractometer (XRD, MiniFlex, Rigaku, Japan), scanning electron microscope (SEM, SNE-4500M, SEC, Korea), energy-dispersive X-ray spectrometer (EDS, XFlash 630, Bruker Nano GmbH, Germany), and particle size analyzer (Mastersizer 3000, Marvern, UK). The polarization versus electric field curves of each specimen were measured using a ferroelectric test system (PK-CPE1801, PolyK Technologies, USA). The resistivities of the specimens were measured using an electrometer (Keithley 6517B, Keithley Instruments, USA), and the dielectric properties were measured using an impedance analyzer (IM3570, Hioki, Japan).
3. Results and Discussion
Fig. 1(a) shows the XRD patterns of the KNN, (K0.48Na0.5Ba0.02)NbO3 (KNBN), (K0.48Na0.5Sr0.02)NbO3 (KNSN), and (K0.48Na0.5Ca0.02)NbO3 (KNCN) powders calcined at 800 °C for 3 h. For all the compositions, a pure ABO3 perovskite phase was synthesized without a secondary phase. Moreover, as shown by the magnified view of the (200)C diffraction peak in Fig. 1(b), the diffraction peak shifted to higher angles in the order of KNBN < KNSN < KNCN. On the basis of the A-site ionic radii with 12 coordination (K+: 1.64 Å, Ba2+: 1.61 Å, Sr2+: 1.44 Å, Ca2+: 1.34 Å), lattice contraction increased as the size of the doped AE metal ion decreased. The absence of the secondary phase and presence of lattice contraction (Fig. 1) implied that 2 mol% of AE metal ions were well doped into the KNN lattice.
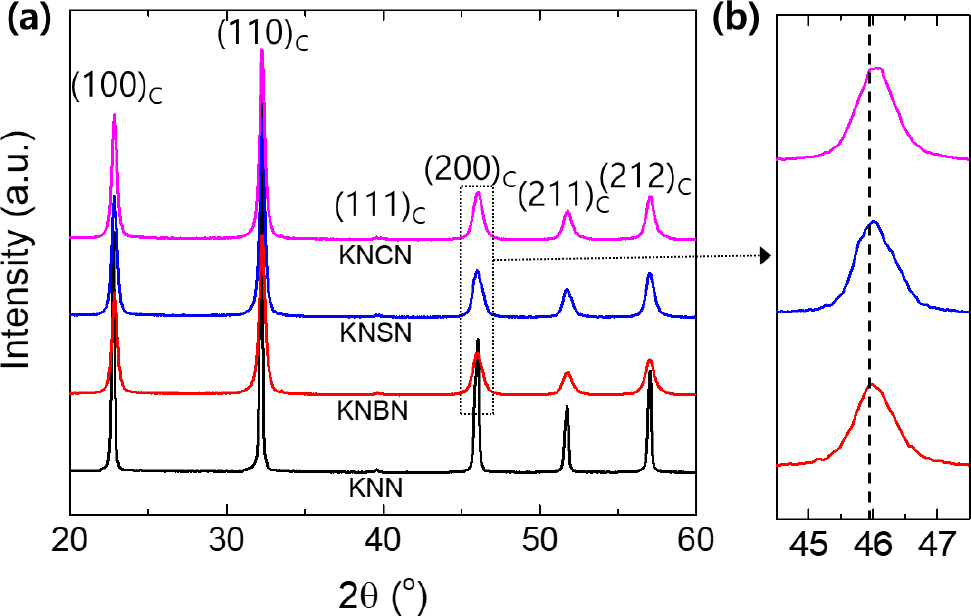
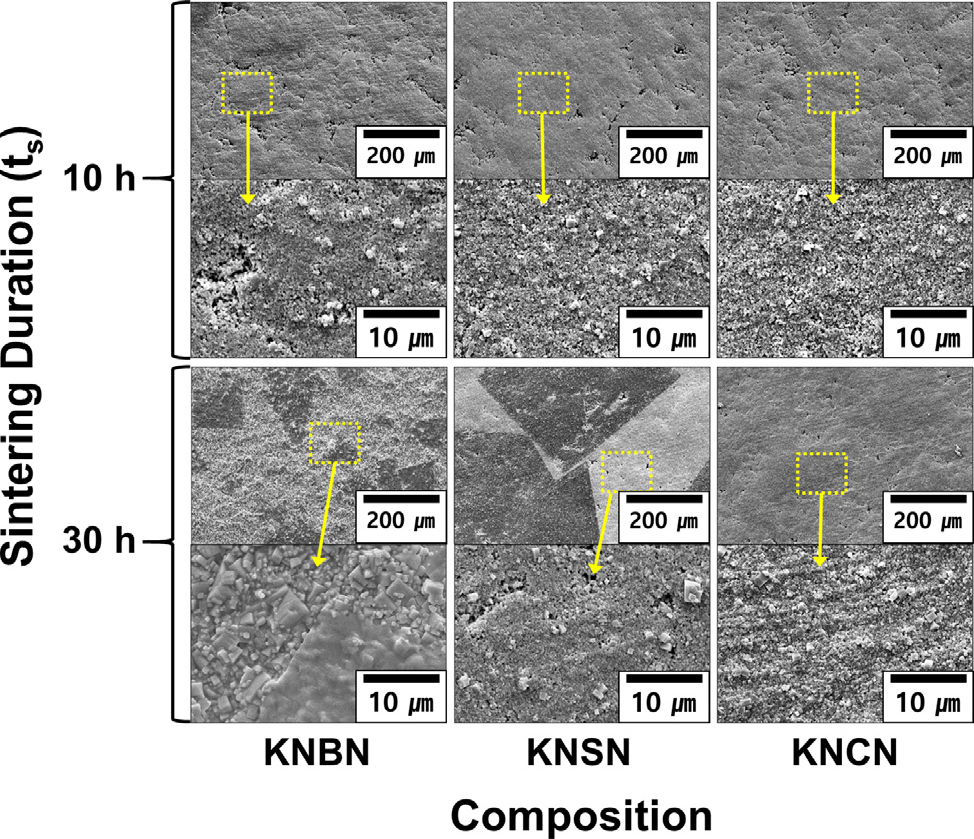
Fig. 2 shows the microstructure according to the sintering duration of the KNN, KNBN, KNSN, and KNCN ceramics sintered at 1,100 °C. For the KNN specimen, grains grew to a size of several micrometers during the initial stage of sintering (ts = 0 h). Thereafter, the grain size increased with ts. However, grain growth was not observed in the KNBN, KNSN, or KNCN specimens even at ts = 10 h. At ts = 30 h, as shown in Fig. 3, abnormal grains were observed in the KNBN and KNSN specimens but grain growth was still suppressed in the KNCN specimen. The KNBN specimen sintered for 30 h exhibited a microstructure containing abnormal grains with a size of several tens of micrometers and matrix grains with a size of several micrometers. In contrast, the KNSN specimen sintered for 30 h contained abnormal grains with a size of several hundred micrometers and growth-suppressed matrix grains with a size of several hundred nanometers. Additionally, the number of abnormal grains was significantly lower than that in the KNBN specimen.
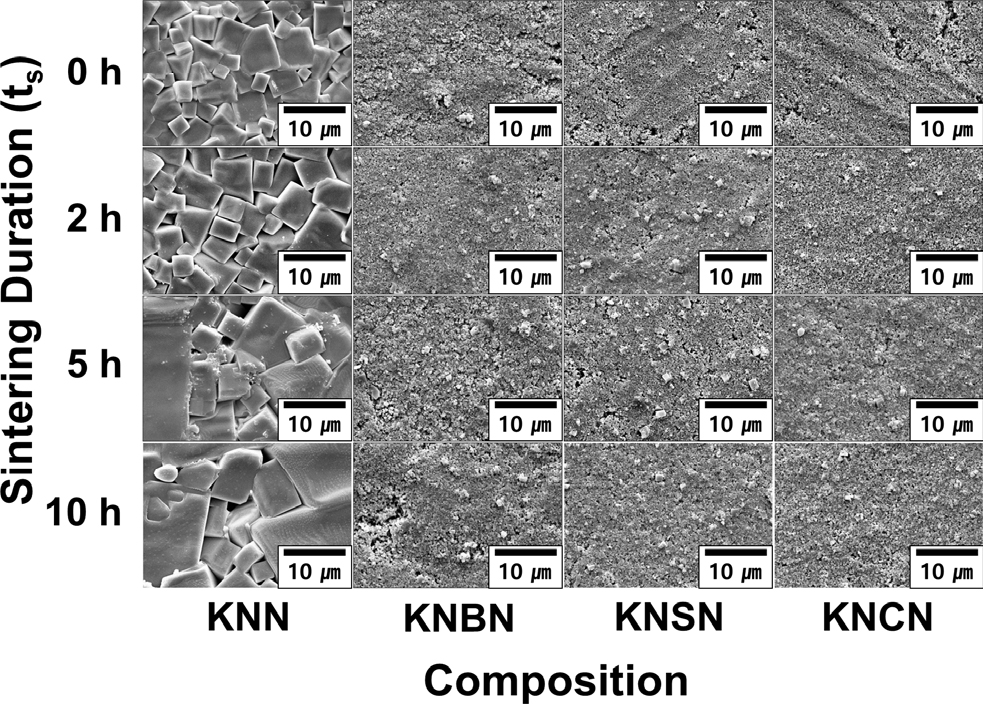
As shown in Figs. 2 and 3, the grains of the KNN-based ceramics had a faceted cubic shape, indicating their high anisotropy of interfacial energy.17,18) In KNN-based ceramics, the formation of a liquid phase owing to the volatilization of an alkali element at a temperature of 1,000 °C or higher and the resulting liquid phase sintering have been frequently reported.19-24) In the theory of liquid phase sintering, grain growth in materials with faceted grains can be explained by a 2D nucleation and growth mechanism.17,18) Atoms are diffused and adsorbed at the edge (or step site) of the 2D nucleus formed on the {100} crystal plane, and grains with facile 2D nucleation can grow by absorbing and consuming neighboring grains. However, grain growth via a general diffusion mechanism without 2D nucleation is limited in materials with high anisotropy of interfacial energy. The critical driving force (ΔGC) for 2D nucleation is expressed as follows:
In Eq. (1), σ is the step free energy of the 2D nucleus, k is the Boltzmann constant, T is the temperature, h is the height of the 2D nucleus, and K is a constant consisting of the diffusion coefficient and the number of nuclei per unit area. In addition, the driving force (ΔG) for the grain growth of each particle is expressed as follows:
In Eq. (2), γsl is the solid-liquid interfacial energy, ra is the average radius of surrounding particles, and r is the radius of the particle that will grow. Grain growth via 2D nucleation is explained by a mixed control growth mechanism composed of an interface reaction control mechanism and diffusion control mechanism [Fig. 4(a)]. Only the particles that satisfy ΔG > ΔGC can grow through atomic diffusion and adsorption after 2D nucleation.17)
σ in Eq. (1) is inversely proportional to the configurational entropy, which increases with the vacancy concentration.25) Thus, an increase in the vacancy concentration can lead to a decrease in ΔGC. Fig. 4(b) shows the ratio of the alkali ion content in the sintered specimen to that in the calcined powder (RAS/C) for all compositions, as analyzed via EDS element mapping. The KNN specimen exhibited RAS/C = 98.4 % even at ts = 0 h, implying that the volatilization of alkali ions had already progressed in the initial stage of sintering. In contrast, the KNBN, KNSN, and KNCN specimens exhibited RAS/C ~ 99.8 % at ts = 0 h, which implied that alkali ion volatilization was insignificant in these specimens at the initial stage of sintering. The decrease in RAS/C with the increase in ts was severe in the order of KNN > KNBN > KNSN > KNCN. In addition, as shown in the XRD patterns of the sintered specimens in Fig. 5, the (200)C peak shifted to a higher angle as ts increased for all specimens. This was attributed to the lattice contraction caused by the increase in the vacancy concentration (i.e., decrease in RAS/C). The shift of the (200)C peak was large in the order KNN > KNBN > KNSN > KNCN, which was consistent with the order of the decrease in RAS/C. The results in Figs. 4 and 5 demonstrate that the alkali ion volatilization of KNN ceramics was suppressed by doping them with AE metal ions, and the suppression of alkali ion volatilization enhanced as the AE metal ion size decreased. Therefore, the vacancy concentration of the specimens for the same ts is believed to be high in the order of KNN > KNBN > KNSN > KNCN, and consequently the order of ΔGC magnitudes of the specimens is opposite.
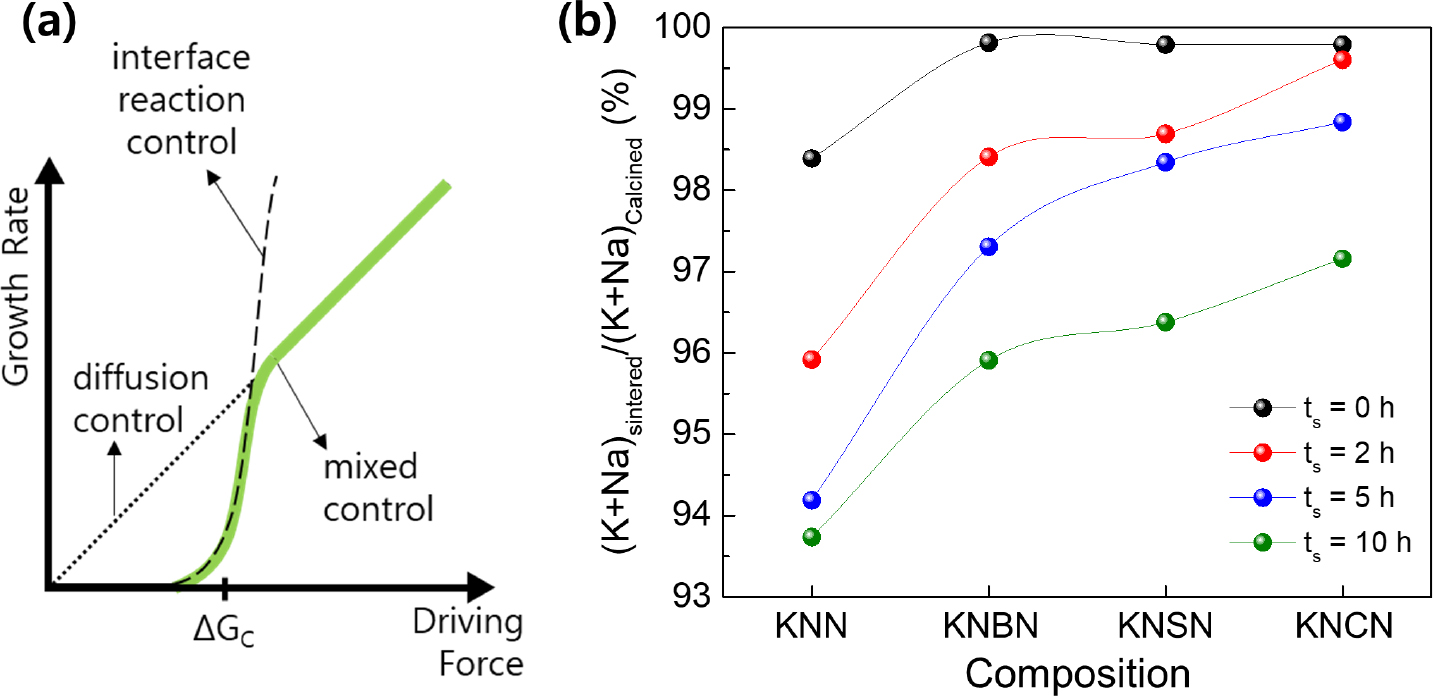
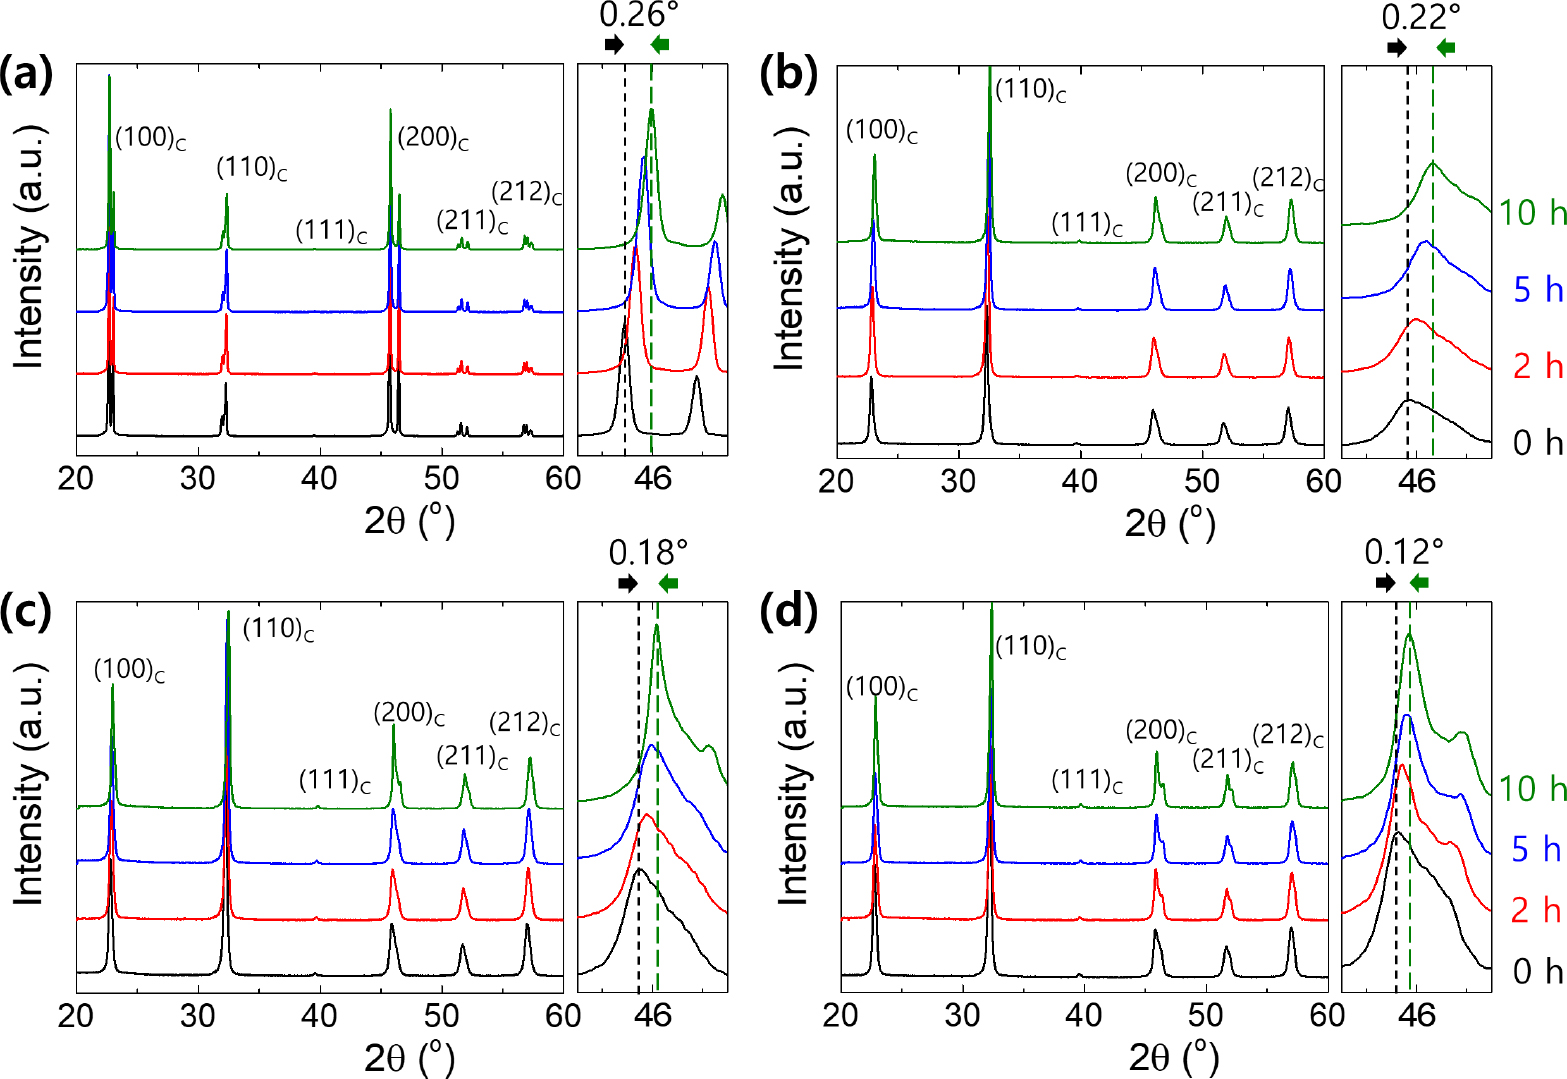
Fig. 6 shows a schematic of the grain growth rate as a function of ΔG for the KNN, KNBN, KNSN, and KNCN specimens. This is based on the 2D nucleation and growth mechanism described above and the results shown in Figs. 4 and 5. ΔGmax indicates the largest value among the values of ΔG for constituent particles. Grain growth was inhibited when ΔGC > ΔGmax, and the particles that satisfied ΔGC < ΔG < ΔGmax could grow at the corresponding growth rate. The growth rate curves shown in Fig. 6 were used to analyze the grain growth behavior of the specimens shown in Figs. 2 and 3. For the KNN specimen, grain growth was possible even when ts = 0 h because the ΔGC < ΔGmax condition was satisfied owing to the high vacancy concentration (Fig. 2). Moreover, as ts increased, ΔGC decreased because of the increase in the vacancy concentration, thereby promoting the growth of all grains. However, for the KNBN, KNSN, and KNCN specimens, grain growth was suppressed even when ts = 10 h because ΔGC > ΔGmax was still satisfied. The KNBN specimen, which had the highest alkali ion volatility (highest vacancy concentration) among the doped specimens, first satisfied the ΔGC < ΔGmax condition when ts = 30 h (Fig. 6). Therefore, as shown in section [1] (satisfying ΔGC < ΔG < ΔGmax) in Fig. 6, there were various grain growth rates. As a result, a microstructure composed of grains of various sizes could be obtained in the KNBN specimen sintered for 30 h (Fig. 3). For the KNSN specimen, the grain growth rate under ΔGC < ΔG < ΔGmax (section [2] in Fig. 6) was quite limited compared to that for the KNBN specimen, and the value of ΔGmax - ΔGC was extremely small. Consequently, a microstructure consisting of a small number of abnormally large grains and matrix grains with suppressed growth was induced in the KNSN specimen sintered for 30 h. No grain growth occurred in the KNCN specimen even at ts = 30 h because ΔGC > ΔGmax was still satisfied owing to the lowest alkali ion volatility (lowest vacancy concentration).
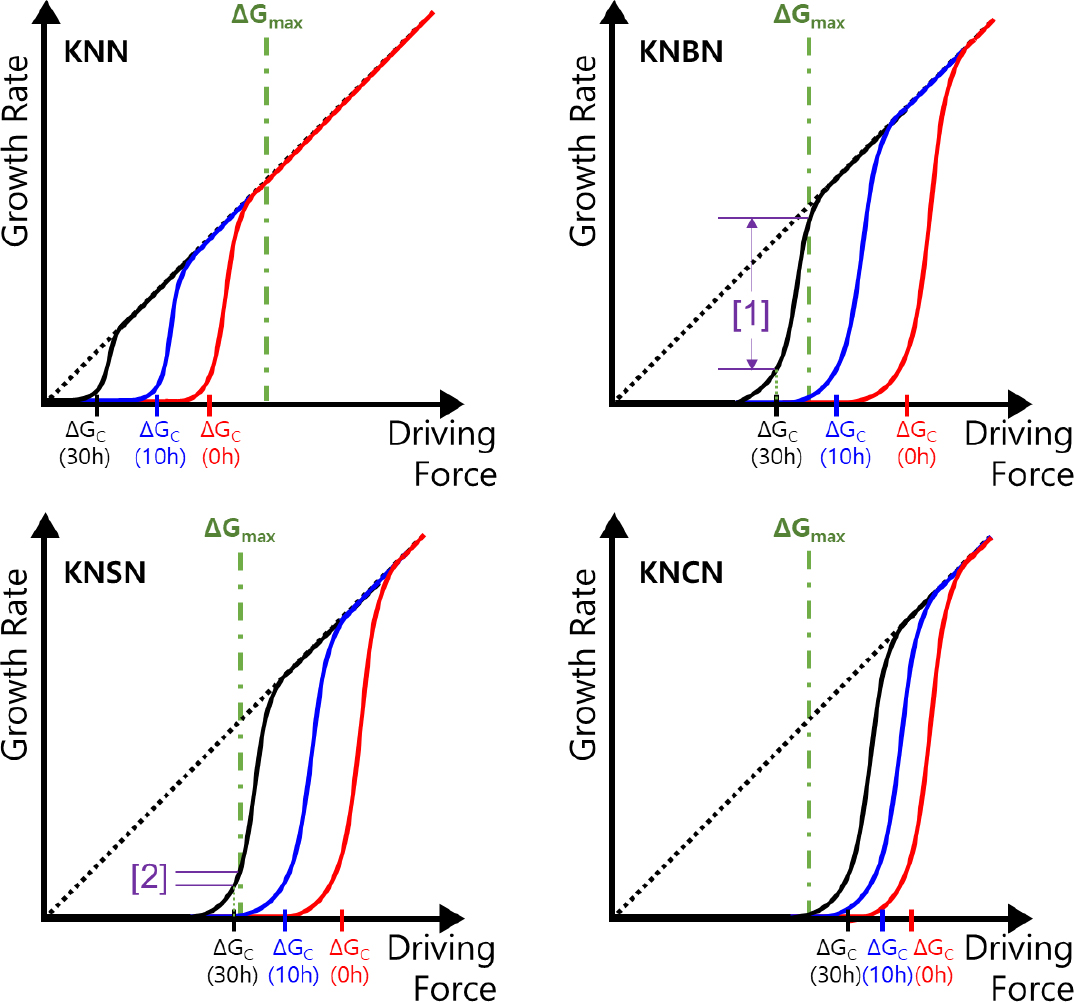
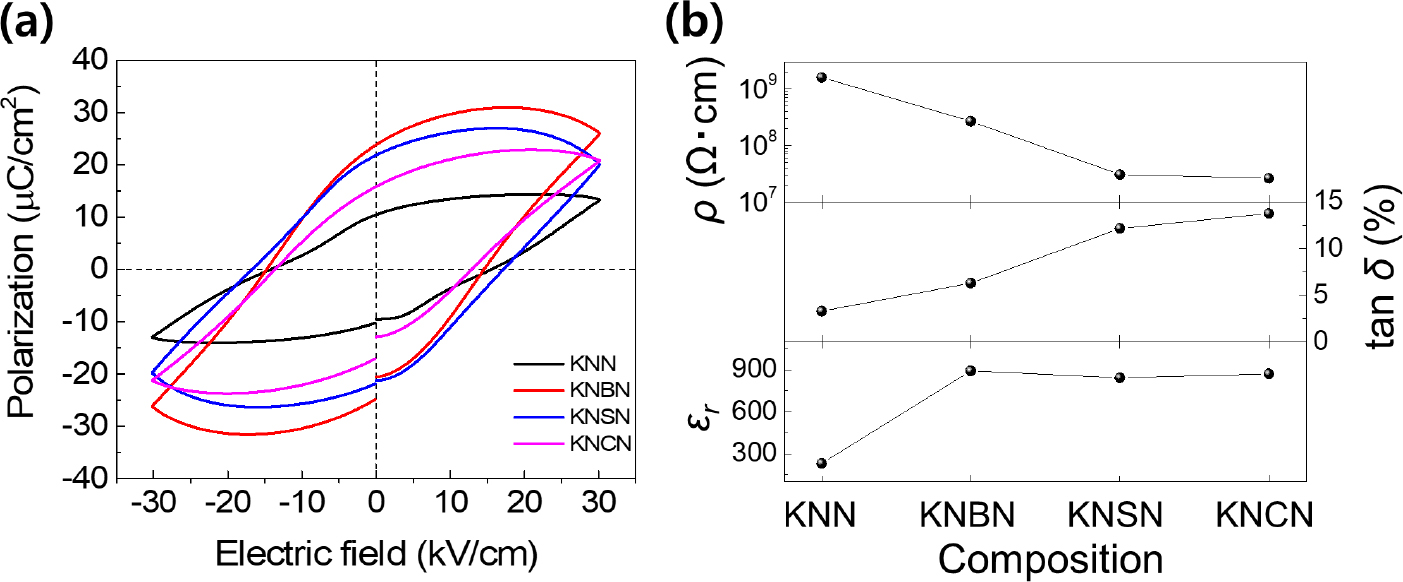
Fig. 7 shows the electrical properties of the specimens sintered at 1,100 °C for 30 h. All the specimens exhibited high-loss polarization hysteresis curves [Fig. 7(a)], indicating that a number of defects existed inside the specimens. Alkali ion vacancies, oxygen ion vacancies, electrons generated by AE metal ion doping, and holes generated by excessive alkali element volatilization are the possible defects in these systems. The dielectric constants of the specimens doped with AE metal ions were significantly higher than that of the KNN specimen [Fig. 7(b)]. This might have been because of the increase in the dipole moment caused by the doping of divalent donor ions and the presence of vacancy defects. In addition, the order of magnitude of electrical resistivity was KNN > KNBN > KNSN > KNCN, and the dielectric loss showed the opposite trend. This was probably closely related to the tendency of alkali ion volatility. However, a defect analysis study that considers the conduction mechanism and charge carrier type of the specimens is required for identifying the exact cause.
4. Conclusion
The grain growth behavior of KNN ceramics doped with AE metal ions (Ba2+, Sr2+, and Ca2+) was investigated on the basis of the 2D nucleation theory. The suppression of alkali ion volatilization in the KNN ceramics increased as the size of the doped AE metal ions decreased. The pure KNN specimen, which had the most active alkali ion volatilization, exhibited the most facile grain growth because numerous particles already had the required driving force for 2D nucleation at the initial stage of sintering. However, in the samples doped with AE metal ions, the sintering time required for reaching the driving force necessary for 2D nucleation increased as the volatility of the alkali ions decreased. This led to the formation of abnormal grains and a microstructure with nonuniform grain sizes. The volatilization of alkali ions was the most suppressed in the Ca2+-doped specimen. This specimen did not exhibit grain growth even after sintering for 30 h. The sintered specimens exhibited high-loss electrical characteristics, suggesting that various electrical defects existed inside the specimens. The results of this study demonstrate a direct correlation between the microstructure and vacancy concentration of KNN ceramics. Furthermore, they can be useful for microstructure control in KNN-based polycrystalline materials and single-crystal growth studies.
