

1. Introduction
Ferrite cores are one of the most important soft magnetic materials widely used in the electronics industry such as transformers, noise filters, and magnetic recording system due to their high magnetic permeability, high saturation magnetization and low coercivity.1) Mn-Zn ferrite cores in particular have gained major attention with the development of wireless power transfer technology in cell phones, laptops, electric vehicles, and even distribution transfer systems of the display industry.2) In order to make wireless power transfer devices more efficient, it is necessary to reduce the size of Mn-Zn ferrite cores while maintaining high performance. There have been numerous studies on ways to produce Mn-Zn ferrites with high electromagnetic performance, and one of them is to utilize nano-sized powders for improvement of microstructure and sintering properties. In general, nano-sized powders can be produced by high-energy ball milling, deposition method, sol-gel method and hydrothermal synthesis method, etc. Among these techniques, high energy ball milling is an effective method that allows to obtain amorphous phase or nano-crystalline structure in inorganic materials synthesis.3-5) In this study, therefore, we subjected Mn-Zn ferrite powders to high energy ball milling, and then investigated the microstructure and various properties of the compacted and sintered Mn-Zn ferrite powders depending on varying temperature & pressure.
2. Experimental
The initial ferrite powders composed of Fe2O3, Mn2O3 and MnZnFe2O4 oxides were subjected to high energy ball milling under conditions of 20:1 in ball to powder weight ratio and the milling rate of 300 rpm for 1 ~ 7 h under argon atmosphere. The powders milled at 300rpm for 3 h were uniaxially compacted under a pressure of 190 ~ 590 MPa for 3mins. Subsequently, after compacting at 490 MPa, the obtained green body was conventionally sintered at 1,273 ~ 1,673 K for 3 h under argon atmosphere. The microstructural characteristics of the powders, the compacted and sintered samples were observed by an optical microscope (OM) and a scanning electron microscope (SEM) and a transmission electron microscope (TEM). The size and shape of powders were investigated by image analysis. In particular, the shape was evaluated with a shape factor (= 4πA/P2, where A is area and P is perimeter of powder). X-ray diffractometer (XRD) was used to identify the phases. The relative density of the compacted and sintered samples was obtained by Archimedes method. Micro-hardness was measured by a Vickers micro-hardness tester under a load of 1000g for 15secs.
3. Results and Discussion
The typical SEM photographs of initial and as milled ferrite powders are shown in Fig. 1. The initial ferrite powders, which are irregular in shape, become evidently smaller after milling. However, there is no marked change in shape with increasing milling time. The mean size, shape factor and size distribution of powders obtained from Fig. 1 are quantitatively plotted in Fig. 2. The mean size of approximately 650 nm in the initial powders decreases with increasing milling time up to 3 h, resulting in the smallest size of approximately 230 nm. However, it becomes larger again after milling for more than 3 h, which is attributed to the occurrence of serious aggregation in powders. On the other hand, the shape factor of initial powders is approximately 0.7, which is almost unchanged even after milling. The size distribution of initial powders is between 200 and 2,000 nm, which greatly changes to 60 ~ 700 nm after milling for 3 h and again to 100 ~ 1,000 nm with more milling time of 7 h. The highest number peaks of powders well correspond to the mean size of powders.
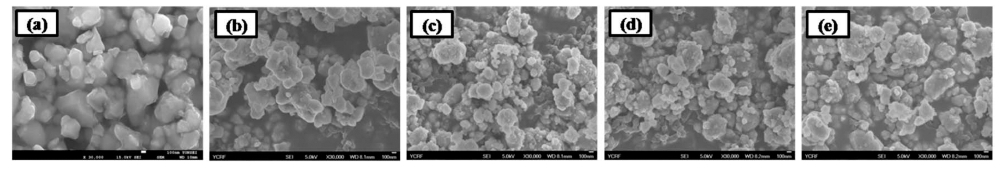
Fig. 1
SEM images showing ferrite powders; (a) initial state and after milling at 300 rpm for (b) 1 h, (c) 3 h, (d) 5 h, (e) 7 h.
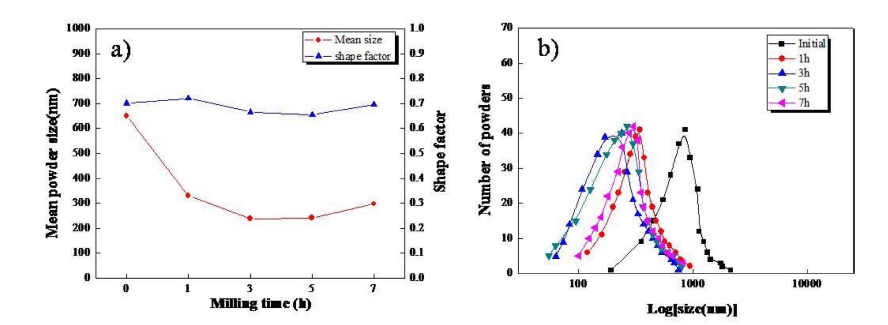
Fig. 2
(a) Mean powder size, shape factor and (b) size distribution of ferrite powders with increasing the milling time.
Fig. 3 shows TEM photographs of powders milled for 3 h. It is apparent that the milled powders are aggregated with nano-sized particles with a size of approximately 15 nm, which well corresponds to the size calculated by Debye-Scherrer’s equation using the half-value width of XRD peaks.6) On the other hand, it is previously reported that the initial and as milled powders are composed of Fe2O3, Mn2O3 and MnZnFe2O4 phases.7)
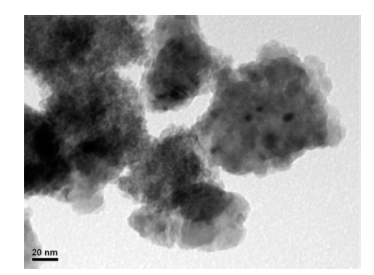
Fig. 4 represents the appearance, SEM image, and green density of samples compacted at different pressures. No deformations in the milled powders are observed after compaction. The samples compacted at each pressure also did not show any major difference in their appearances or cracks. In general, however, the densification occurs by rearrangement through sliding of powders in applying pressure. This is in accordance with the findings in Fig. 4(c), as it exhibits a trend of density increasing with pressure. The sample compacted at 490 MPa has the highest density of ~ 71 %; however, the density goes down to ~ 68 % as pressure increases to 590 MPa. This decrease is considered to be from the formation of microcracks inside the sample due to excessive pressure.
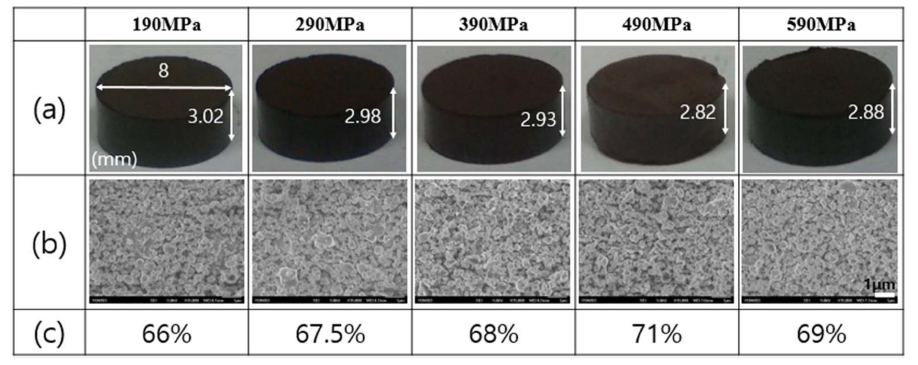
Fig. 4
Appearance (a) and SEM (b) images and green density (c) of compacted samples with increasing pressure.
Fig. 5 represents the micro-hardness of compacted samples at each compaction pressure. The top region of the sample has higher hardness compared to the bottom region. This is because during the compaction process, the upper punch applies pressure to the powder towards the center of the mold. The pressure is greater for the powders located closer to the upper punch, and thus a denser rearrangement is possible. This variance in pressure depending on distance happens because the powders distribute the load to the mold wall in the form of friction.8) The hardness of the top region increases along with pressure, with the maximum value being ~50 Hv at 590 MPa; the hardness of the bottom region does not demonstrate a significant change with increasing pressure.
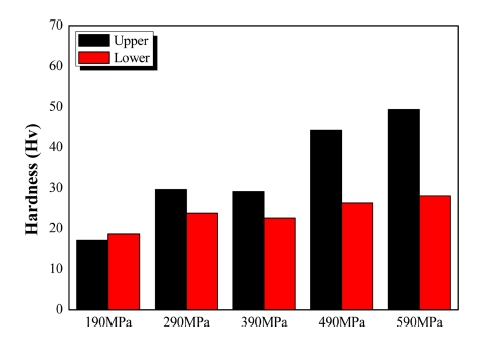
Fig. 6 represents the OM images of sintered samples at each temperature. It is evident that the densification and increase in grain size occur as sintering temperature gets higher. The sample sintered at 1,273 K shows an extremely porous microstructure, while at 1,373 K, it can be seen that the uniform microstructure is formed and the grains are much smaller. From there, the grain size increases rapidly until 1,573 K, which coarsens the grain and traps more pores inside. With higher temperature, it can be concluded that the grains grow in size and the pores shrink on the other hand.
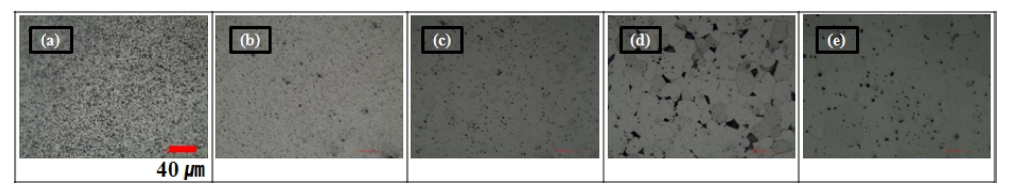
Fig. 6
OM images of sintered samples at (a) 1,273 K, (b) 1,373 K, (c) 1,473 K, (d) 1,573 K, and (e) 1,673 K.
The relative density and average grain size of the sintered samples are plotted against temperature in Fig. 7. The sample sintered at 1,473 K has the highest relative density of ~ 98 % and shows a small decline at higher temperatures. This decrease can be explained by pores trapped inside the grain as well as the ones located on the grain boundaries. As the sintering temperature increases, grain size grows more rapidly, leading to more pores trapped within grains and hindrance to movement of pores along the grain boundaries. Consequently, the densification in the sintered sample is prevented. The average grain size of the sintered samples shows a positive correlation with temperature, with the largest being ~ 37 μm at 1,673 K.
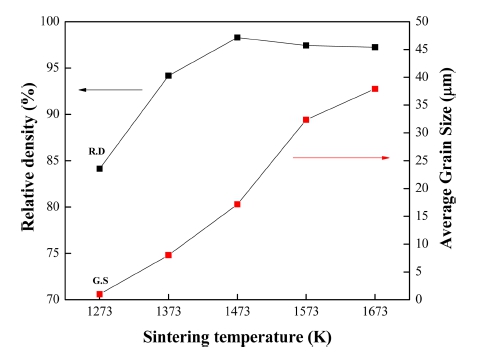
Fig. 8 represents the XRD patterns of samples sintered at different temperatures. The peaks from all the sintering temperatures of 1,273 ~ 1,673 K show that the Fe2O3 phase and Mn2O3 phase initially detected from the powders7) are decomposed, while only MnZnFe2O4 phase is formed instead.
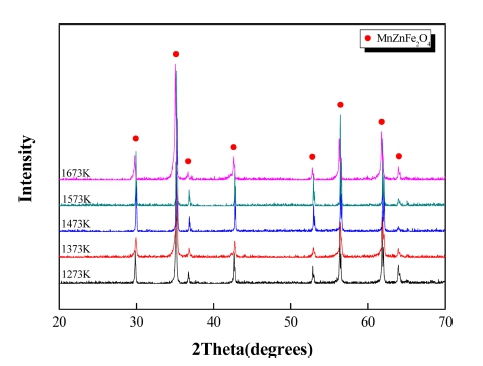
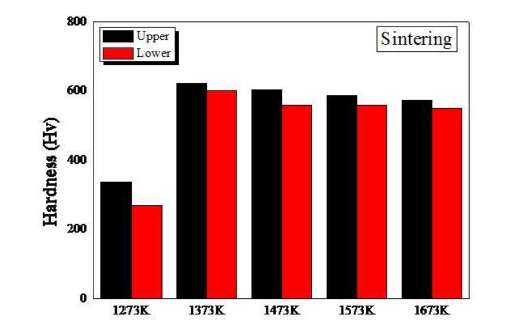
Fig. 9 represents the hardness of samples sintered at different temperatures. The compacted samples receive a force from top down, and thus there exists a density gradient in the direction of the force; the top region of the sample generally shows greater hardness than the lower region. The hardness of the samples increases significantly when the sintering temperature increased from 1,273 K to 1,373 K, due to the increase in density. The sample sintered at 1,473 K, which has the highest density of ~ 97 %, is measured to have a hardness of ~ 590 Hv in the upper region. The sample sintered at 1,373 K showing a relatively lower density of ~ 94 % has the highest hardness of ~ 610 Hv, due to the smaller grain size.
4. Conclusions
The ferrite powders after 3 h of high-energy ball milling at 300 rpm were approximately 230 nm in size, and were composed of 15 nm nanoparticles. Compaction for 3 min at 490 MPa resulted in a high green density of ~ 70 %. No deformation occurred during the compaction process, and the compacted samples showed a difference in top and bottom hardness due to the density gradient. After the subsequent conventional sintering at 1,273 K ~ 1,673 K for 3 h, only the MnZnFe2O4 phase was detected through XRD analysis. The abundance of pores at the sintering temperature of 1,273 K indicates that it is not a sufficient temperature to densify the compacted sample, resulting in the lowest hardness. However, the samples sintered at temperatures higher than 1,273 K revealed high density of more than 95 %. The sintered sample reached the highest micro-hardness of ~ 610 Hv at 1,373 K, and the micro-hardness had a tendency to slightly decrease with increasing temperature, which is due to the change of grain size.
