

1. Introduction
Titanium dioxide (TiO2) is attractive as a dielectric material in a wide range of applications such as transparent coatings, electrochrornic displays,1,2) photocatalytic windows,3,4) photovoltaic solar cells,5,6) gas and humidity sensors and optical waveguide in integrated optics.7,8) It is reported recently that the photocatalytic behavior and self-cleaning performance of TiO2 films can be improved by doping with appropriate elements.9,10) Many studies have been directed to enhance the optical, electrical and dielectric properties of TiO2 by doping it with lanthanide materials like erbium (Er), europium (Eu), terbium (Tb) and cerium (Ce).11-13) As is known, TiO2 ceramics exhibit ultrahigh dielectric constants, low varistor voltages and high nonlinear coefficients, and these properties are functions of the crystal structure, densification, and synthesis temperature. In addition, comparing with other materials, TiO2 ceramics have the advantages of simpler processing technique and lower cost. Therefore, the synthesis of TiO2 ceramics and studies on its physical properties are more attractive.
Generally, TiO2 can be crystallized in three different structural phases as rutile, anatase and brookite. Except the metastable brookite phase, the thermodynamically stable phase will transfer from anatase to rutile with increasing temperature. Compared with other forms, rutile has a more compact crystal structure and a higher refractive index, which explains why it has a wide prospect in practical optical and electrical applications.
In this paper, we reported the fabrication of singlephased rutile TiO2 ceramics by a traditional ceramic process, but sintered at different temperatures. The effect of sintering temperature on microstructures, pore characteristics and impedance properties of ceramics was investigated. The complex impedance spectroscopy analysis was carried out as functions of sintering temperature and frequency. The complex impedance Z* and complex modulus M* plots in a broad frequency range (100 Hz ~ 10 MHz) was used to discern the grain and grain boundary contributions to the dielectric responses.
2. Experiment
The TiO2 ceramics were prepared through standard solid-state reaction technique by using TiO2 powder with a purity of 99.99 % (Macklin Chemical Co. Ltd.). The powder was grinded and pressed into high-density pellets with a diameter of 15 mm and a thickness of 5 mm at a pressure of 7 MPa. The samples were sintered separately at the different temperatures for 6 hours in air atmosphere and slowly cooled down to room temperature. In order to obtain the phase-pure rutile TiO2 ceramics, the sintering temperature was set in the range of 1,000 ~ 1,400 °C. Throughout this paper, we assigned symbols of TO-0, TO-1, TO-2, TO-3, and TO-4 for the samples sintered at 1,000, 1,100, 1,200, 1,300 and 1,400 °C, respectively. The ceramic phases were analyzed by powder x-ray diffraction (XRD) using a Rigaku diffractometer with Cu Kα radiation at 1.54 Ǻ. The bulk densities of the samples were measured by the Archimedes method. In order to measure the impedance properties, the ceramic pellets were carefully polished and subsequently pasted with Ag paste on both sides as electrodes. The temperature dependence was controlled by a temperature controller (Lakeshore 332). The impedance spectroscopy was examined by using an HP4194A analyzer with signal amplitude of 50 mV. Data were taken in a frequency range of 100 Hz ~ 10 MHz.
3. Results and Discussion
Fig. 1 displays the XRD patterns of the prepared TiO2 ceramics sintered at various temperatures. The vertical lines at the bottom indicate the allowed Bragg reflections. The location and intensity of all the reflection peaks could be indexed to a rutile phase with the space group P42/mnm. No impurity could be detected implying the pure phase of the prepared samples. The calculated lattice parameters of the rutile TiO2 ceramics are obtained to be a = 4.594 Å and c = 2.957 Å, which are comparable to that of JCPDS card No. 21-1276. It is obvious from Fig. 1 that the diffraction peaks become sharper and stronger with the sintering temperature improving, which suggests that the average crystalline grain grows with increase in the sintering temperature. According to the Scherrer’s method,14) the crystallite particle size d can be estimated by using the equation
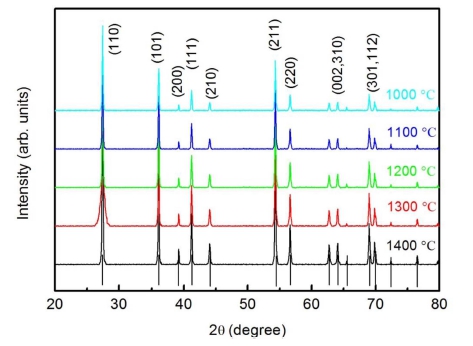
where k = 0.9 is the Scherrer constant, λ is the wavelength of the x-ray source, and β (rad) the full width at half maximum (FWHM) of the x-ray-diffraction peak at the diffraction angle θ. The average grain sizes from the characteristic peaks in the XRD patterns of the samples are shown in Fig. 2 (right vertical axis). The results indicate that grain size tends to increase with sintering temperatures in the temperature range of 1,000 ~ 1,400 °C. The grain size trend is in agreement with the reported results of other oxide ceramics.15-18)
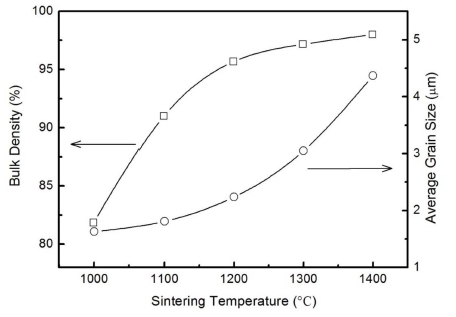
Fig. 2
Variation of density and grain size with sintering temperature for the TiO2 ceramics. The solid lines are the smoothing curves for guidance.
The densification of the TiO2 ceramics at various sintering temperatures is shown in Fig. 2 (left vertical axis). In the sintering temperature range of 1,000 ~ 1,400 °C, the density increases with increasing temperature as a result of the larger crystallite size and the decrease in the number of pores at higher temperature. Despite reports that further increase in the sintering temperature could lead to the decrease of the density of some multicomponent perovskite oxide ceramics,18,19) this feature was not revealed in our experiment. This may be due to the fact that the sintering temperatures are not high enough to cause possible element loss since TiO2 has a high melting point, high thermal and chemical stability.
Generally, the polycrystalline ceramic materials are dielectrically inhomogeneous, and usually have at least three electrical components contributed to the electrical and dielectric effects.17) These are the intrinsic grains, grain boundaries, and electrodes effects. In order to separate the different dielectric responses, impedance spectroscopy is often used to reliably illustrate different dielectric relaxations with demarking frequencies. According to the impedance spectroscopy analysis method,20,21) the assumed equivalent circuit for these types of materials consists of a series association of RC components. The complex impedance Z* is defined as
where
The subscripts g and gb denote the bulk grains and grain boundaries, respectively.
Fig. 3 shows the complex impedance Z'' versus Z' spectroscopy of TiO2 samples sintered at different temperatures in a broad frequency range (100 Hz ~ 10 MHz) at room temperature. The inset shows an enlarged view of the complex impedance at high frequencies. The solid curves are the theoretical fits. The observed two arcs from high to low frequencies can be assigned, respectively, to the dielectric response from grains and grain boundaries in TiO2 ceramics. The electrode relaxation frequency is at least several orders of magnitude lower than that of grain boundaries and grains. Then the electrode response is not resolvable in the frequency range. It is clear from Fig. 3 that the arcs at high frequencies become larger with the sintering temperature increasing, as shown in the inset of Fig. 3, while those at low frequencies are getting smaller. Since the semicircles in the impedance plane related to the resisitances of the different parts in the samples, the variation of the semicircle size suggests the change of Rg and Rgb. The deduced Rg and Rgb values versus the sintering temperatures are plotted in Fig. 4. The resistance of intrinsic grains increases with the increasing sintering temperature, while that of grain boundaries decrease monotonously for the TiO2 samples. This is due to the fact that the grain size tends to increase while the porosity in the samples tends to decrease with sintering temperatures. All the results suggest the influence of sintering temperatures on the impedance properties of different components in TiO2 ceramics.
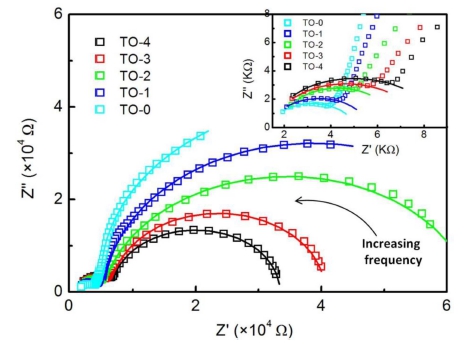
Fig. 3
Complex impedance Z'' vs. Z' plots for the samples. The inset displays an enlarged view of the complex impedance at high frequencies. The fitting results are shown as solid curves.
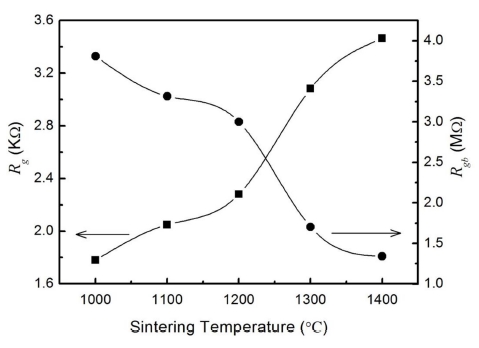
Fig. 4
Variations of Rg and Rgb with the sintering temperatures. The solid lines are the smoothing curves for guidance.
Impedance plots do not provide enough information from grain and grain boundary-associated capacitance nature in the prepared TiO2 samples, while modulus plots can be used to show the variation of capacitances of bulk grains Cg and grain boundaries Cgb with the sintering temperature. The complex modulus M* and impedance Z* are interrelated by M* = iωC0Z, where ω = 2πf is the angular frequency with f being the frequency of the applied field, C0 is the empty cell capacitance. Detailed calculation method can be found in Ref. [22]. With the assumed equivalent circuit for these types of materials, the real part M' and imaginary part M'' of M* are defined as
The plots M'' vs. M' for the prepared samples are shown in Fig. 5. The inset shows an enlarged view of the complex modulus at low frequencies. The solid curves are the theoretical fits. The observed two arcs from low to high frequencies can be assigned, respectively, to the capacitance characteristics from grain boundaries and grains in TiO2 ceramics. Since the semicircles in the modulus plane related to C0/Cgb and C0/Cg of the different parts in the samples, the variation of the semicircle size suggests the change of 1/εgb and 1/εg, where εgb and εg are the relative dielectric constants of grain boundaries and grains in TiO2 ceramics.
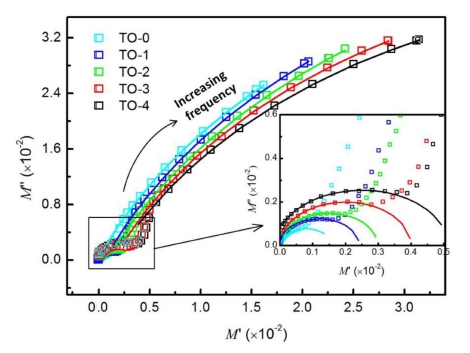
Fig. 5
Complex modulus M'' vs. M' plots for the samples. The inset displays an enlarged view of the complex modulus at low frequencies. The fitting results are shown as solid curves.
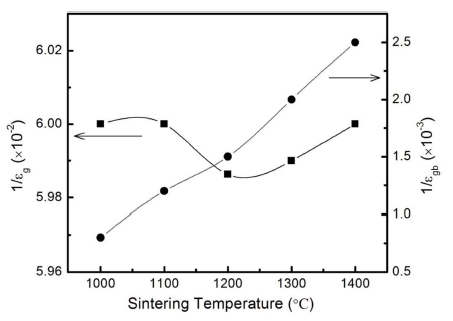
It is clear from Fig. 5 that the variation of the arcs at high frequencies is very small, suggesting 1/εg almost keeps constant with the sintering temperature. The arcs at low frequencies, as shown in the inset of Fig. 5, are getting larger with the increasing sintering temperature indicating the increasing of 1/εgb. The deduced 1/εg and 1/ egb values versus the sintering temperatures are plotted in Fig. 6. The intrinsic grain-related dielectric constant 1/εg does not vary significantly in the sintering temperature range of 1,000 ~ 1,400 °C, while grain boundary-related dielectric constant 1/εgb increases with the increasing sintering temperature. All the results indicate that the sintering temperatures have little effects on the grainrelated capacitance in the prepared TiO2 samples, while the grain boundary-related capacitance decreases with the increasing sintering temperature as a result of the variation of the porosity in the prepared samples. Overall, the impedance and modulus analysis indicate that the higher sintering temperature contributes to the increase of resisitance of the intrinsic grains, and the decrease of the grain boundary-related resisitance and capacitance.
4. Conclusion
Rutile TiO2 ceramics were sintered at different temperatures and the effect of the sintering temperature on the complex impedance and modulus properties was studied. With increasing the sintering temperature, both the density and the crystalline size increased, while the porosity decreased. The complex impedance and modulus spectroscopy indicates that the heterogeneous structures exist in the TiO2 ceramics consisting of grains and grain boundaries. The typical semicircle arcs at high and low frequencies vary with the sintering temperature, which suggests the influence of the sintering temperature on the dielectric properties of grains and grain boundaries in TiO2 ceramics.
