


1. Introduction
Recently, we have experienced problems emerging from energy crisis and environmental pollution. Researches for high efficiency and lightness of metallic materials have been therefore demanded and carried out to solve such problems in all industrial fields. Aluminum alloys have been recognized as environmentally friendly materials because of their relatively light density and high potential for recycling. Among them, Al-Si alloy is a typical alloy used for general industrial casting : automobile, aerospace, shipbuilding and other mechanical tool due to high castability, weldability and corrosion resistance. However, defects such as porosity, oxide film and other inclusions in cast components of Al-Si alloy can prevent high performance applications. To escape from defects, therefore, casting techniques have been developed in many ways. Low pressure casting with a lot of advantages such as clean casting, precise dimension, low equipment cost, easy automatic control has been applied for massproduced cast components. In general, T6 treatment has been conventionally conducted as a general and basic way in order to get better mechanical properties in Al-Si alloy cast components.1-3) By controlling microstructure through T6 treatment, Al-Si alloy becomes strong due to precipitation of Mg2Si phase. It is also well known that Sr, Nd and Y can improve mechanical properties by making change from needle-type to rounded-type in eutectic Si.4-7) Before such subsequent heat treatments, however, it is much more important to control microstructure by using processing conditions during casting. Above all, cooling rate during solidification can play a significant role in making microstructure refined, causing to the improvement of mechanical properties.
In this study, therefore, we have applied the low pressure casting to fabricate the Al-Si alloy cast component. In particular, we employed various metal chills such as SS400, AC4CH and brass with different thickness of 40 ~ 80 mm to control cooling rate. The correlation between cooling rate and microstructure and tensile properties was investigated and discussed. In addition, tensile fracture and deformation behaviors were analyzed based on the observation of deformed microstructure.
2. Experimental Procedure
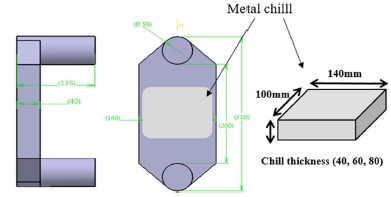
The chemical composition of Al-Si alloy employed in this study is shown in Table 1. The Al-Si alloy has relatively low contents of Fe, Mg, Cu and Sr of less than 100 ppm compared to a commercial A356 alloy.8) The molten Al-Si alloy was poured at 983K into the mold and cast by low pressure casting. Fig. 1 shows schematic shapes of the obtained Al-Si alloy cast and metal chill used in this study. In order to obtain various cooling rates, metal chills such as SS400, AC4CH and brass were used and the thickness of brass chill was also changed from 40 to 80mm. Each chill shows different cooling rate as shown in Table 2. The brass chill caused to the higher cooling rate than SS400 and AC4CH chills. In addition, the cooling rate became faster as the thickness in brass chill increased, resulting in the highest cooling rate in the brass chill with a thickness of 80 mm. Tensile test was carried out at a strain rate of 5 × 10⁻² /s by using specimen with 15 mm in gauge length. At least three specimens were tested to obtain the value of UTS, 0.2 % proof stress (yield strength, YS) and elongation. An optical microscope (OM) and a scanning electron microscope (SEM) were utilized to observe the initial and deformed microstructures and fracture surface, respectively. D1, D2 and shape factor in each specimen were used to describe the microstructure characteristics. Each parameter was defined as follows:
D1: distance between centers of primary α phases. Values of D1 parallel and vertical to tensile direction were separately measured after tensile test.
D2: distance between edges of primary α phases.
Shape factor: 4πA/C2, where A is an area and C is a circumstance. If the shape factor is 1, the shape indicates sphere.


3. Results
3.1 Microstructure
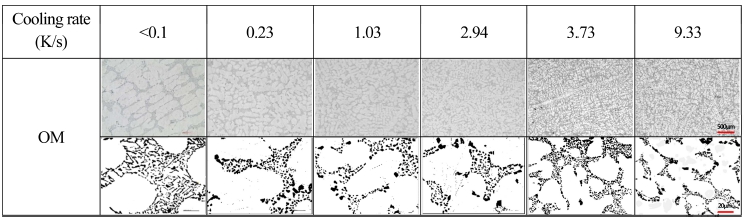
The microstructures of Al-Si alloy with different cooling rates are represented in Fig. 2. It is apparent that the primary α phases become smaller with increasing cooling rate, however, there is no huge difference in the primary α phases at higher cooling rates of more than 2.94 K/s. In addition, it is apparently seen that, at low cooling rate of < 0.1 K/s, the eutectic Si reveals needletype morphology while it becomes small and round at higher cooling rates. This results well corresponds to previous reports that the size and morphology of eutectic Si can be changed by controlling cooling rate.9-11)
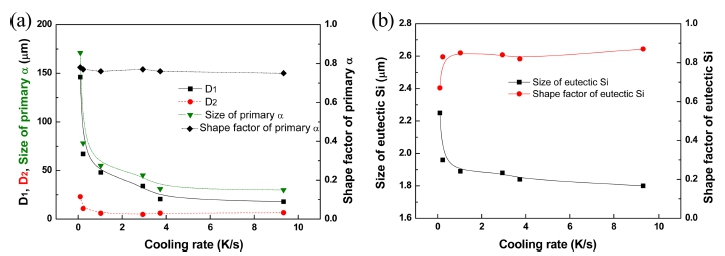
The D1, D2, size and shape factor of primary α phases as well as the size and shape factor of eutectic Si according to cooling rate measured from Fig. 2 are quantitatively plotted in Fig. 3. The D1, D2, sizes of primary α phases dramatically decrease with increasing cooling rate up to approximately 3 K/s, and there is almost no significant change at higher cooling rate of more than 3 K/s. However, the shape factor of primary α phases is almost unchanged. On the other hand, in case of eutectic Si, the size decreases with increasing cooling rate while the shape factor reaches up to over 0.8 at approximately 1.0 K/s in cooling rate remaining unchanged subsequently with increasing cooling rate.
3.2 Tensile properties
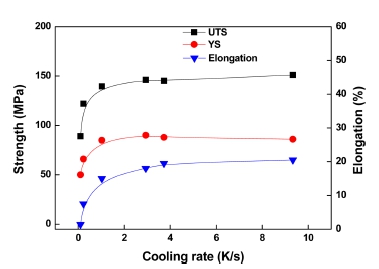
Fig. 4 shows the tensile properties of Al-Si alloy with changing cooing rate. At low cooling rate of < 0.1 K/s, the specimen has the lowest UTS (89 MPa), YS (50 MPa) and elongation (1.4 %). However, the UTS, YS and elongation increase with increasing cooing rate. As a result, the specimens with higher cooling rate of more than approximately 3 K/s show approximately 150 MPa, 90 MPa and 20 % in UTS, YS and elongation, respectively.
From Fig. 3 and 4, the relationship between tensile properties and microstructural factors such as D1, D2, size of primary α phases is replotted in Fig. 5. Additionally, the effects of size and shape of eutectic Si on elongation are plotted in Fig. 6. The UTS and YS increase with decreasing D1, D2, size of primary α phases, which obeys the Hall-petch relation, concurrently with satisfying high elongation. The elongation increases with increasing shape factor of eutectic Si and with decreasing size of eutectic Si as shown in Fig. 6.
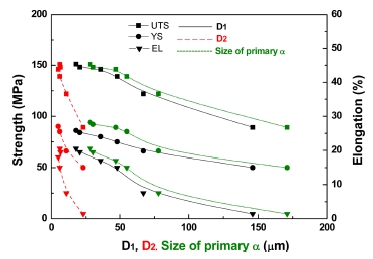
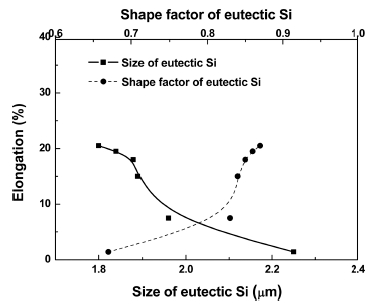
From the above results, it is clear that the reason why the specimen has the lowest strength and elongation at low cooling rate of < 0.1 K/s is due to the unmodified primary α phases and eutectic Si. For the hypoeutectic Al-Si alloy, in addition, the elongation is strongly sensitive to the size and shape of eutectic Si. Therefore, the improved strength and elongation by high cooing rate are attributed to the refinement of primary α phases and the modification of eutectic Si. It is also reported that the refinement of microstructure including eutectic Si improves mechanical properties.12)
3.3 Tensile deformation behavior
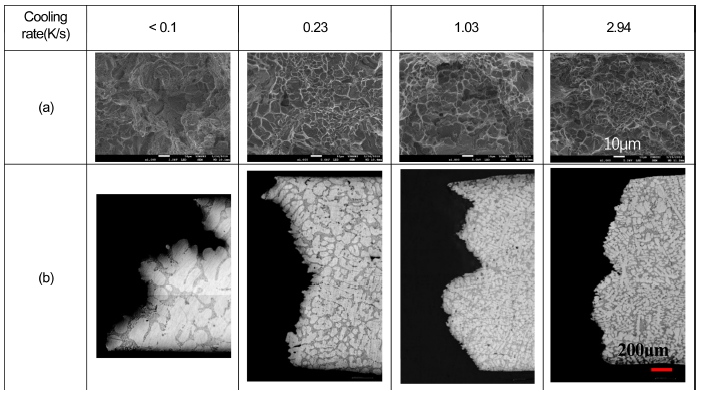
The fracture surfaces and deformed microstructures in the vicinity of fracture in Al-Si alloy are shown in Fig. 7. The fracture surface of specimen with low cooling rate of < 0.1 K/s exhibits brittle fracture with cracks resulting from large primary α phases and needle-type eutectic Si. With increasing cooling rate, however, the specimens have ductile fracture surfaces with small dimple structure, leading to high tensile strength and ductility. This well corresponds to the previous report that the dimple structure becomes typically smaller with increasing cooling rate.13) Based on the deformed microstructure in the vicinity of fracture surface shown in Fig. 7(b), it is also evident that the fracture in Al-Si alloy intergranularly occurs while passing through eutectic region. In addition, the primary α phases in the vicinity of fracture surface at higher cooling rates of more than 0.1 K/s are deformed, leading to high elongation, whereas those are not deformed at < 0.1 K/s in cooling rate. Therefore, the change of D1 and shape factor of primary α phases before/after tensile test are quantitatively measured and plotted in Fig. 8. After tensile test, the shape factor of primary α phases and D1 in the specimen with low cooling rate of < 0.1 K/ s are almost unchanged. However, at higher cooling rates of more than 0.1 K/s, the shape factors of primary α phases decrease after tensile test. In addition, the D1 parallel to tensile direction increases whereas that vertical to tensile direction is not changed. In other words, the primary α phases are elongated to tensile direction. This indicates that the primary α phases preferentially lead to the deformation in Al-Si alloy during tensile test.

4. Conclusions
Large primary α phases and needle-type eutectic Si were shown in Al-Si alloy produced at low cooling rate of < 0.1 K/s. As the cooling rate increased, however, not only the D1, D2 and size of primary α phases but the size of eutectic Si concurrently decreased and the shape factor of eutectic Si increased. This indicates that the higher cooling rates of more than 0.1 K/s make primary α phases and eutectic Si refined.
The UTS, YS and elongation in Al-Si alloy apparently depended on cooling rate, which showed increasing tendency of tensile properties with increasing cooling rate. As the D1, D2 and size of primary α phases decreased, the UTS and YS increased with satisfying high elongation showing dependence on the shape factor and size of eutectic Si. Accordingly, it is clear that the improved tensile strength and elongation are attributed to the refined primary α phases and eutectic Si.
After tensile test, the Al-Si alloy showed the increase of D1 parallel to tensile direction and the decrease of shape factor of primary α phases except Al-Si alloy produced at low cooling rate of < 0.1 K/s. This indicates that the preferential deformation of primary α phases occurs in Al-Si alloy produced at higher cooling rates of more than 0.1 K/s.