

1. Introduction
Recently, lots of studies on lightweight of automobile have been done because of importance of the energy saving and green environment.1-5) Especially, the aluminum alloys for automotive body panel have been studied extensively because of their benefits such as medium strength, good formability and lightweight.6-8) It is also expected that the substitution of such aluminum alloys for steels would result in great improvement in energy economy, recyclability and life-cycle cost. Therefore, the studies on development of newly designed aluminum alloys to satisfy both strength and plastic workability are needed for their wide applications to automotive industry.
In the way, the cold roll bonding (CRB) which has been widely used in manufacturing large sheets can be one way to design various layered materials to have the promising microstructure and mechanical properties.9-13) Compared to other processes, the CRB is very effective because it is easy to be automated and simple to set up continuous process system. Furthermore, the CRB has a great merit to fabricate various clad materials through various combination of metallic sheets. Therefore, many researches have been carried out on the fabrication and evaluation of layered materials processed by the CRB. However, there are only a few studies on multi-layer aluminum alloys by the CRB process, even though they have great potential in the mechanical properties. The authors have studied on fabrication of multi-layer complex aluminum alloy sheets through the CRB.12,13) Through the CRB by various aluminum alloys, the possibility for fabrication of aluminum clad having heterogeneous microstructure and excellent mechanical properties was confirmed in previous studies.12,13) In addition, we have reported the microstructural changes with annealing of a nanostructured aluminum alloy severely plastic deformed by two-layer stack accumulative roll-bonding (ARB) process of three cycles for AA1050 and AA5052 alloys.3) It was found from the previous study3) that a kind of bimodal structure in which both the ultrafine and the coarse grains coexist could be developed by the ARB process. In the way, it is considered that the heterogeneous microstructure could be developed by not only the ARB14) but also the CRB process.15) However, it is little to study the microstructural evolution with annealing for multilayer aluminum alloy sheet processed by the CRB.15) This study is aimed to investigate the microstructural evolution with annealing of a multi-layer stack aluminum sheets fabricated by the CRB process using the various aluminum alloy sheets.
2. Experimental
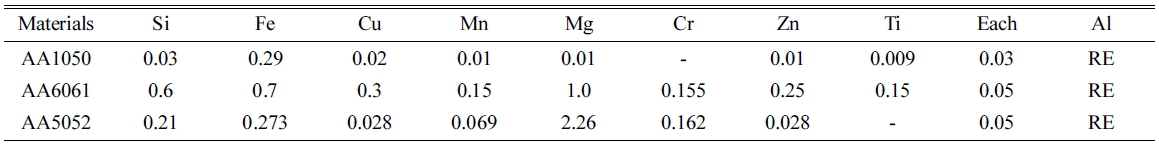
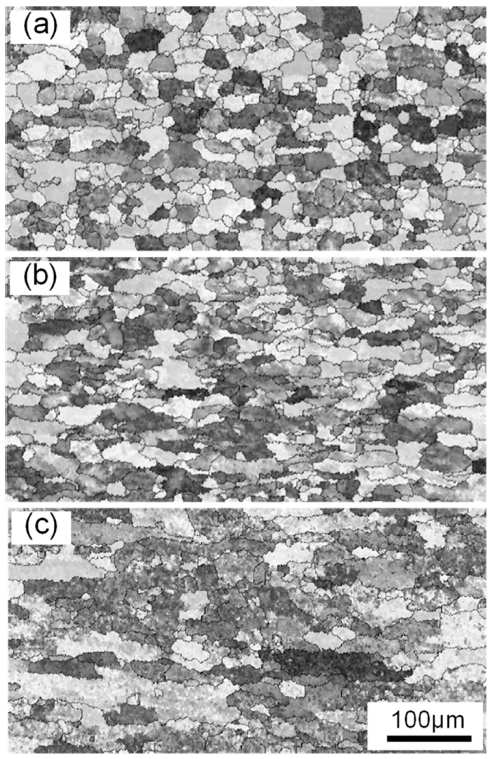
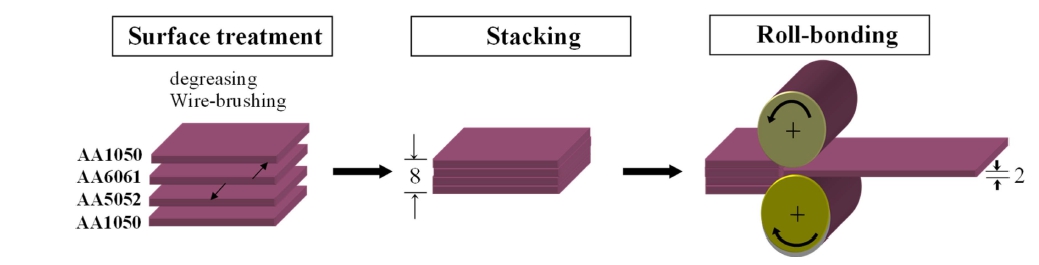
The materials used in this study are commercial AA1050, AA6061 and AA5052 alloys with chemical compositions as Table 1. The as-received materials of 2 mm thickness, 40 mm width, and 300 mm length are annealed for 0.5 h at 400 °C to remove the residual stress for the starting materials. Fig. 1 shows the microstructures of AA6061, AA5052 and AA1050 alloys after annealing, respectively. As shown in Fig. 1, the starting materials of AA6061, AA5052 and AA1050 alloys have the recrystallization structure with average grain diameter of 29, 39 and 72 mm, respectively. A cold roll-bonding process was performed for four-layer sheets in which AA1050, AA5052 and AA6061 sheets are stacked alternately after surface treatments such as degreasing and wire brushing, as shown in Fig. 2. The rolling was done at a speed of 5.0 m/s by a two-high mill with a diameter of 210 mm without lubrication at ambient temperature. That is, the four-layer sheets of 8 mm thickness were roll-bonded to 2 mm thickness by the cold rolling of two passes at total rolling reduction of 75 % (an equivalent strain of 1.6). The as roll-bonded AA1050/AA6061/AA5052/AA1050 multi-layer aluminum sheet was then annealed for 0.5 h at various temperatures of 200 to 400 °C. The microstructural evolution of the roll-bonded and subsequently annealed aluminum sheets were revealed by scanning electron microscopy (SEM) observation and electron backscattered diffraction (EBSD) measurement.
3. Results and Discussion
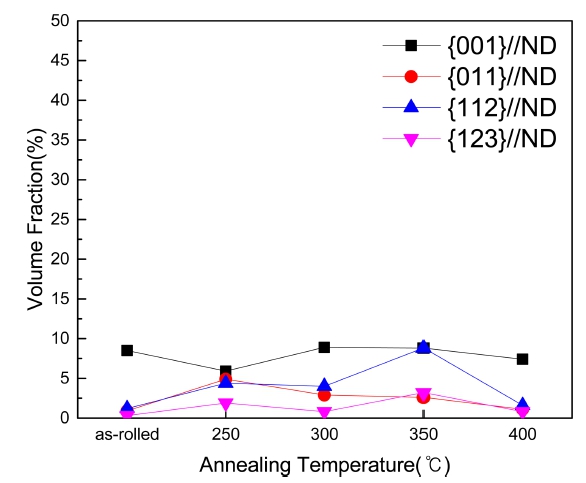
The roll-bonded process was successfully performed without any shape defects, so that a sound multi-layer complex aluminum sheet having an alternating layered structure of AA1050, AA5052 and AA6061 sheets was obtained. Fig. 3 shows the normal direction (ND) and the rolling direction (RD) maps observed at the plane perpendicular to transverse direction (TD plane) of AA6061 region of the as-rolled and subsequently annealed specimens. The color of each point indicates the crystallographic direction parallel to ND and RD of the specimens, corresponding to the colored stereographic triangle, respectively. The as-rolled material shows a type of deformation structure that the grains are elongated to rolling direction. The specimens annealed up to 275 °C still had a deformation structure even though the recovery occurred over all regions. However, the partial recrystallization occurred in the specimen annealed at 300 °C, so that the newly formed grains were observed at various parts, as indicated by the arrows in the figure. Resultantly, the specimen annealed at 350 °C was covered with the equiaxed grains with the average grain diameter of 46 mm over all regions due to occurrence of the complete recrystallization. Fig. 4 shows the variation of volume fraction of texture components developed in the AA6061 region with the increase typical rolling texture components such as {011}//ND, {112}//ND and {123}//ND primarily developed at temperatures up to 300 °C, however above 350 °C their volume fraction decreased and the recrystallization texture as {001}//ND developed instead. This is due to the occurrence of complete recrystallization at higher temperatures, as mentioned in Fig. 3. Fig. 5 is the variation of misorientation angle distribution of grain boundaries with the increase of annealing temperature in AA6061 region. The specimens up to 300 °C showed the high angle grain boundaries (HAGBs) (having the misorientation angles above 15 degrees) of the number fraction of about 30 %, however at 350 °C it had the number fraction of HAGBs of about 16 %. The number fraction of HAGBs was lower than that of low angle grain boundaries(LAGBs) at all annealing conditions.
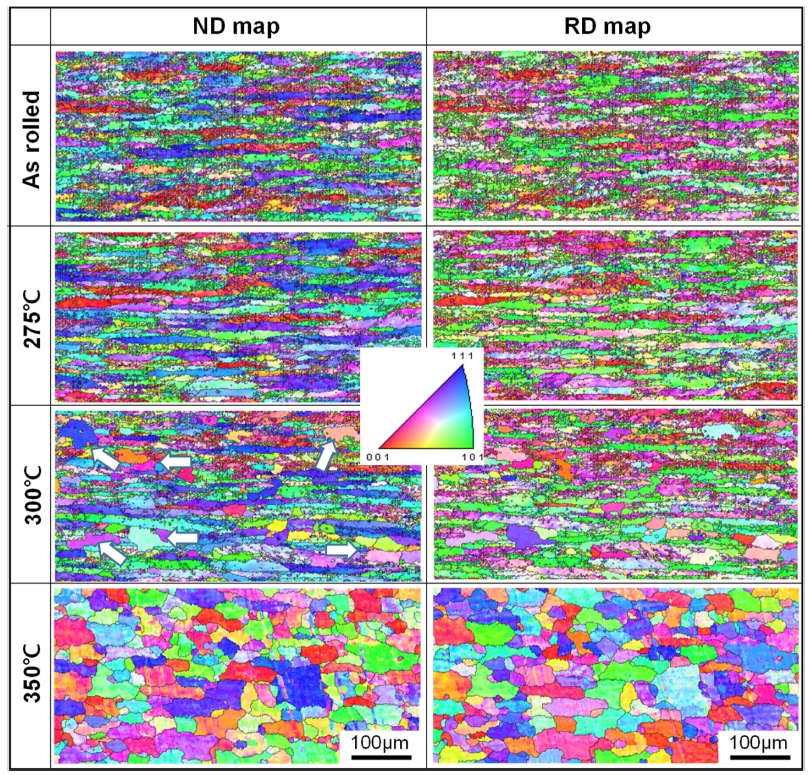
Fig. 3
Normal direction (ND) and the rolling direction (RD) maps obtained in AA6061 region of the as-rolled and subsequently annealed specimens.
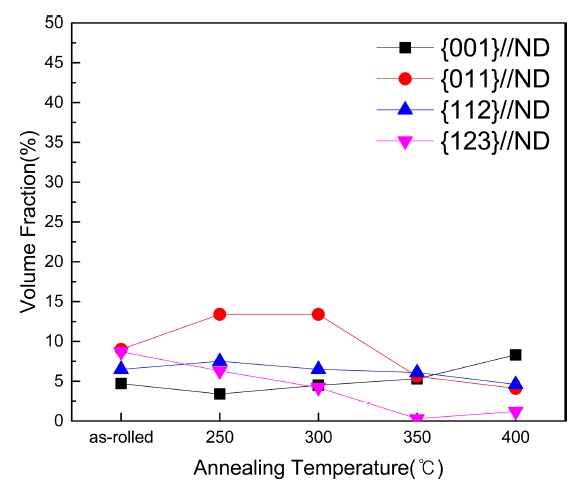
Fig. 4
The variation of volume fraction of texture components developed in the AA6061 region with annealing temperature.
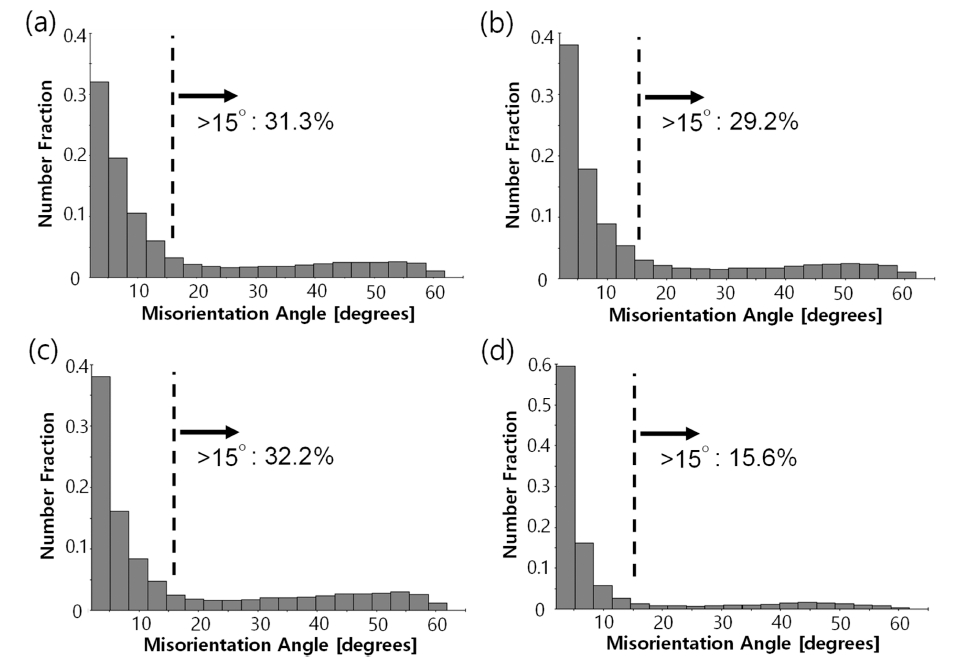
Fig. 5
The variation of misorientation angle distribution of grain boundaries in AA6061 region with annealing temperature. (a) as-rolled, (b) 275 °C, (c) 300 °C and (d) 350 °C.
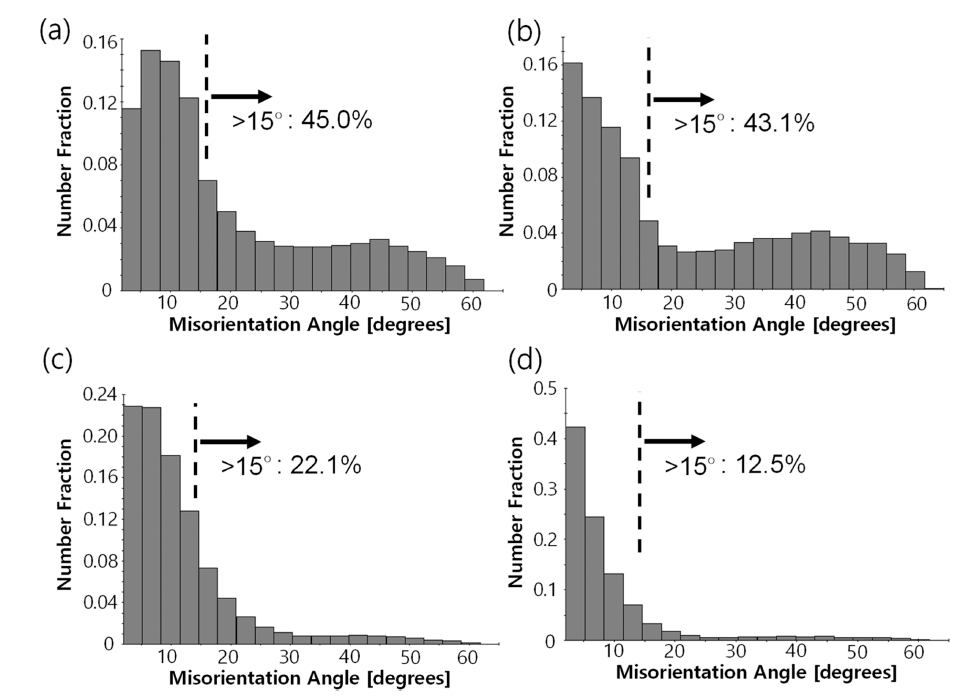
Fig. 6 is the ND and RD maps measured in AA5052 region of the as-rolled and annealed specimens. As shown in the figure, the specimens up to 250 °C had a deformation structure, but above 275 °C they showed a complete recrystallization structure consisted of equiaxed grains with the average diameter of 15 mm. This means that the complete recrystallization in AA5052 occurred at lower temperatures, comparing to that of AA6061. The recrystallization temperature depends on the various factors such as the amount and type of impurities, the amount of deformation, the original grain size before deformation and so on. Because the amount of deformation was almost same between AA5052 and AA6061, the amount and type of impurities and the original grain size would affect the recrystallization temperature. The recrystallization temperature decreases in general with the increase of impurities and the decrease of original grain size. Especially, Mg element decreases the stacking fault energy of aluminum alloy, resulting in decreasing the recrystallization temperature. In these viewpoints, it is explained the reason that the recrystallization temperature of AA5052 alloy was lower than that of AA6061 alloy. It is also well known that iron in AA6061 alloy increases the recrystallization temperature.16) This difference between AA6061 and AA5052 is also seen in the variation of texture development with the increase of annealing temperature. The variation of texture development in AA5052 region is shown in Fig. 7. It is clearly found that the volume fraction of {001}//ND recrystallization texture was largely increased at the specimens above 300 °C, while the components of deformation texture as {011}// ND, {112}//ND and {123}//ND were decreased. This is also due to occurrence of complete recrystallization at higher temperatures. The variation of misorientation angle distribution of grain boundaries in AA5052 region with annealing is shown in Fig. 8. As shown in the figure, for the as-rolled specimen, the number fraction of HAGBs was lower than that of LAGBs. However, the number fraction of HAGBs increased with the increase of annealing temperature, so that it became higher than that of LAGBs at temperatures above 275 °C. Especially, for 300 °C annealed specimen, the HAGBs exhibited high volume percent of about 75 %. This tendency is largely different from that of AA6061 mentioned in Fig. 5.
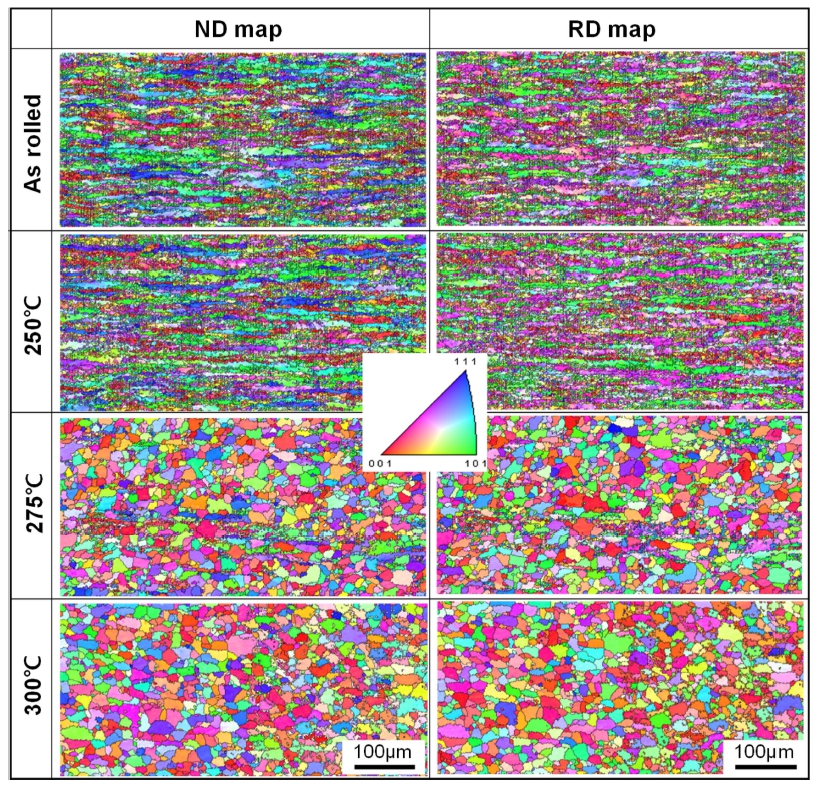
Fig. 6
Normal direction (ND) and the rolling direction (RD) maps obtained in AA5052 region of the as-rolled and subsequently annealed specimens.
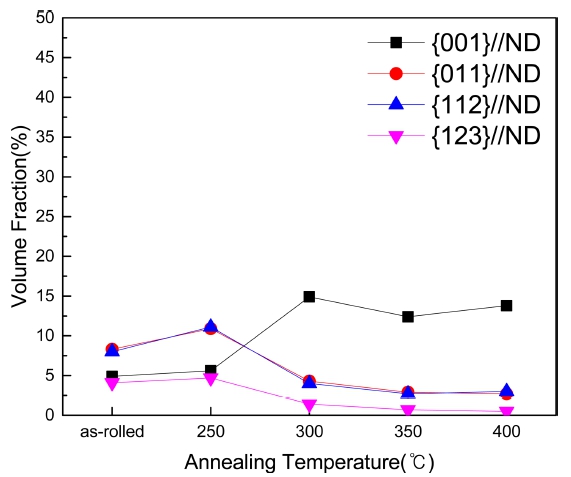
Fig. 7
The variation of volume fraction of texture components developed in the AA5052 region with annealing temperature.
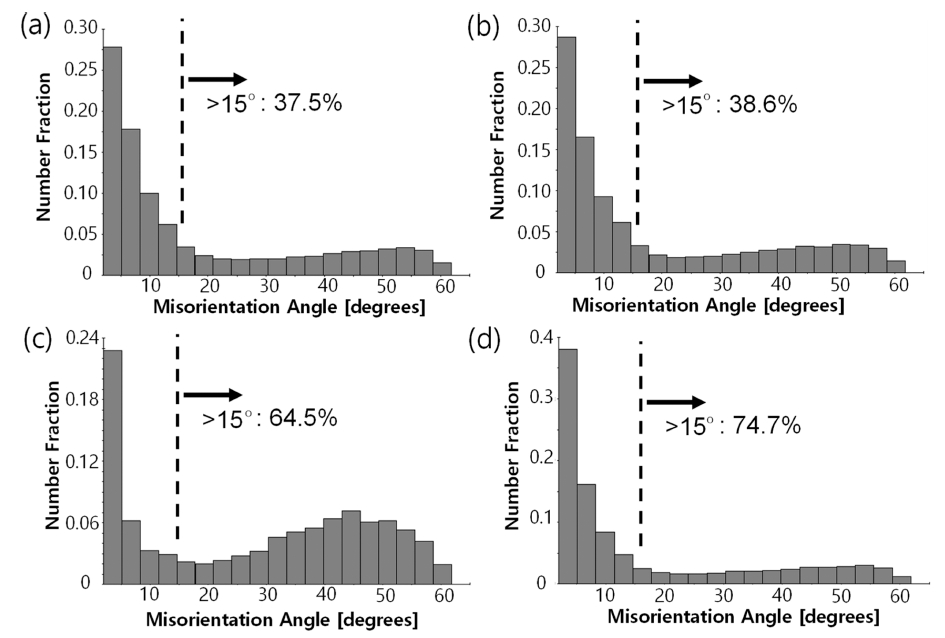
Fig. 8
The variation of misorientation angle distribution of grain boundaries in AA5052 region with annealing temperature. (a) as-rolled, (b) 250 °C, (c) 275 °C and (d) 300 °C.
The ND and RD maps of the as-rolled and annealed specimens in AA1050 region are shown in Fig. 9. It is clear that the complete recrystallization occurred at temperatures above 350 °C. This means that the recrystallization temperature of AA1050 is the highest among their materials. In addition, the recrystallized grains showed the average diameter of 110 mm that is the largest, comparing to those of the other regions as AA6061 and AA5052. The reason of the highest recrystallization temperature and largest grain size in AA1050 is probably due to the largest initial gain size of AA105016) and higher stacking fault energy. Fig. 10 is the variation of texture development in AA1050 region with the increase of annealing temperature. The {001}//ND component primarily developed at all annealing temperatures, different from the other materials. This result is because that the AA1050 is located at positions contacting to upper and lower rolls in which the shear deformation is induced by the friction between the rolls and workpiece. That is, the texture development in AA1050 sheet is explained as follows. The development of {001}//ND texture above 350 °C is caused by the formation of {001}<100> component due to the occurrence of complete static recrystallization. On the other hand, the development of {001}// ND texture at the as-rolled and lower temperatures below 300 °C is considered to be due to development of {001} <110> component of shear texture induced by the shear deformation between rolls and the workpiece. Fig. 11 shows the variation of misorientation angle distribution of grain boundaries with annealing temperature in AA1050 region. As shown in the figure, the number fraction of HAGBs is lower than that of LAGBs for all annealing conditions. It is also found that the number fraction of HAGBs decreased with the increase of annealing temperature. This tendency is the opposite of that of AA5052 region. It is very interesting that the variation of misorientation angle distribution with annealing is different depending on the materials.
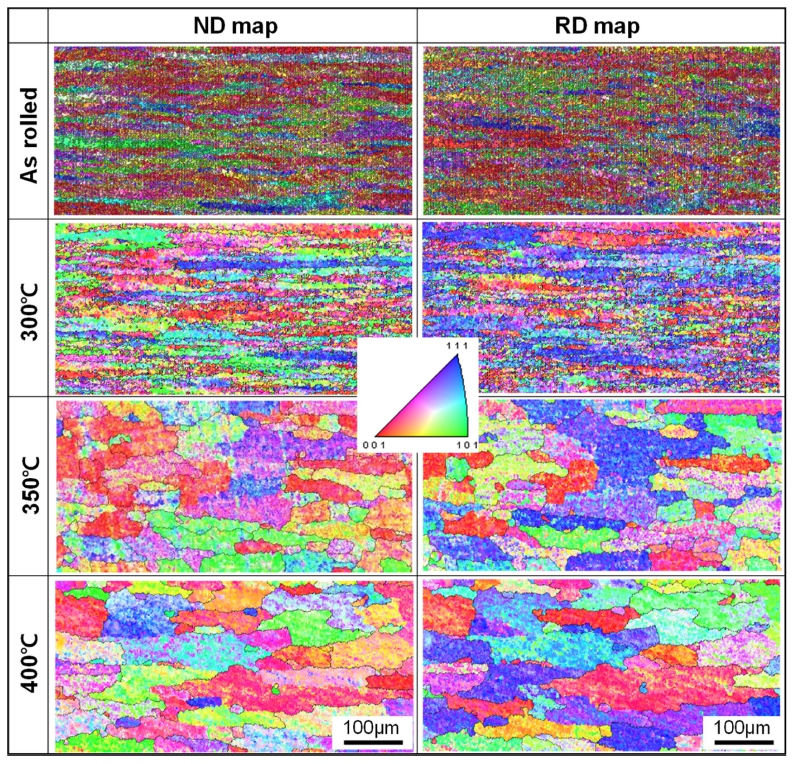
Fig. 9
Normal direction (ND) and the rolling direction (RD) maps obtained in AA1050 region of the as-rolled and subsequently annealed specimens.
4. Conclusions
A multi-layer complex aluminum alloy sheet was successfully fabricated by cold roll-bonding process using different Al alloys as AA1050, AA5052 and AA6061 and subsequently annealed. The roll-bonded aluminum sheet showed a heterogeneous microstructure in thickness direction due to different microstructural evolution depending on the type of aluminum alloys with the increase of annealing temperature. The complete recrystallization temperature of AA5052 alloy was lowest among the materials due to the highest stacking fault energy, and the recrystallized grain size was largest in AA1050 due to the largest initial grain size. The number fraction of HAGBs was lower than that of LAGBs at all annealing conditions in AA6061 and AA1050 regions, however in AA5052 region it became higher than that of LAGBs at temperatures above 275 °C. The recrystallization texture as {001}//ND developed at higher temperatures in AA6061 and AA5052, while the deformation texture as {011}// ND, {112}//ND and {123}//ND components developed at lower temperatures. However, in AA1050 region, {001}/ /ND texture mainly developed at all annealing conditions.
