


1. Introduction
In recent years, there has been an exponential growth in the demand for light materials, such as Mg, for use in mobile electronic devices, lightweight automobiles, and industrial applications. Consequently, interest in the surface treatment of Mg and its alloys has increased. Mg is a light material and it has excellent specific strength, thermal conductivity, electrical conductivity, and electromagnetic interference shielding properties. However, Mgbased alloys are generally so reactive that they can suffer from fast corrosion when used without surface protection, which crucially limits their use. Various anodizing methods can be used to grow porous oxide films on Mg surfaces, but these films do not usually possess sufficient thickness, hardness, or corrosion resistance for practical applications. 1-8) Plasma anodization is a type of surface treatment that forms more protective oxide films electrochemically through the generation of plasma in an aqueous solution. This method uses low-concentration neutral/alkaline electrolytes and does not require harmful substances such as sulfuric acid or chromic acid.
Plasma anodization involves a series of complex processes, including the formation of an oxidation layer, dielectric breakdown, dissolution of the formed oxidation layer, and evolution of gases.9,10) When the voltage applied during the treatment becomes higher than the dielectric breakdown voltage, the oxide film layer breaks, and plasma is generated. Furthermore, metal ions produced via the electrolysis of substrate react with hydroxide ions at the surface to form a strong oxide film.11) Several parameters control the plasma anodization process, but the influence of these variables has not been fully clarified so far.12,13) Electrolyte temperature has not been studied systematically probably because a change in electrolyte temperature is considered insignificant compared with a change in the plasma temperature. However, in an anodic oxidation process even with plasma discharge, films are formed through a reaction with the electrolyte; thus, the process is influenced by the electrolyte temperature.
The purpose of our series of studies1,2) is to develop and optimize a procedure for the generation of a stable oxide film during the plasma-anodizing process of AZ91D magnesium alloy. In this study, we investigate the change in chemical composition and properties of the oxide layer with process temperature, while maintaining the voltage and time in single-pole pulse mode constant.
2. Experimental Methods
The plasma anodization system consists of an electrolytic component, high-voltage supply, high-current pulsereverse rectifier(NF, BP4650), cooler(Lab Companion, RW-1025G), stainless steel(type 316) heat exchanger, and air bubble system. The experimental setup is shown in Fig. 1.1)
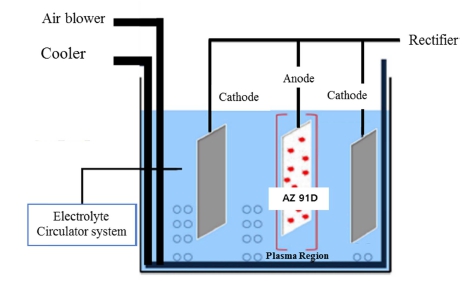
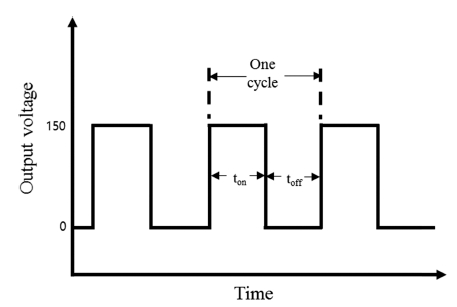
Fig. 2 shows a schematic diagram of the pulsed unipolar output. There is a pause between the pulses, and the voltage is constant(unipolar type). An insulated-gatebipolar- transistor-type multimeter was used in this study to control the pulse width and voltage. In the unipolar mode, each cycle consists of a positive 500 ms half-pulse (on-time) followed by a zero 500 ms(off-time).1)
AZ91D Mg-alloy specimens with the chemical composition shown in Table 1 were used as anodes(12 × 40 mm with thickness 3 mm), whereas graphite plates were used as cathodes. Prior to the plasma anodization, the specimens were cleaned with distilled water and ethanol to remove contamination adhering to the surface. As the current density varies with the inter-electrode distance and electrode size, graphite plates having a size of 10 × 30 mm were placed on both sides of the alloy sample to promote the formation of a uniform oxide film layer. A mixture of 2 g dm−3 of sodium aluminate, 5 g dm−3 of sodium hydroxide, and 10 g dm−3 of sodium silicate was used to prepare an electrolyte solution. We applied pulse voltage of 150 V for 15 min. During the experiment, the temperature of the solution was set constant in the range 10-50 ºC. Fig. 3


As the core temperature of the discharge created during the plasma anodizing treatment is as high as 2,200 ºC owing to the heat generated during the dielectric breakdown, the temperature of the electrolyte solution can increase unless it is controlled. A circulation system with a stainless-steel heat exchange was used to control the temperature of the electrolyte solution, as shown in Fig. 1. During the plasma anodization treatment, a significant amount of oxygen gas is evolved at the anode. If oxygen gas adsorbed on the surface is not eliminated effectively, the oxide film layer does not grow at the adsorption area. This may lead to the formation of a non-uniform porous film. The system used in the present study removes the oxygen gas with a strong pump flow, without the need for additional vortex equipment. The system is designed to orient the direction of the cold electrolyte solution supply toward the position of the specimen. By positioning the specimen parallel to the direction of the electrolyte supply, the oxygen gas adsorbed on the surface is eliminated through the flow of the electrolyte solution.1,2)
The cross-section and composition of the plasmaanodized samples were examined using field-emission scanning electron microscopy(FESEM). The specimens were cut, cold mounted, and polished with silicon carbide(SiC) paper.
The surface roughness was measured using a surface roughness tester(MITUTOYO, SJ-400). The measurement was performed on an area of 0.8 mm2 thrice for each specimen, and the roughness average(Ra) was thereafter calculated. Ra represents the average surface roughness value from the measurement center line to the surface contour.
To evaluate corrosion characteristics, electrochemical impedance spectroscopy(EIS) measurements were performed in a 3 mol dm−3 NaCl solution using a potentiostat/ galvanostat(10 V/2 A, ZIVE SP2, WonATech, Co., Ltd). A frequency response analyzer was used to analyze the EIS output. In addition, a saltwater spray test was performed according to the American Society for Testing and Materials(ASTM) - B117 standard test, using a 5 wt% NaCl solution maintained at 35 ºC for 72 h.
3. Results and Discussion
Fig. 4 illustrates the change in current and plasma images generated on the surface during the anodization. The plasma generation occurs via several stages, and other phenomena are also observed. Conventional anodic oxidation occurs in the stage A, during which substantial gas evolution is also observed. When a breakdown voltage is reached, fine and white micro discharges start at weak sites on the surface of the sample. The amount of plasma generated on the surface increases with time. The maximum orange plasma amount is generated during the stages B and C, whereas in the stage D, the volume occupied by the plasma increases. The current response characteristics over time were similar for 10 and 50 ºC. However, the current response at 10 ºC throughout all the stages was slightly slower than that at 50 ºC. This appears to be related to the higher conductivity of the electrolyte at 50 ºC.
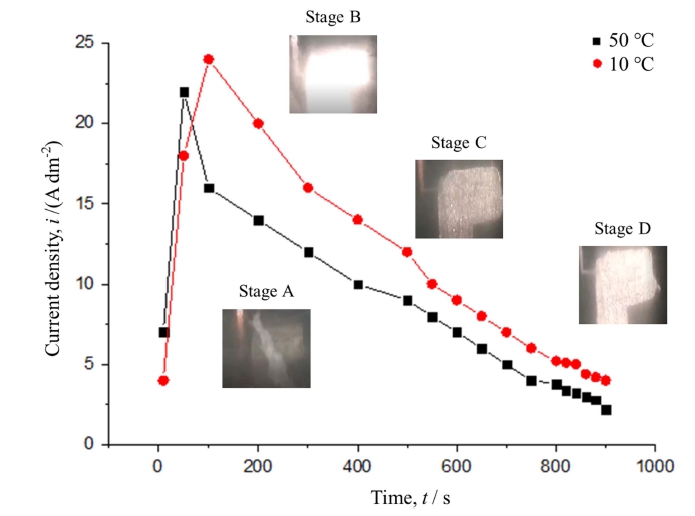
Fig. 5 shows the optical microscopic surface images of the oxide films formed on the AZ91D material after the plasma-anodizing treatment in which the temperature of the electrolyte was varied between 10 and 50 ºC at a fixed voltage of 150 V for 15 min. The surface of the oxide film formed in all the samples included inhomogeneous products, which resulted in crater traces, pores produced by secretions, and craters. This phenomenon was attributed to plasma explosion at the surface of the sample at high temperature, with the molten Mg reacting with the electrolyte rapidly, and subsequently cooling. We observed that the size of the pores produced by the plasma and the amount of products generated by the emission decreased as the temperature of the electrolyte increased.
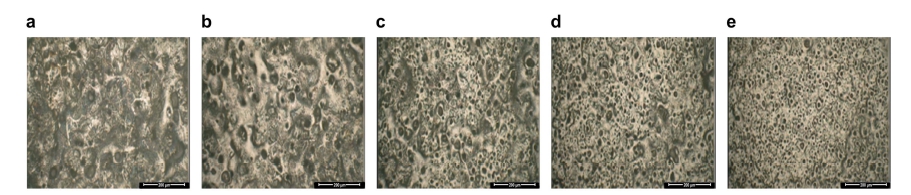
Fig. 5
Digital microscope surface photographs at (a) 10 ºC, (b) 20 ºC, (c) 30 ºC, (d) 40 ºC and (e) 50 ºC.
Fig. 6 shows the roughness of the specimens as a function of the electrolyte temperature. The roughness of the raw material was 0.6 μm in Ra, and the surface roughness decreased from 0.7 to 0.15 μm as the temperature of the electrolyte increased from 10 to 50 ºC. Cooling the electrolyte to a relatively low temperature(10 ºC) caused larger pore size and higher surface roughness.
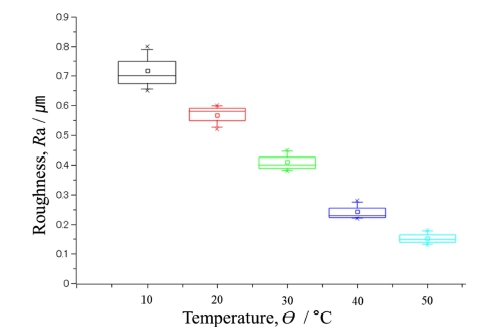
Fig. 6
Effect of electrolyte temperature on the surface roughness of the AZ91D after plasma anodization.
Fig. 7 shows the FESEM images of the surface of the samples treated at 10 and 50 ºC. The surface of the specimen treated at 10 ºC exhibited uneven porosity, with several microscopic cracks and craters. A sinkhole/pipe is a hole created by the plasma at the material/oxide interface, which leads to a porous coating with low durability.14) The surface and cross-section of the oxidized specimen treated at 50 ºC showed a relatively constant pore size, and only a small amount of exhaust material was detected on the surface. In addition, the number of microcracks appeared to be relatively small.
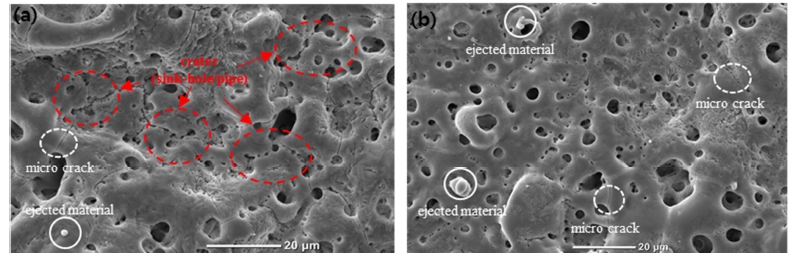
Microcracks are considered to be generated because the temperature of the metallic material increases in response to the heat generated in the plasma electrolytic oxidation process, and the tensile stress becomes larger than the thermal expansion coefficient of the oxide film. The pores of the oxide film are generated by the evolution of oxygen during the plasma anodization process. As the arc discharge time during the process is very short (approximately 10 μs), the oxygen generated during the process is trapped in the high-temperature and highpressure molten oxide.15) As the temperature of the electrolyte increases, the electrical conductivity of the electrolyte also increases. Increasing the electrical conductivity of the electrolyte reduces the breakdown voltage during plasma anodization coating and reduces the dielectric strength. Therefore, the arc discharge persists for a longer time and its intensity is amplified even if the plasma anodization progresses for the same time. The high- strength arc discharge on the surface of the material promotes oxide film sintering, and the temperature is thereafter decreased by the relatively cool electrolyte, to form a dense and uniform oxide film.16)
Fig. 8 shows the results of the energy-dispersive X-ray spectroscopy(EDS) element mapping and distribution of Mg, O, and Si in the oxide films at the temperatures of 10 and 50 ºC. Mg, O, and Si were the main components of the film and Si and O were uniformly distributed within it. At 50 ºC, the thickness of the cross-section of the oxide film was relatively uniform.
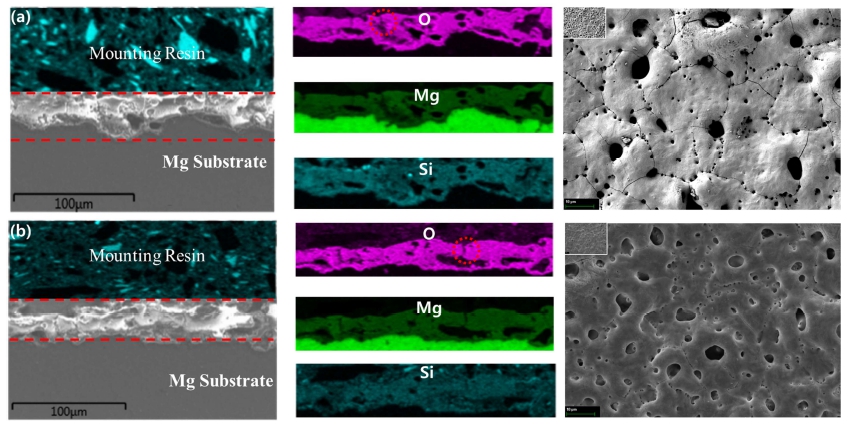
Fig. 8
Cross-sectional view and EDS mapping of the AZ91D after plasma anodization at (a) 10 ºC and (b) 50 ºC.
As shown in Figs. 6, 7, and 8, the plasma-anodized oxide film tends to be uniformly formed as the electrolyte temperature increases. Fig. 9 shows the mean film thickness determined from the cross-section of the anodized film at 10-50 ºC. The thickness of the oxide film tended to decrease as the temperature of the electrolyte increased. The thickness of the oxide film was 41-37 μm at 10-20 ºC and 28-24 μm at 30-50 ºC.
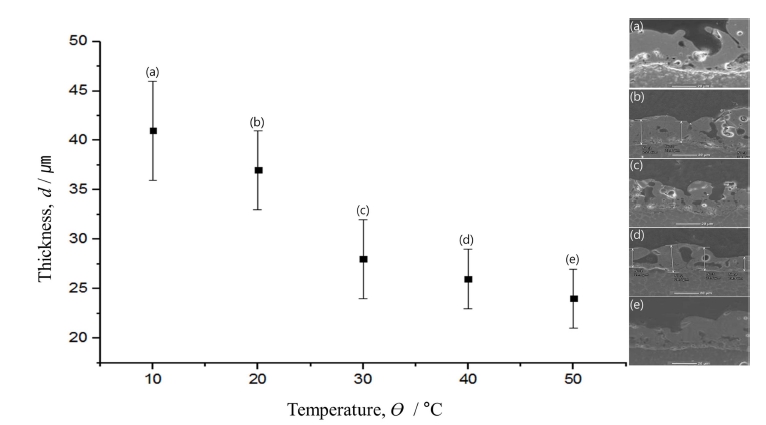
Fig. 9
Effect of electrolyte temperature on the thickness of oxide film formed by plasma anodization of AZ91D.
Fig. 10 shows the EDS analysis results for the surface oxide films formed at 10-50 ºC. As the temperature increased, Mg and other cations increased whereas oxygen decreased in mass. This suggests that the oxide films formed at lower temperatures were highly hydrated and as the temperature increased, they became dehydrated, i.e.,
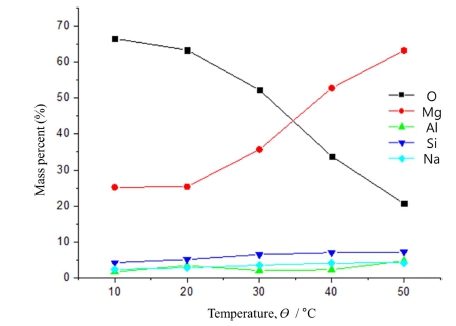
Fig. 10
Effect of electrolyte temperature on the composition of oxide film formed by plasma anodization of AZ91D.
This may also explain the temperature dependence of the thickness of the oxide film, shown in Fig. 9.
Fig. 11 shows the corrosion resistance of the samples measured in a 3 mol dm−3 NaCl solution using EIS, as a function of the anodizing temperature. As expected, the corrosion resistance increased with an increase in the temperature of the plasma-anodizing electrolyte. In this figure, the corrosion resistance value was related to the magnitude of the AC impedance at 10 Hz, because the polarization resistance in the corrosion reaction is usually dominant at this frequency. The Bode plot of the impedance indicated that the magnitude of the impedance was almost constant below 10 Hz.
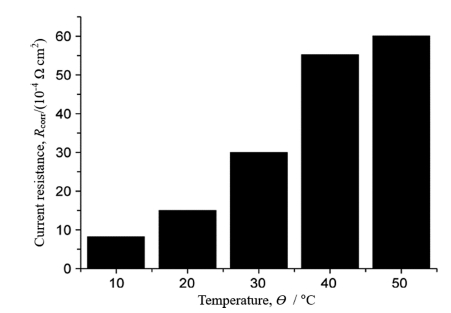
Fig. 11
Effect of electrolyte temperature for plasma anodization on the corrosion resistance of the treated AZ91D. (solution: 3 mol dm−3 NaCl, temperature: 25 ºC).
Fig. 12 shows the results of a brine spray test performed for 72 h in accordance with the ASTM standard, to evaluate the corrosion characteristics of the plasmaanodized Mg alloy specimens. The experiment was performed using a 5 wt% NaCl solution and the temperature was maintained at 35 ºC. The corrosion properties were quantified by evaluating the average grade number(RN). RN values of 3.5 and 6 were obtained at 10 and 20 ºC, respectively, whereas the samples anodized at 30-50 ºC showed RN values in the range 7-9. These results mirror the trend observed in the EIS data shown in Fig. 11.
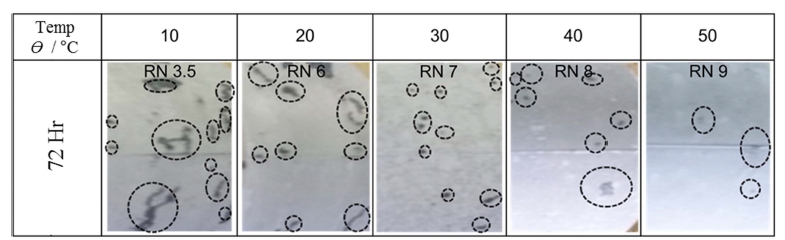
The corrosion resistance is affected by pores in the oxide films, which are attributed to bubble generation during the plasma-anodizing process. In particular, it is important to verify the presence of open pores in order to assess the corrosion resistance of the film because the pores penetrating the oxide film become a passage through which corrosive substances can enter from the outside.17) Oxide films formed via plasma anodization usually have a three-layer structure, where the middle layer is the densest and plays the most important role in corrosion resistance.18)
Fig. 13 shows the cross-sectional structure of the oxide film, which had been plasma anodized at 10 ºC (a) and 50 ºC (b), after the salt spray test.
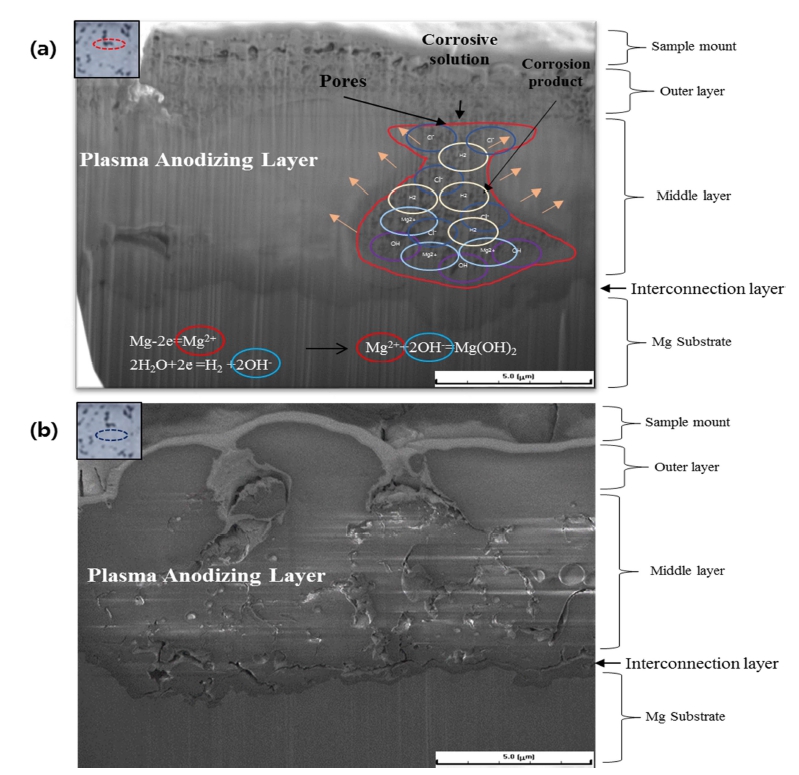
Fig. 13
Cross-sectional micrographs of the corrosion site of the AZ91D after the salt spray test for 72 h with electrolysis temperatures at (a) 10 ºC and (b) 50 ºC(15 min).
When the electrolyte temperature was 10 ºC, as shown in Fig. 13(a), the outer layer had many pores through which aggressive ions could intrude easily and build up where defects were concentrated. This may have led to the eventual breakdown of Mg substrate locally. In contrast, the film formed at 50 ºC had a less porous outer layer. This layer and the middle dense layer appear to have effectively protected the substrate from corrosion.
Fig. 14 shows that the aggressive Cl− ions were accumulated in the oxide film cracks, where corrosion occurred. It shows that the entire oxide film was destroyed by the Cl− ion, the corrosion product spread over the upper surface of the oxide film, and the protection of the oxide film was lost.
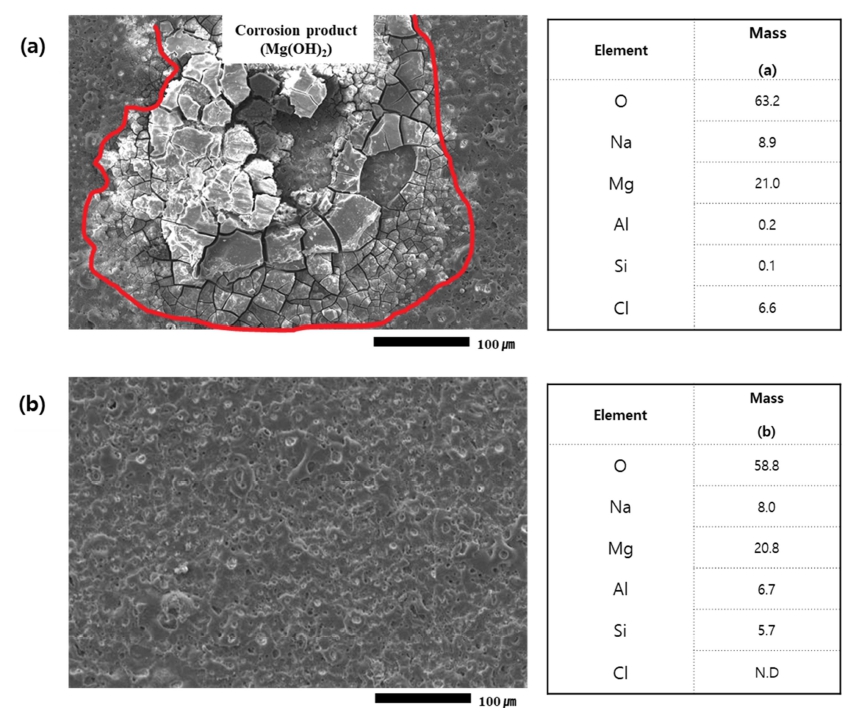
Fig. 14
Surface micrographs of the corrosion area and EDS component analyses of the AZ91D after the salt spray test for 72 h with plasma anodization temperatures at (a) 10 ºC and (b) 50 ºC.
The corrosion reaction of Mg proceeds through the following redox reaction:
Mg in a neutral or alkaline solution is oxidized to Mg2+ and reacts with OH− ions formed through the simultaneous reduction of water to form Mg(OH)2 on the magnesium surface. The worse surface roughness with more pene-trating pores produced at lower temperatures is thus related to the poor durability of the material in a corrosive environment.
4. Conclusions
We described a plasma-anodizing procedure suitable for the anodization of Mg alloys and demonstrated its applicability to AZ91D alloy. The anodization process is evaluated with respect to the electrolyte temperature, which can be optimized by obtaining a uniform oxide layer with better corrosion resistance. The concentration of defects in the oxide layer decreased as the processing temperature was increased from 10 to 50 ºC. The surface roughness also decreased, and the corrosion resistance increased from RN = 3.5 to 9. We confirmed that Mg, Al, O, and Si were uniformly distributed on the surface of the oxide film in the optimized condition. As the electrolyte temperature increased, the oxygen content in the oxide film decreased because of dehydration. Cl- ions were detected in the corroded area. Based on the results of this study, a higher temperature of the electrolyte is favorable for plasma anodization of AZ91D to obtain a film with higher homogeneity and corrosion resistance.