

1. Introduction
2. Experimental Procedure
2.1. Materials and method
2.2. GO preparation
2.3. Preparation of the h-MoO3/GO composite
2.4. Characterizations
3. Results and Discussion
3.1. Synthesis mechanism
3.2. Physicochemical characterizations
3.3. Electrochemical analysis
4. Conclusion
1. Introduction
The main sources of energy are fossil fuels and recurring natural sources. One of the immediate problems is storing and controlling energy. For energy to be continuously provided, enormous potential must be maintained. To reduce the energy peaks, the energy sources were transformed into various forms and partially stored in the grid system. The main energy storage methods currently employed are electrochemical storage devices, hydrogen storage devices, and water energy stored in dams. Electrochemical storage systems allow direct storage of electrical energy.1) Researchers have suggested supercapacitors (SCs) as substitutes for other storage devices in both stand alone and hybrid applications.2,3) Furthermore, SCs are increasingly used as temporary energy storage devices for regenerative braking in hybrid and electrical vehicles. High power density, short charge-discharge times, low internal resistance, long lifespan, and environmental friendliness are only a few benefits of using SCs. In the past ten years, several hybridization topologies have been proposed and implemented to extend the cycle life and power density of energy storage systems. Pseudocapacitors, with their unique energy storage mechanism, offer a higher specific capacitance than the commonly used electric double-layer capacitors.4)
SCs can be classified into three main categories: electrochemical double-layer capacitors (EDLC), pseudocapacitors, and hybrid SCs. Materials composed of carbon with EDLC characteristics exhibit limited capacitance. However, electrode materials based on pseudocapacitive properties (such as RuO2, MnO2, and common conducting polymers) are different from EDLC and typical batteries because they store charges through various mechanisms, such as redox reactions or intercalation. Pseudocapacitors undergo surface redox reactions, permitting them to have higher capacitance and energy density than EDLC.5) In the multilayer crystal structure of MoO3 van der Waals forces, the layers are held together. This architecture ensures excellent electrochemical performance by facilitating the rapid insertion of ions into electrode materials. The various oxidation states of molybdenum allow molybdenum trioxide to participate in multiple redox reactions during cycling, thereby providing a broad electrochemical window.4) Different metal oxide-graphene nanocomposites with different morphologies designed for certain uses have been described including MnO2-graphene,6,7,8,9) ZnO-graphene,10,11) Fe3O4-graphene,12,13) Co3O4-graphene,14,15) MoO3-graphene.16,17) Despite the importance of molybdenum oxide-graphene nanocomposites and their diverse applications, their potential as electrode materials in SCs is rarely reported. Furthermore, several preparation methods have been reported for the successful synthesis of molybdenum oxide-graphene nanocomposites, such as a combination of thermal evaporation and mechanical exfoliation,18) hydrothermal,19) chemical vapour deposition (CVD),20) and vacuum thermal deposition,21) solvothermal,22) and chemical reduction.23) The different morphologies of MoO3/graphene oxide (GO) reported, such as nanowires,24) Nanoflake and nanobelt,25) hexagonal MoO3 rods,26) and nanosheets.27) Maheswari and Muralidharan28) reported that these morphologies significantly influence the specific capacitance of the material. The hydrothermal approach enables the investigation of the effects of variables like temperature, pressure, and reaction time on the material’s physiochemical performance. MoO3/GO nanocomposites are significant and have many uses, but their potential as supercapacitor electrode materials is rarely documented. Khalate et al.29) reported nanostructured molybdenum trioxide α-MoO3 thin films were deposited to study how substrate temperature affects their microstructural, morphological, optical, electrical, and electrochemical properties. In the Na2SO4 (0.5 M) electrolyte, the measured electrochemical characteristics of the α-MoO3 thin film electrode deposited at 673 K show a significantly enhanced specific capacitance of roughly 73.61 Fg-1 at current density 0.6 mA/cm. Tang et al.30) reported using a hydrothermal process, a certain quantity of GO was added to create an h-MoO3/graphene composite. A potential use of this material for lithium-ion batteries was suggested by tests conducted on it as an anode material. After 30 cycles at a current density of 100 mA/g, a reversible capacity of up to 739 mAh/g was achieved. It’s interesting to note that a specific amount of GO was required to generate h-MoO3, but removing GO will cause α-MoO3 to form instead. They investigate the template effect of GO on the production of other materials by this outcome.
In this study, we have reported the synthesis of GO using the Hummers method and an h-MoO3/GO composite using the hydrothermal method, and we studied the supercapacitor performance. As part of this investigation, we examined the supercapacitive characteristics of h-MoO3 and h-MoO3/GO, along with the structural and morphological characteristics of this material. Graphene acted as conductive and supportive material. Previous studies have discovered MoO3 in different crystalline forms, e.g., orthorhombic, monoclinic, etc.9) Using hexagonal MoO3 as a base material adds novelty, especially with its unique electrochemical properties. The study demonstrates that the hexagonal crystal structure of MoO3 remains complete even after the incorporation of GO in h-MoO3, confirming the material’s structural stability. This aspect of maintaining structural integrity is a notable finding that may not have been emphasized in another research. The study aims to assess the impact of GO incorporation on the morphology, crystalline structure and the electrochemical performance of SCs.31,32) As prepared h-MoO3/GO exhibits excellent electrochemical performance with the highest specific capacitance 134 Fg-1 at a current density of 3 mA/cm-2. And superior energy density of 26.8 Wh/kg-1 and power density of 560 W/kg-1. Compared to other reports in the literature, this is the best supercapacitor performance that we are aware of, especially in terms of specific capacitance, cyclic stability, and energy density value.
2. Experimental Procedure
2.1. Materials and method
All the chemical reagents are commercially available ammonium heptamolybdate tetrahydrate [(NH4)6Mo7O24·4H2O] was used as a precursor and 3 M HNO3 was used for adjusting the pH of the solution, sodium nitrate (NaNO3), hydrogen peroxide (H2O2), concentrated sulfuric acid (H2SO4), potassium permanent (KMnO4), the graphite powder was obtained from Alfa Aesar chemicals are of analytical grade and used without any further purifications. Distilled water was obtained by using a distilled water purification system.
2.2. GO preparation
The modified Hummers method was used to synthesize GO using graphite powder as the starting material. Graphite powder (1.5 g) and NaNO3 (1.5 g) were added to the (69 mL) of H2SO4 and stirred for 15 min. KMnO4 (4.5 g) was slowly added to the mixture at a temperature below 0~5 °C. The mixture was stirred for 1 h at R.T. and add 120 mL of double distilled water (DDW), stir for 30 min and set the temperature at 90 °C. The mixture was then treated with the addition of 10 mL H2O2. The colour of the solution changed from brown to yellow. Finally, the mixture was centrifuged with DDW, the powder was dried at 80 °C and the GO powder was collected.33)
2.3. Preparation of the h-MoO3/GO composite
The preparation of the MoO3/GO composite was done by using a simple hydrothermal method. In a typical synthesis procedure, 40 mg (2 mg/mL) of the as-prepared GO was dispersed in DDW via sonication for 1 h. The 0.05 M (NH4)6Mo7O24·4H2O was dissolved in 50 mL of DDW, and the pH of the solution was adjusted to 2 using 3 M nitric acid HNO3. The two solutions were then mixed and stirred for 30 min. The resultant mixture was then transferred to a Teflon-lined stainless-steel autoclave. The autoclave was then heated at 180 °C for 18 h. After natural cooling, the solution was centrifuged using ethanol and DDW. h-MoO3/GO powder composite was dried on a hot plate for 12 h. at 80 °C and powder was collected. The pure h-MoO3 was prepared using the same procedure under the same reaction conditions but without the addition of GO.34)
2.4. Characterizations
The prepared h-MoO3 and h-MoO3/GO were analyzed using the X-ray diffraction (XRD) technique for structural analysis. Further Raman spectroscopy was studied for the molecular interaction of the constituents and was used to determine the chemical constituents of the composite obtained. The morphologies of the prepared samples were examined using field-emission scanning electron microscopy (FESEM).
3. Results and Discussion
3.1. Synthesis mechanism
The precursor [(NH4)6Mo7O24·4H2O] is added to diluted in DDW along with 3 M HNO3 to initiate the nucleation reaction. The solution’s reaction temperature rises when exposed to hydrothermal conditions, providing the oxidation process with enough energy to produce h-MoO3.
The interaction of (NH4)6Mo7O24·4H2O with molybdic acid (H2MoO4) and nitric acid 3HNO3 can be explained as an acid-base reaction, Eq. (1) in which the ammonium ion (NH)+ (NH4)+ from the (NH4)6Mo7O24·4H2O acts as a base and reacts with the hydrogen ion H+. from the nitric acid to form water and ammonium nitrate. In the meantime, H2MoO4 is created when the hydrogen ion from nitric acid combines with the molybdate ion (H2MoO4)2 (MoO4). H-MoO3 particles are present in the solution at the initial hydrothermal state Eq. (2) The molybdenum oxide species preferentially nucleate and grow on the GO surface due to the interaction between Mo species and the oxygen functional groups on GO. The GO acts as a template, allowing for the uniform distribution of MoO3 nanostructures.35)
3.2. Physicochemical characterizations
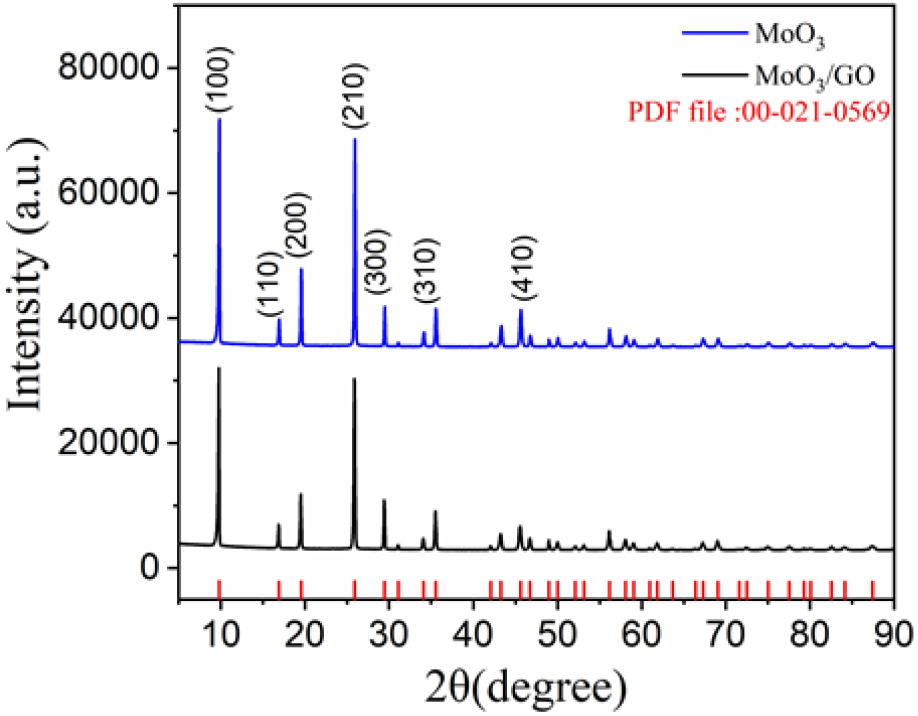
Fig. 1 shows the XRD patterns of pure h-MoO3 and h-MoO3/GO nanocomposites in the 5~10° range. MoO3 is known to exist in three different forms: hexagonal h-MoO, orthorhombic α-MoO3, and monoclinic β-MoO3.36,37) The XRD patterns were indexed to the (100), (110), (200), (210), (300), (310), and (410) planes of the hexagonal structure. The pattern also matched with the pdf file of 00-021-0569. No impurities or other materials were observed in the XRD patterns. This matches well with the pdf file. However, the intensity of the h-MoO3/GO composite material is slightly lower than that of pure h-MoO3, which confirms the formation of the nanocomposite and is in good agreement with previous reports.38) Furthermore, the crystallite sizes (D) of h-MoO3 and h-MoO3/GO was computed using the Scherrer equation as follows Eq. (3).
where, K is a constant value of 0.94, λ is the wavelength of the X-ray radiation (λ = 0.15406 nm), and β is the line width at the half-maximum height. Owing to the presence of graphene, the crystalline size of the h-MoO3/GO composite material was 34.7 nm which is smaller than pure h-MoO3 43.3 nm. The reduced crystallite size positively impacts electrochemical performance, as it increases the surface area, thereby offering more active sites for electrochemical reactions and facilitating better ion diffusion reported in earlier studies.38)
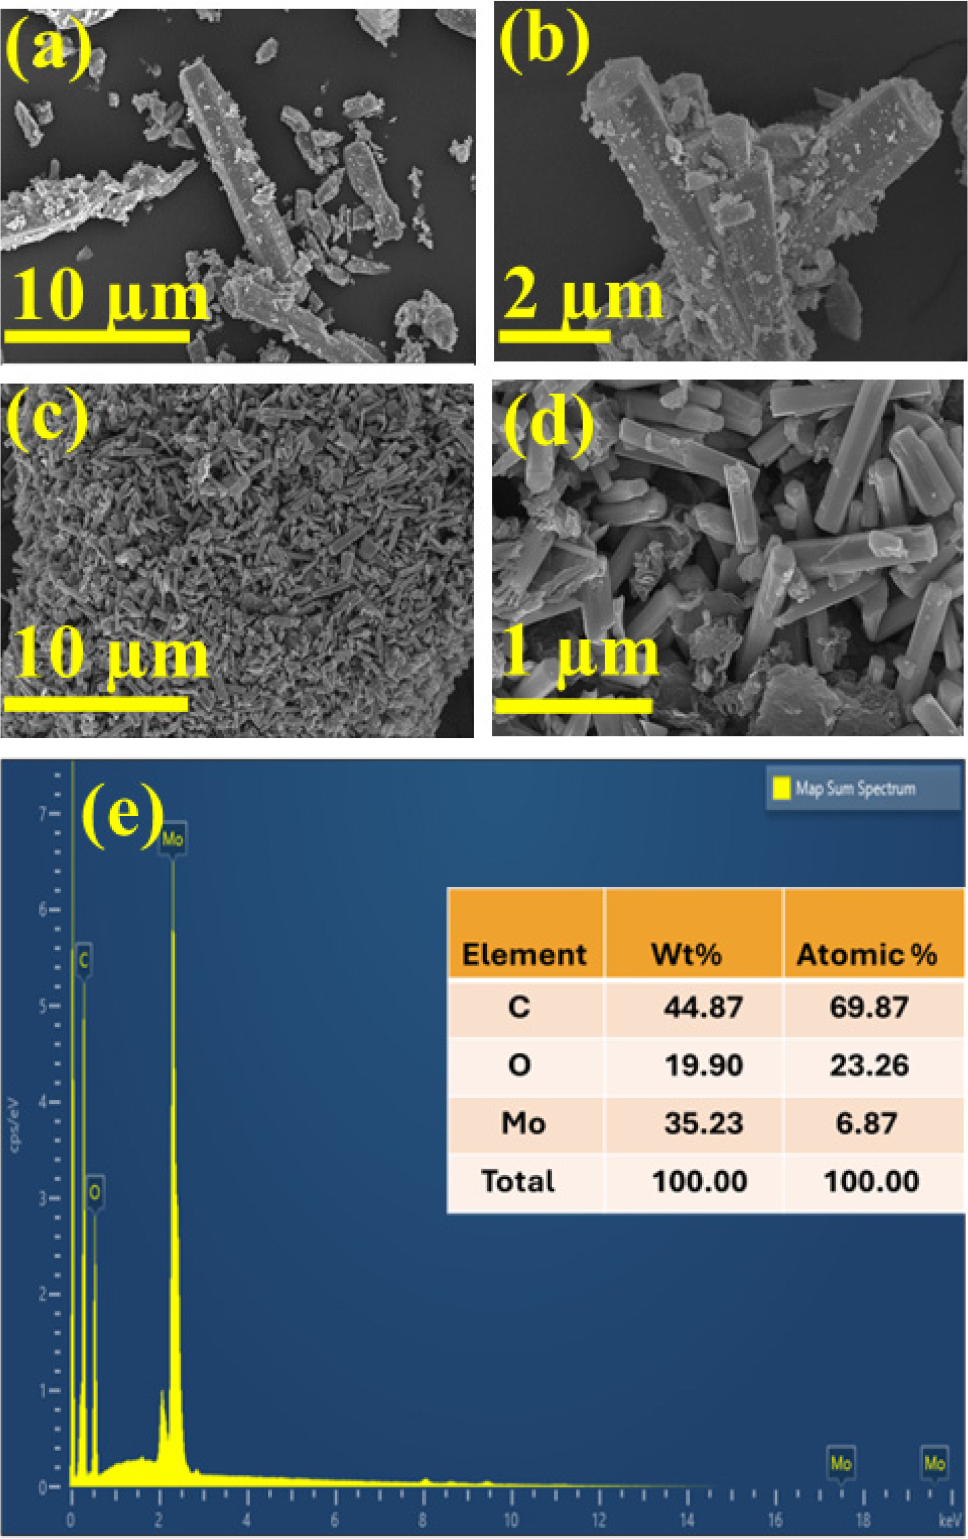
The morphologies of the prepared h-MoO3 and h-MoO3/GO samples were analyzed using FESEM at different magnifications. The FESEM images in Fig. 2(a, b) typically show hexagonal micro-rods of molybdenum oxide. Fig. 2(c, d) show that the MoO3/GO composite hexagonal rods were well connected to graphene sheets with a diameter of 1 µm and a length of 4 µm. Compared to other MoO3 crystal phases, such as orthorhombic and monoclinic forms, hexagonal h-MoO3 displays distinct characteristics. Its tunnel-like structure promotes efficient electron-hole separation and creates space for cation insertion and extraction. These properties significantly enhance ionic transport and electron mobility, making h-MoO3 highly advantageous for electrochemical applications like SCs and batteries.30)Fig. 2(e) presents a quantitative analysis of the as-synthesized h-MoO3 and h-MoO3/GO obtained by energy dispersive spectroscopy (EDS). In EDS mapping, the x-axis and y-axis represent the In this graph, the x-axis is energy (keV), and the y-axis counts per second. X-axis represents the energy of X-rays emitted by the sample and the Y-axis represents the counts per second or intensity. Essentially, these axes form a 2D grid that allows visualisation of where specific elements, such as Mo, O, and C in h-MoO3/GO sample, are located. The inset table shows the atomic percentages of h-MoO3 and carbon peaks in the EDS spectrum, corresponding to molybdenum, oxygen, and carbon compounds, respectively. The EDS spectrum confirms the successful formation of the h-MoO3/GO composite. EDS analysis verified that no impurities were present in the composite material.28)
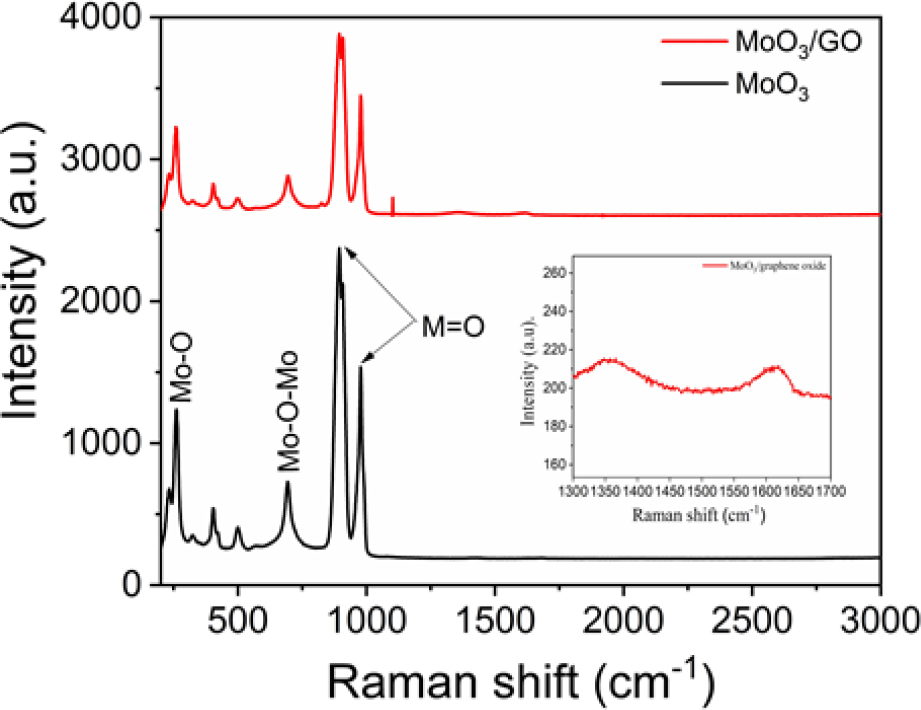
In Fig. 3 Raman spectroscopy investigates the details of the molecular vibration and rotation of h-MoO3/GO and h-MoO3. The peak at 258 cm-1 and the stretching vibrations of oxygen atoms were attributed to the peaks at 894 cm-1 and 977 cm-1. The peaks at 403 cm-1, and 693 cm-1 were attributed to O-Mo-O stretching vibrations. The two characteristics of peak at 1,357 cm-1 and 1,615 cm-1 are attributed to GO corresponding to G and D bands of graphene sheets which is related to vibrations of sp2 hybridized carbon atoms.39) The raman spectrum indicated the formation of a MoO3/GO composite.40)
3.3. Electrochemical analysis
3.3.1. Electrode preparation
To investigate the electrochemical properties of the composites, electrodes were fabricated by blending the active materials, carbon black, and polyvinylidene fluoride (PVDF) in a mass ratio of 80 : 10 : 10. This mixture was uniformly dispersed in N-methyl-2-pyrrolidone (NMP). The prepared slurry was coated on a carbon cloth using a brush, and the electrodes were vacuum-dried at 120 °C for 12 h. Cyclic voltammetry (CV) and galvanostatic charge-discharge (GCD) measurements were performed using Wonatech (WBCS-3000 model) in 1 M H2SO4 with a three-electrode system consisting of h-MoO3/GO as the working electrode, platinum as the counter electrode, and saturated calomel as the reference electrode. Electrochemical impedance spectroscopy (EIS) of the h-MoO3/GO composite was performed using an electrochemical workstation (ZIVE SP5) within a frequency range of 100 kHz to 100 mHz in 1 M H2SO4.
In the three-electrode system, the CV analysis of pure h-MoO3 and its composite h-MoO3/GO was performed in 1 M H2SO4 between the potential window of -0.2 V to 1.2 V at various scan rates ranging from 5 mV/s to 100 mV/s. As shown in Fig. 4(a), the CV curves of h-MoO3 exhibit pseudocapacitive behaviour owing to the apparent redox peaks. The composite also exhibited redox peaks, as shown in Fig. 4(b). The area under the CV curve of the composite material is larger than that of pure h-MoO3, and the specific capacitance is higher than that of pure h-MoO3 because of the high electrical conductivity of graphene, as shown in Fig. 4(c). rapid redox reactions resulted from the close interaction between both components, which enabled charge transport from h-MoO3 to the causing graphene sheets.41) The specific capacitance of the composite material was 108 Fg-1 at a lower scan rate of 5 mV/s, while pure h-MoO3 exhibited a specific capacitance of 77 Fg-1. Because of the electrolyte ions have more time to diffuse through the electrode material when the scan rate is slower, the scan rate increases, and specific capacitance decreases as illustrated in Fig. 4(d).42)
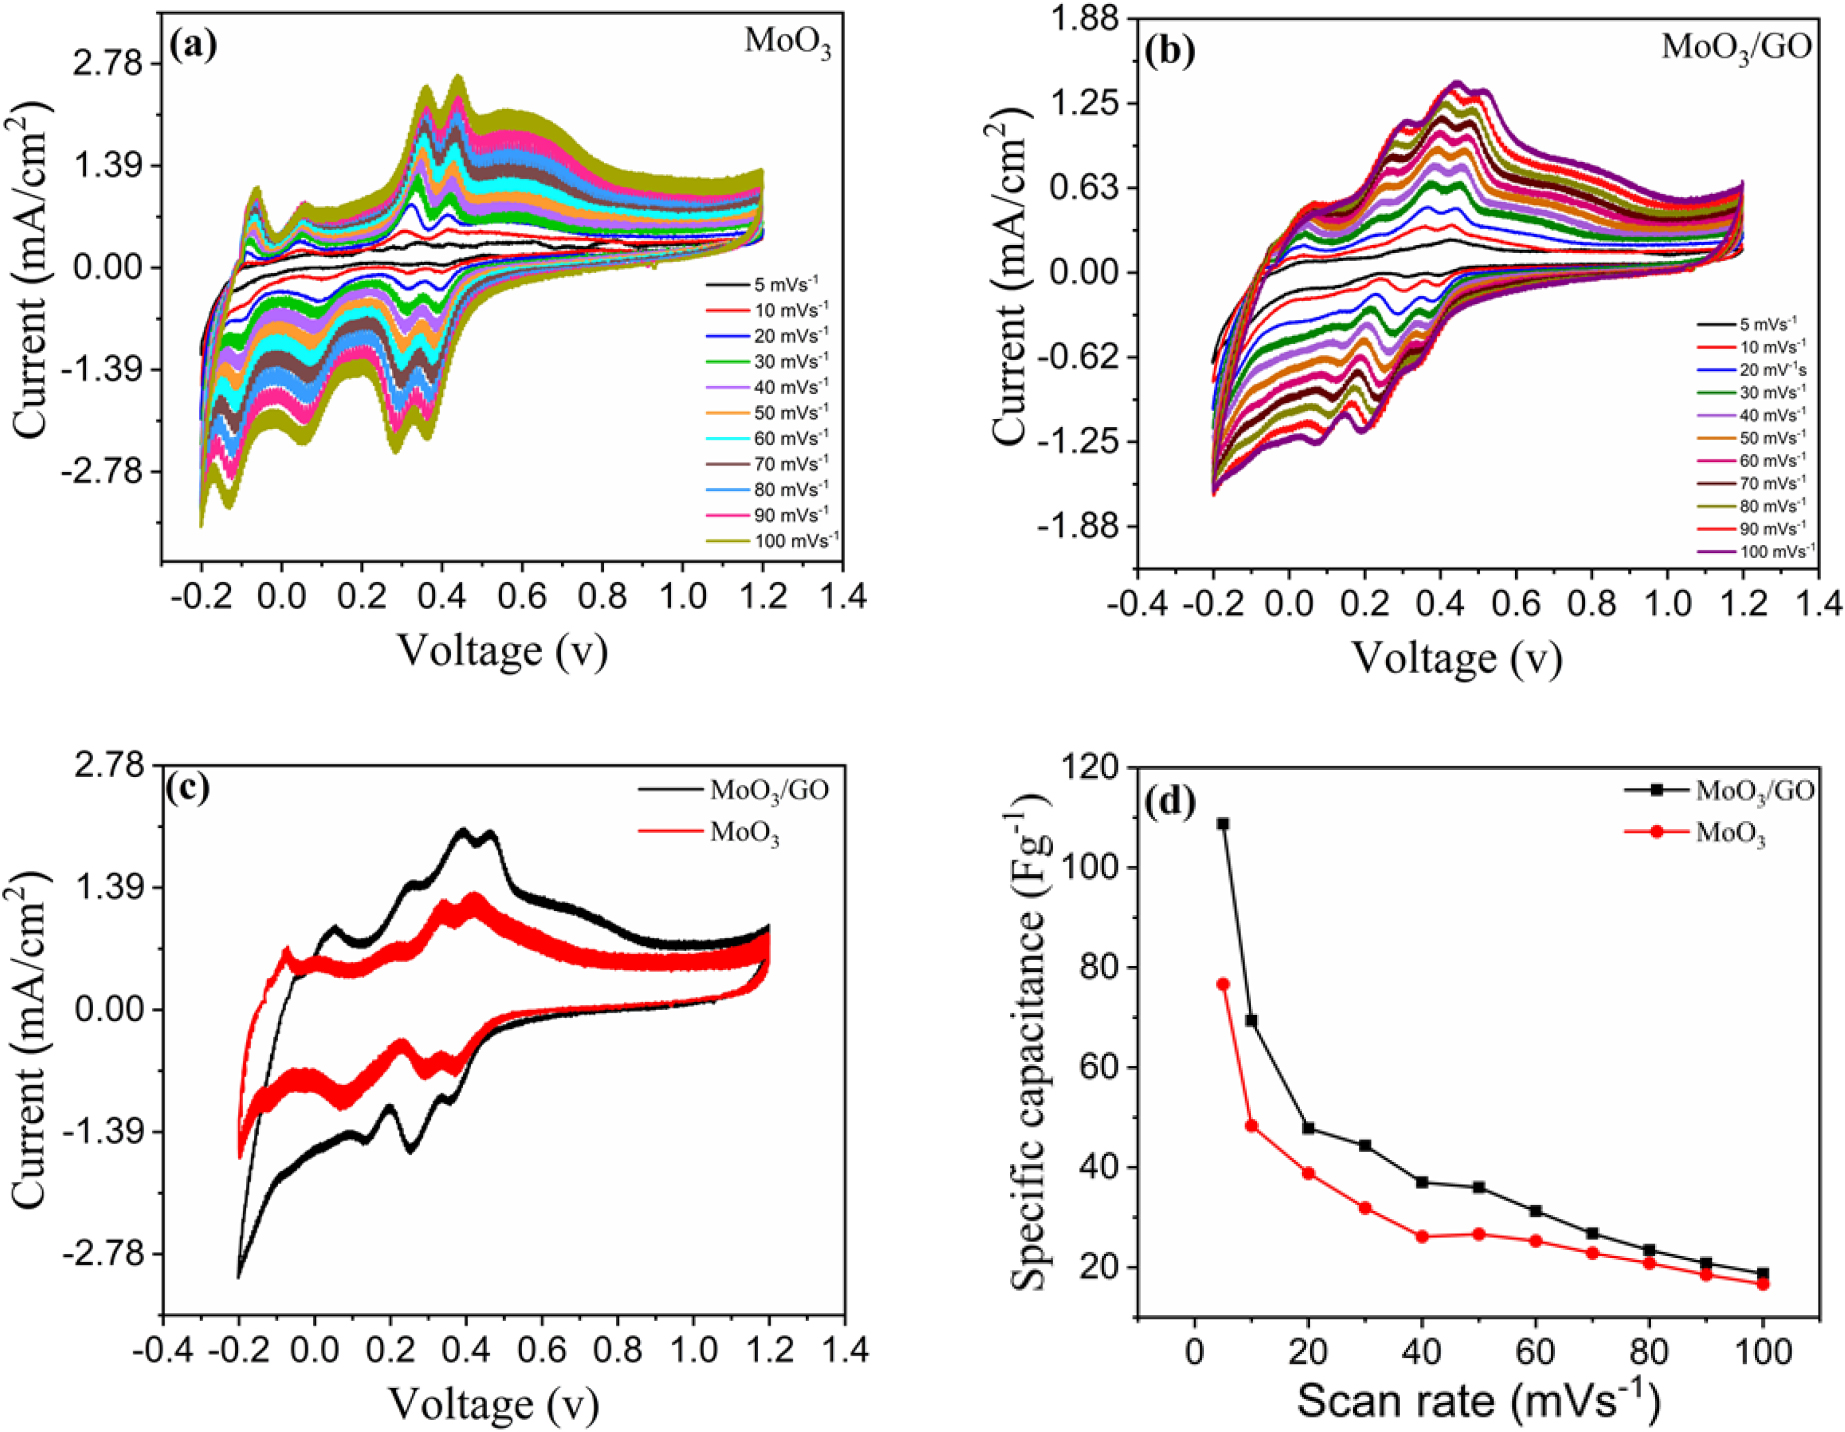
Fig. 5(a, b) show the galvanostatic charge cycles of h-MoO3 and the h-MoO3/GO composite material in 1 M H2SO4. The specific capacitance of the composite electrodes was determined using the charge-discharge curve with the following Eq. (4).
where, I (A) is the discharge current, Δt is the discharge time, ΔV is the potential window, and m is the total mass of deposited active material. The specific capacitance of pure h-MoO3 and h-MoO3/GO was analyzed by charge-discharge cycles at different current densities from 3 mA/cm-2 to 6 mA/cm-2 the specific capacitance of h-MoO3 63 Fg-1 and h-MoO3/GO nanocomposite was 134 Fg-1 at 3 mA/cm-2. The pure h-MoO3 and h-MoO3/GO nanocomposite show a nonlinear charge-discharge curve, which indicates the pseudocapacitive behaviour of the material. The specific capacitance of the h-MoO3/GO composite was higher than that of pure h-MoO3. The reduction in specific capacitance at higher scan rates is primarily caused by the inability to access the electrode surface during rapid charge-discharge cycles and increased ionic resistance.43) Further, the energy density (E.D.) and power density (P.D.) are determined by using the following Eqs. (5) and (6).
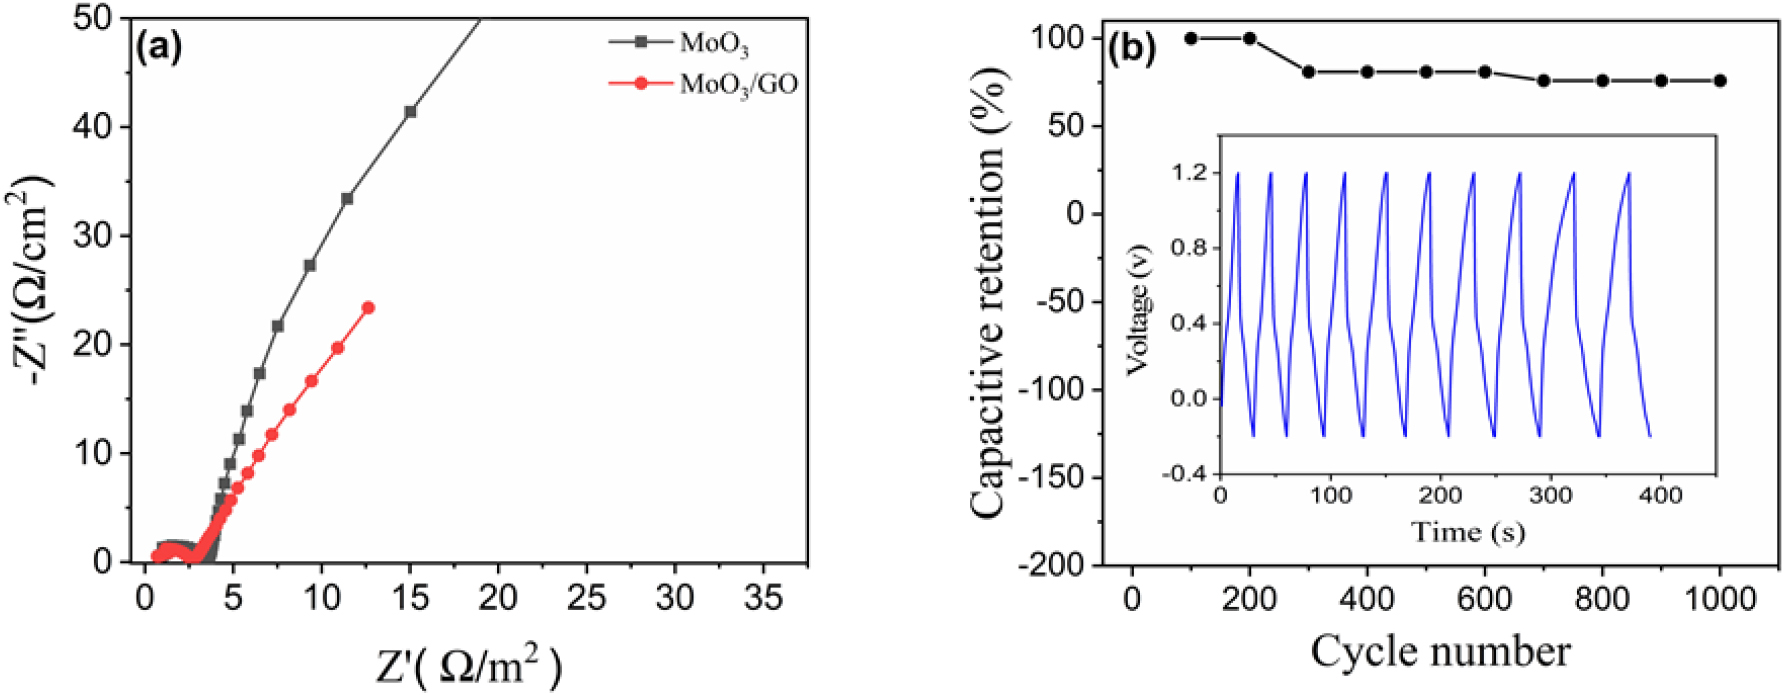
where, E is the specific energy (Wh/kg), P is the specific power (W/kg), Csp is the specific capacitance (F/g), V is the voltage range, and Δt (s) is the discharge time of the cycle.44) The highest energy density of the h-MoO3/graphene composite material was 26.8 Wh/kg and the power density was 560 W/kg at 3 mA/cm-2 respectively. The highest energy density of the h-MoO3/GO composite material is 26.8 Wh/kg, and the power density is 560 W/kg at 3 mA/cm2. In comparison, the energy and power densities of pure h-MoO3 are lower. Fig. 5(d) The specific energy of h-MoO3/graphene composites is higher than that of pure h-MoO3 because of the synergistic effects between the electroactive h-MoO3 and the highly conductive graphene. Fig. 6(b) shows the capacitive retention and cyclic stability of the h-MoO3/GO composite with respect to the cycle number. After 1,000 cycles, 76 % capacitive retention was observed, indicating the good cyclability of the composite material. Integrating graphene into MoO3 electrodes improves the mechanical strength of composite materials because the graphene framework enhances the structural integrity, which leads to better cyclability of the composite material.9)
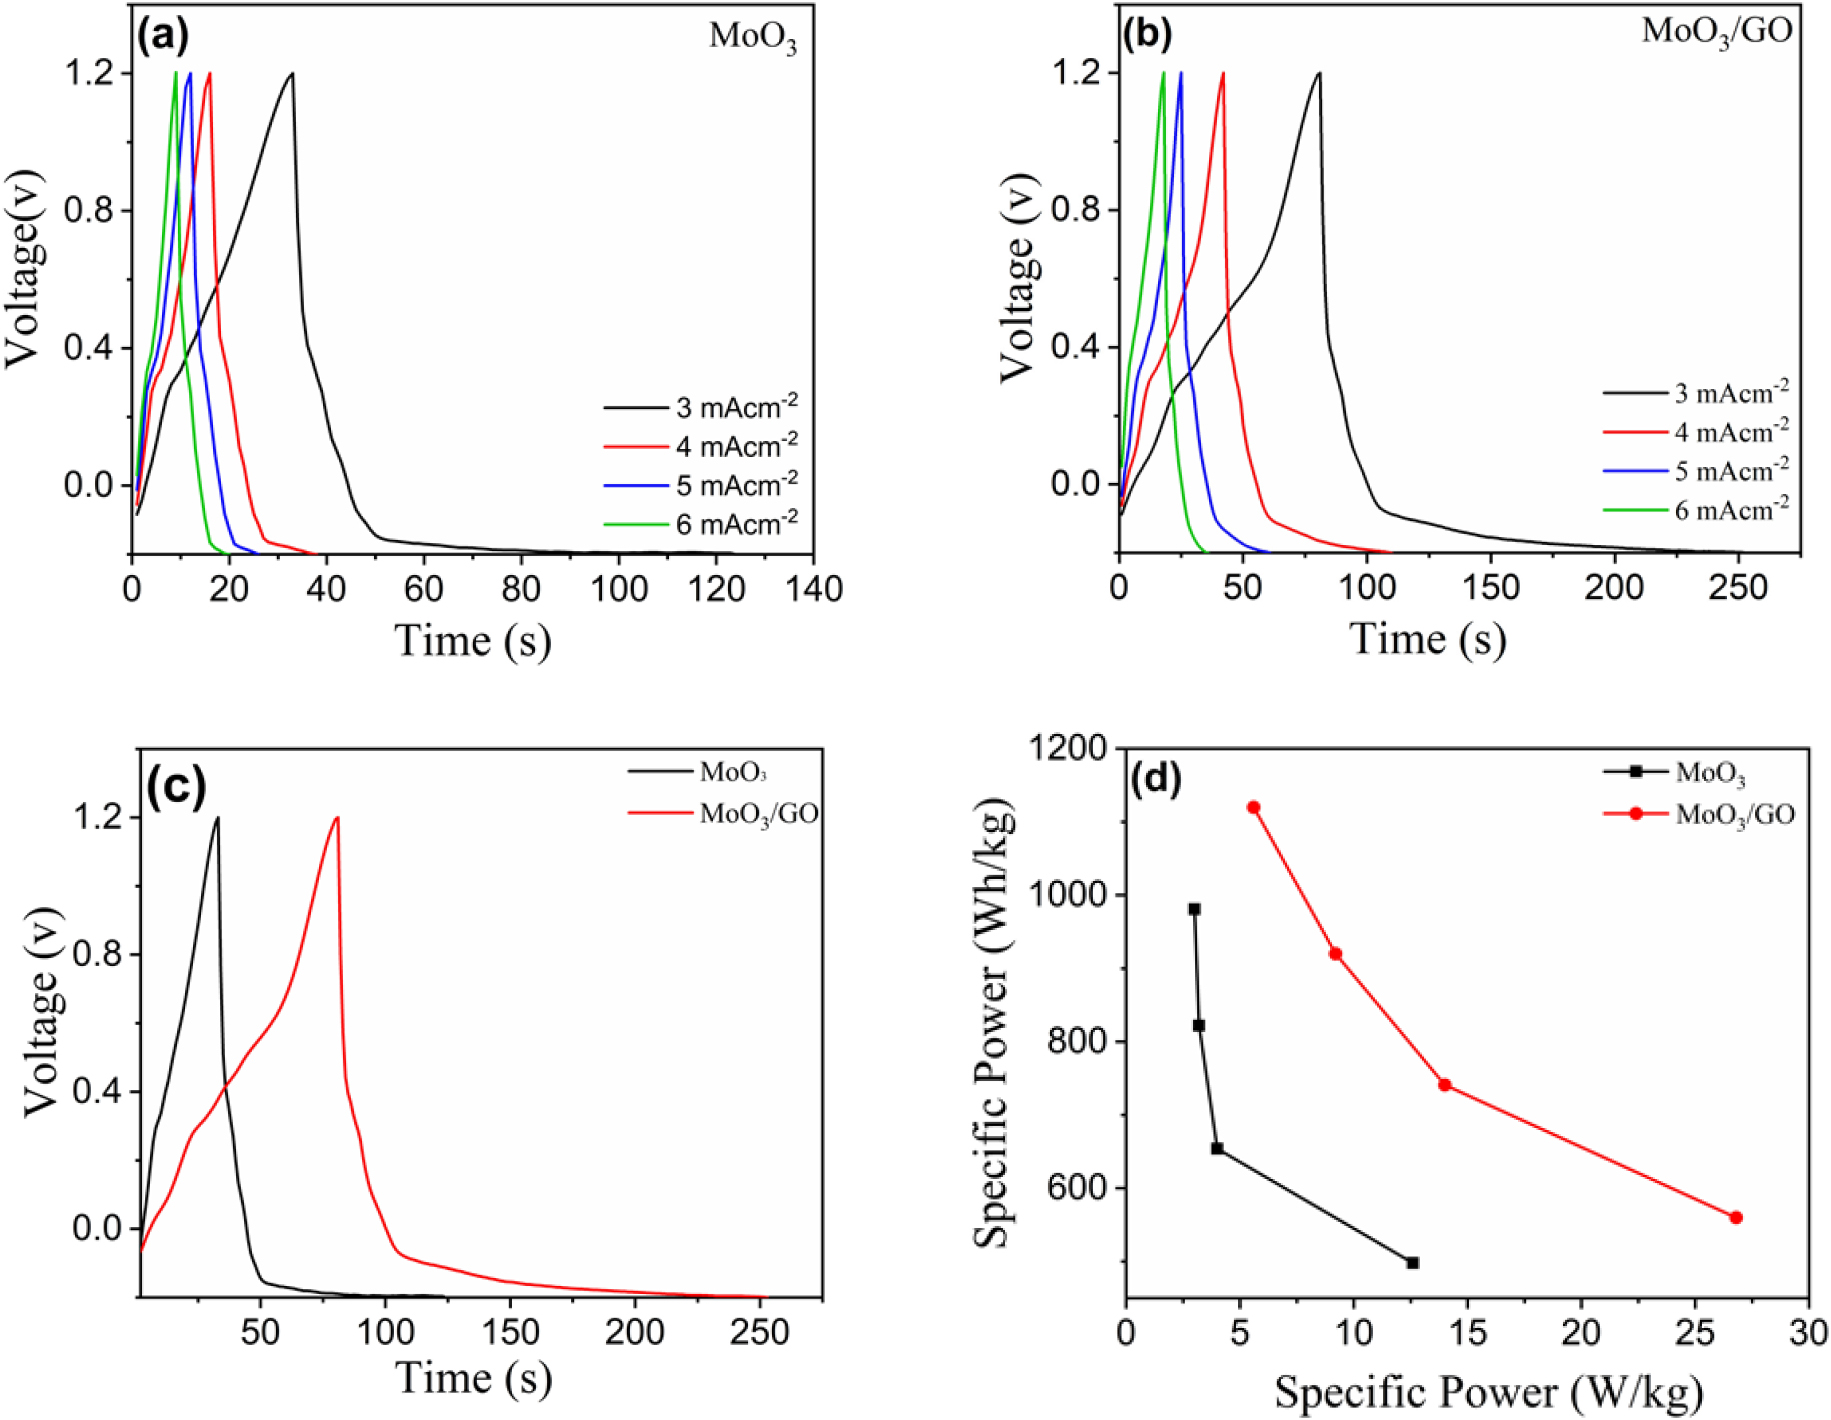
Fig. 6(a) shows the Nyquist plots of the h-MoO3 and h-MoO3/graphene composite electrodes, which show that the Nyquist plots of pure h-MoO3 and h-MoO3/GO composite is composed of semicircles and straight lines, respectively. The impedance studies on the h-MoO3 as well as its composite with h-MoO3/GO are carried out in the frequency range from 10 mHz to 100 KHz. The semicircle in the plot represents the charge-transfer resistance (Rct), which is influenced by the surface area and electrical conductivity the maximum Rct values are 2.5 Ω/cm2 for pure h-MoO3 and 1.9 Ω/cm2 for h-MoO3/GO. The series resistance (Rs) includes the ionic resistance of the electrolyte, electrode material resistance, and contact resistance. The highest Rs values are found to be 0.9 Ω/cm2 for h-MoO3 and 0.7 Ω/cm2 for the h-MoO3/GO composite. The composite material exhibits a lower Rs value compared to pure h-MoO3, indicating better charge transfer characteristics which can be to several factors, including resistance from ion migration through the bulk of the composite, charge resistance within the pores of the material, electrode-electrolyte resistance, and the inherent resistance of the electrode material. Overall, GO proves to be highly conductive support to enhance charge transport and improve the overall electrochemical performance of composite material.43,45,46,47)
4. Conclusion
A simple and low-cost method was used for the synthesis of pure h-MoO3 and h-MoO3/GO composites for supercapacitor applications. The optimized h-MoO3/GO composite exhibited a specific capacitance of 134 Fg-1 with an enhanced rate capability and cyclic stability of 76 % after 1,000 cycles in 1 M H2SO4. This exceptional electrochemical performance is primarily due to the well-designed nanostructures, which create a conductive network that facilitates rapid ion and electron transfer. The superior electrochemical performance of the h-MoO3 GO nanocomposite can be attributed to several factors. These include the enhanced reversible redox reactions of the pseudocapacitive material, the efficient utilization of readily accessible MoO3 species, and the strong interplay between the graphene matrix and the h-MoO3 pseudocapacitive component. These observations lead to the conclusion that this nanocomposite exhibits exceptional electrochemical properties, rendering it a promising candidate for applications in energy storage technologies.
