

1. Introduction
2. Experimental Procedure
2.1. Materials
2.2. Synthesis of the Zn(Mn2-xFex)O4 powders
2.3. Fabrication of the ZMFO cathodes and supercapacitor cells
2.4. Characterization
3. Results and Discussion
3.1. Characterization of the ZMFO powders
3.2. The electrochemical properties of the ZMFO
4. Conclusion
1. Introduction
The demand for, and interest in, energy storage devices has been rapidly increasing. In particular, lithium-ion batteries with high energy density and supercapacitors with excellent power density have established themselves as environmentally friendly, cost-effective, and high-performance energy storage solutions. However, given the wide range of applications in electronic devices, there is a growing need for systems that simultaneously offer both high energy density and high power density. Hence, there has been expanding research on hybrid supercapacitors (HSCs) that combine the fast charging capability of supercapacitors with the high energy density of lithium-ion batteries.1,2) Although lithium-ion-based HSCs have been extensively studied to the point of commercialization, these devices still exhibit significantly lower energy and power densities compared to high-performance batteries or ultra-high-capacity capacitors. Consequently, given the increasing demand for high-capacity, high-power batteries in hybrid and electric vehicles as well as portable electronic devices, there is a critical need to develop HSCs based on earth-abundant materials such as magnesium (Mg), zinc (Zn), and sodium (Na), which can offer lower cost and reduced safety risks compared to lithium-ion systems.2)
Among the metallic ions, zinc ions possess the smallest ionic radius and the highest electrode potential (-0.76 V vs. the standard hydrogen electrode, SHE), which makes them attractive charge carriers that can deliver high efficiency and enhanced safety in aqueous HSCs. Notably, zinc-ion-based energy storage systems (ESSs) have been studied for nearly 200 years and have seen practical application in various electronic devices. Representative examples include Zn-air batteries, Zn-Ni batteries, Zn-Ag batteries, and diverse aqueous Zn-ion batteries. Among the various Zn-based materials, ZnMn2O4 (ZMO) is a typical spinel-structured compound belonging to the I41/amd space group. In the spinel structure, oxygen atoms form a hexagonal close-packed (HCP) lattice that contains both tetrahedral and octahedral frameworks. Within this structure, Zn2+ ions occupy the tetrahedral sites, while manganese (Mn3+) ions reside in the octahedral sites. The interconnected vacant spaces between octahedra form a three-dimensional network that is capable of accommodating guest ion insertion. Due to its low cost, abundant mineral reserves, high safety, and low toxicity, ZnMn2O4 is regarded as a promising cathode material for zinc-ion batteries (ZIBs) and is also being investigated for supercapacitor applications. Unlike typical electric double-layer capacitors (EDLCs), it exhibits a pseudocapacitive energy storage mechanism, which makes it an attractive electrode material for supercapacitor applications.3,4,5,6)
Despite the aforementioned advantages, ZnMn2O4 suffers from capacity fading and reduced electrode lifespan due to the dissolution of Mn species into the electrolyte during charge-discharge cycling. It is well known that Mn2+ ions readily dissolve in the electrolyte, and the extent of Mn2+ dissolution increases with higher concentrations of Mn3+ within the spinel structure.7) Therefore, it is expected that these issues might be addressed by substituting Mn3+ with other ions in order to modulate the lattice parameters of the spinel structure. Various studies have investigated this approach and reported that doping with transition metals such as Fe or Ni can improve both the electrode capacity and cycle life.8,9,10,11) However, previous studies have largely been limited to examining the effects of small amounts of transition-metal doping. In particular, there is a lack of research systematically investigating the changes in electrochemical properties due to compositional variation when substituting Mn with Fe.
In the present study, Zn(Mn2-xFex)O4 (ZMFO) powders were synthesized by varying the mixing ratio of Mn and Fe precursors in order to investigate the compositional dependence and corresponding changes in material properties. Electrodes for HSCs are fabricated using the as-synthesized powders, and their electrochemical performance is systematically evaluated. The powders prepared by the solid-state reaction method have a large particle size, and uniform substitution of Fe is difficult. Additionally, the formation of localized secondary phases is likely; therefore, the hydrothermal synthesis method was employed. In addition, the Zn(Mn2-xFex)O4 powder synthesized by the hydrothermal method exhibited low crystallinity and contained multiple secondary phases; therefore, a calcination process was carried out. Key synthesis parameters, such as reaction temperature and post-synthesis calcination temperature, are carefully optimized in order to determine the most favorable conditions for the fabrication of high-performance electrodes for HSCs.
2. Experimental Procedure
2.1. Materials
Stainless steel foils (0.01 mm thickness) were purchased from MTI, USA. Zinc nitrate hexahydrate (Zn(NO3)2・6H2O), potassium permanganate (KMnO4), Iron(III) nitrate nonahydrate (Fe(NO3)3・9H2O) were purchased from Sigma-Aldrich. All chemical reagents were analytical grade. The deionized (DI) water was used throughout the whole experiment.
2.2. Synthesis of the Zn(Mn2-xFex)O4 powders
The synthesis of the Zn(Mn2-xFex)O4 (x = 0, 0.4, 0.8, 1.2, and 1.6) powders is shown schematically in Fig. 1. In this procedure, the molar concentration of Zn(NO3)2・6H2O was fixed at 0.024 mol, and the amounts of KMnO4 and Fe(NO3)3・9H2O were adjusted accordingly to obtain the desired compositions. The detailed precursor ratios are listed in Table 1. The weighed precursors were dissolved in 75 mL of DI water, followed by the addition of 2 mL of H2SO4. The solution was stirred magnetically for approximately 30 min. The resulting mixture was then subjected to hydrothermal synthesis at 185 °C for 3.5 h. The synthesized powders were washed alternately with water and ethanol three times via centrifugation, and subsequently dried in an oven at 60 °C for at least 12 h. The dried ZMFO powders were then calcined at 600 °C for 3 h with a ramp rate of 2 °C/min. Finally, the calcined powders were ground and sieved to obtain particles with sizes below 300 µm.
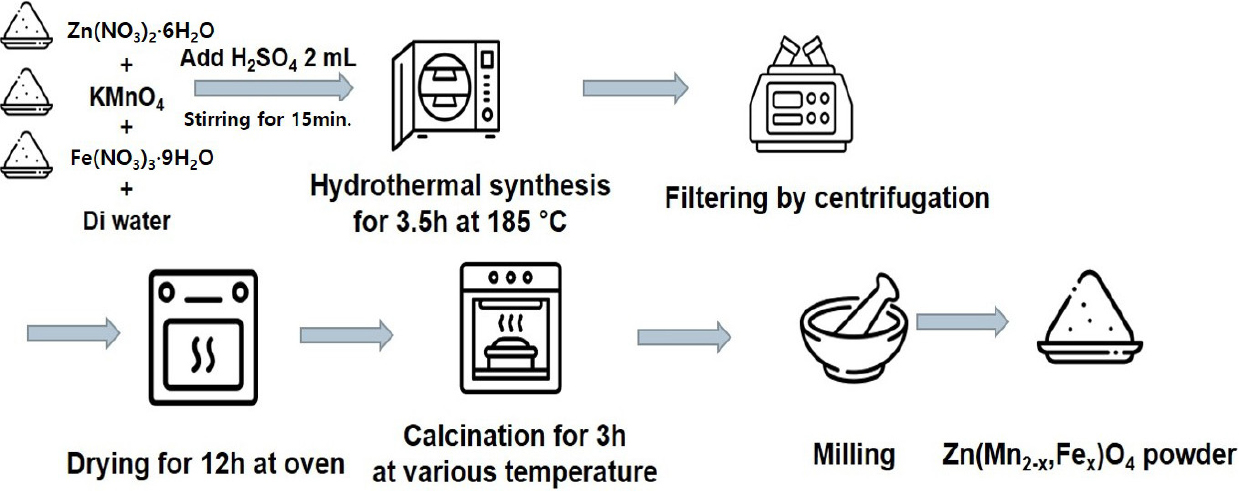
Table 1.
The precursor ratios used for the synthesis of the various Zn(Mn2-xFex)O4 samples.
2.3. Fabrication of the ZMFO cathodes and supercapacitor cells
The positive electrodes were prepared by mixing the ZMFO powders, polyvinylidene difluoride (PVDF), and carbon black in an 8:1:1 weight ratio. To fabricate the electrode slurry, PVDF was first dissolved in N-methyl-2-pyrrolidone (NMP), followed by sequential addition of carbon black and ZMFO powder. The mixture was stirred at 1,700 rpm for 30 min using a mixer (AR-100, THINKY, Japan). The resulting slurry was cast onto stainless steel current collectors by using a doctor blade and maintaining a wet film thickness of 300 µm. The coated electrodes were dried at 60 °C for 12 h in an oven (JSOF-100, JSR, Korea). After drying, the electrode thickness, including the current collector, contracted to approximately 100 µm. For three-electrode measurements, the electrodes were cut into 2 × 3 cm2 pieces. For coin cell assembly, positive electrodes were punched into 12-mm diameter discs, and negative electrodes with graphite coated on Cu foil (MTI, USA) were cut into 15-mm diameter discs. The coin cells were assembled using the ZMFO as the positive electrode, graphite as the negative electrode, and a glass fiber filter (Whatman GF/D) as the separator.
2.4. Characterization
The crystal structure and morphology of the as-synthesized ZMFO powders were analyzed via X-ray diffraction (XRD; X’Pert PRO MRD, PANalytical, Netherlands) and field emission scanning electron microscopy (FE-SEM; 8230U, Hitachi, Japan), respectively. Compositional analysis was performed via energy dispersive X-ray spectroscopy (SEM-EDS) and X-ray photoelectron spectroscopy (XPS; NEXSA, ThermoScientific, USA). For the three-electrode electrochemical measurements, the prepared ZMFO electrode served as the working electrode, a platinum wire as the counter electrode, and an Ag/AgCl electrode as the reference electrode. All measurements were conducted using a potentiostat (VersaStat 3, AMETEK Princeton Applied Research, USA). The electrochemical performance of the HSC coin cells was evaluated using an 8-channel battery analyzer (BST8-MA, MTI, USA). The cyclic voltammetry (CV) measurements were performed at scan rates ranging from 1 to 10 mV/s within a potential window of 0 to 0.8 V.
3. Results and Discussion
3.1. Characterization of the ZMFO powders
As detailed above, a calcination process was performed after hydrothermal synthesis to promote the formation of the ZMFO phase. The powders that were calcined at 400-600 °C are seen to retain a spherical morphology, whereas those treated at temperatures above 700 °C exhibit sintering effects due to the elevated furnace temperature, which results in the formation of necks and elongated rod-like shapes. The FE-SEM images of the Zn(Mn2-xFex)O4 (x = 0.4, 0.8, 1.2, and 1.6) powders that were calcined at 600 °C are presented in Fig. 2(a-d), where each powder exhibits an aggregated spherical morphology. Further, the elemental mapping analysis of the as-calcined Zn(Mn1.2Fe0.8)O4 powder in Fig. 2(e) confirms the uniform distribution of Zn, Mn, Fe, and O elements, with the Mn and Fe ratios remaining within the designed compositional ranges set during synthesis. Table 2 shows the Mn/Fe ratios of the synthesized Zn(Mn2-xFex)O4 powders obtained from EDS analysis.
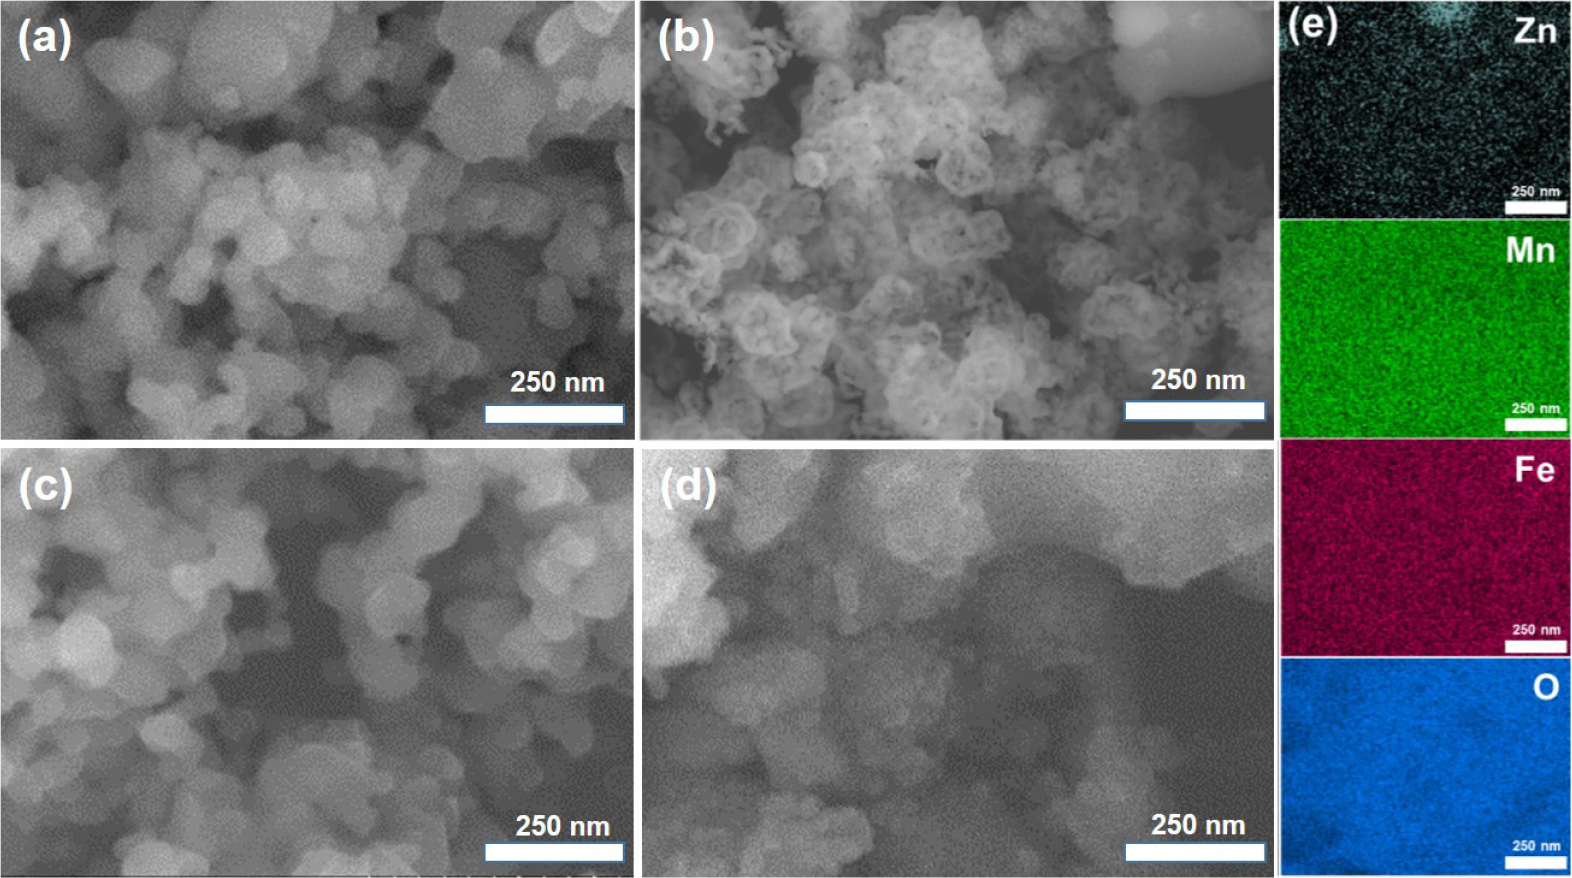
Table 2.
The Mn/Fe ratios of the synthesized Zn(Mn2-xFex)O4 powders obtained from EDS analysis.
| Sample | Zn(Mn0.4Fe1.6)O4 | Zn(Mn0.8Fe1.2)O4 | Zn(Mn1.2Fe0.8)O4 | Zn(Mn1.6Fe0.4)O4 |
| Mn/Fe ratio | 0.36 | 1.08 | 1.74 | 3.30 |
The XRD patterns of the Zn(Mn1.2Fe0.8)O4 powders that were calcined at various temperatures are presented in Fig. 3(a). While no ZMFO phase is detected at 400 °C, weak peaks begin to appear at 500 °C, and well-defined ZMFO phases are observed in samples that were calcined at temperatures of 600 °C. When the samples were calcined above 700 °C, the main diffraction peaks of ZMFO were significantly reduced or disappeared, which is attributed to the instability of the spinel structure caused by the volatilization of low-melting-point elements (e.g., Zn) at excessively high temperatures. Meanwhile, the XRD patterns of the as-synthesized (pre-calcination) samples with various compositions are presented in Fig. 3(b), where the absence of any ZnMn2O4 peaks indicates that the hydrothermal synthesis yielded only MnO2 and Fe2O3 phases. By contrast, all of the samples that were calcined at 600 °C [Fig. 3(c)] display characteristic ZnMn2O4 peaks. Notably, the intensity of the ZnMn2O4 diffraction peaks decreases with increasing Fe content, while the intensity of Fe2O3 peaks progressively increases. This suggests that Fe3+ ions initially substitute for Mn3+ in the spinel lattice, but when the Fe content exceeds the solubility limit, excess Fe precipitates as a secondary Fe2O3 phase. Additionally, the diffraction patterns in the 30°-35° region [Fig. 3(d)] show that the peak corresponding to the (103) crystal plane of ZnMn2O4 systematically shifts toward higher angles with increasing Fe content. This shift is attributed to lattice contraction resulting from the smaller ionic radius of Fe3+ (0.63 Å) compared to Mn3+ (0.65 Å), and is consistent with a previous report.12) The surface elements and chemical valence states of the ZnMn2O4 and Zn(Mn1.2Fe0.8)O4 powders that were calcined at 600 °C are revealed by the XPS results in Fig. 4. First, the corresponding full survey spectra in Fig. 4(a) and (b) reveal the presence of Zn 2p, Mn 2p, Fe 2p, and O 1s signals, thereby indicating the mixed oxide composition of manganese, iron and zinc. The high-resolution Zn 2p spectra of the two powders are presented in Fig. 4(c), where Zn 2p1/2 and Zn 2p3/2 peaks are observed at 1044.48 and 1021.38 eV, respectively, for the ZnMn2O4 (lower panel), and at 1044.78 and 1021.68 eV, respectively, for the Zn(Mn1.2Fe0.8)O4 (upper panel). These results confirm that Zn in both powders exists within a stable binding energy range. Additionally, both samples exhibit a consistent Zn 2p1/2 and Zn 2p3/2 spin-orbit splitting of 23.1 eV, which is in good agreement with the values reported for pristine ZnMn2O4 and for transition-metal doped ZnMn2O4 in previous studies.12,13,14,15,16,17,18) Meanwhile, the high-resolution Mn 2p spectra in Fig. 4(d) exhibit Mn 2p1/2 and Mn 2p3/2 peaks at 653.88 and 642.28 eV, respectively, for the ZnMn2O4 (lower panel), and at slightly lower binding energies of 653.48 and 642.18 eV, respectively, for the Zn(Mn1.2Fe0.8)O4 (upper panel). This shift can be attributed to the presence of a greater number of oxygen defects being generated in the Zn(Mn1.2Fe0.8)O4 than in the ZnMn2O4 during oxide synthesis. Moreover, this decrease in binding energy suggests a decrease in the average number of oxygen atoms coordinated around Mn, which is consistent with previous reports.12,13,14,19) For the Zn(Mn1.2Fe0.8)O4 powder, the Fe 2p spectrum in Fig. 4(e) shows peaks corresponding to both Fe2+ and Fe3+ species, including their satellite features. Analysis indicates that Fe3+ is the dominant oxidation state, while Fe2+ is also present in significant amounts. Quantitatively, the surface Fe in Zn(Mn1.2Fe0.8)O4 comprises 36.1 % Fe2+. These results support the intended substitution of Mn3+ sites by Fe3+ in the spinel structure. Meanwhile, the O 1s spectra of the two powder samples are presented in Fig. 4(f), where deconvolution distinguishes between the contributions of lattice oxygen and oxygen defects. Specifically, the metal-oxygen (M-O) bonding peak appears near 530 eV, while the oxygen defect peak is observed at 531.6 eV. Notably, the Zn(Mn1.2Fe0.8)O4 (upper panel) exhibits a larger area for the 531.6 eV peak compared to the ZnMn2O4 (lower panel), thereby indicating a higher concentration of oxygen defects in the former. The XPS analysis results showed that oxygen defects were formed in all Zn(Mn2-xFex)O4 samples, and the amount of oxygen defects tended to increase as the Fe content increased.
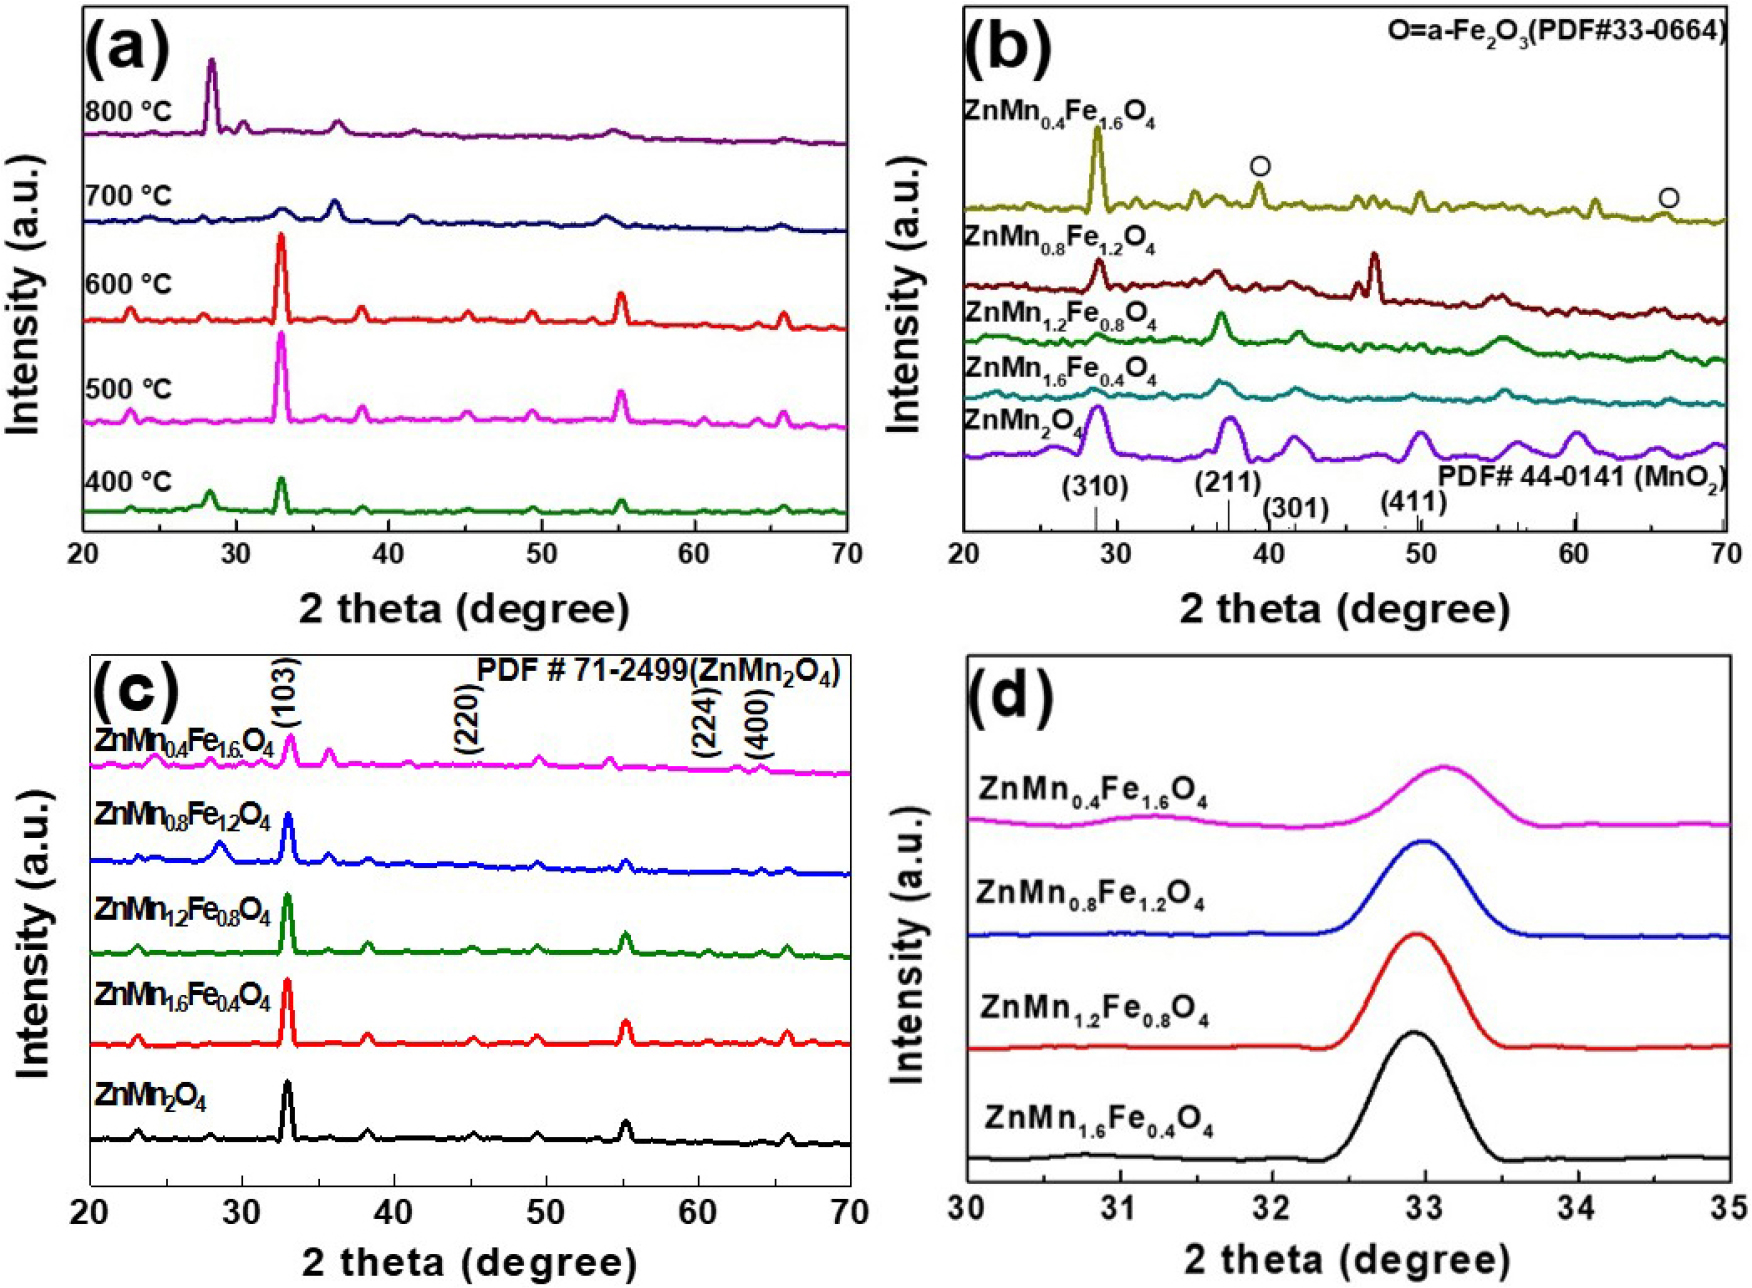
Fig. 3.
(a) The XRD patterns of the Zn(Mn1.2Fe0.8)O4 powders that were calcined at various temperatures. (b, c) The XRD patterns of the various Zn(Mn2-xFex)O4 powders (x = 0, 0.4, 0.8, 1.2, and 1.6) before (b) and after (c) calcination at 600 °C. (d) The shift in the highest intensity peak in the XRD patterns of the Zn(Mn2-xFex)O4 powders, corresponding to the (103) crystal plane of ZnMn2O4.
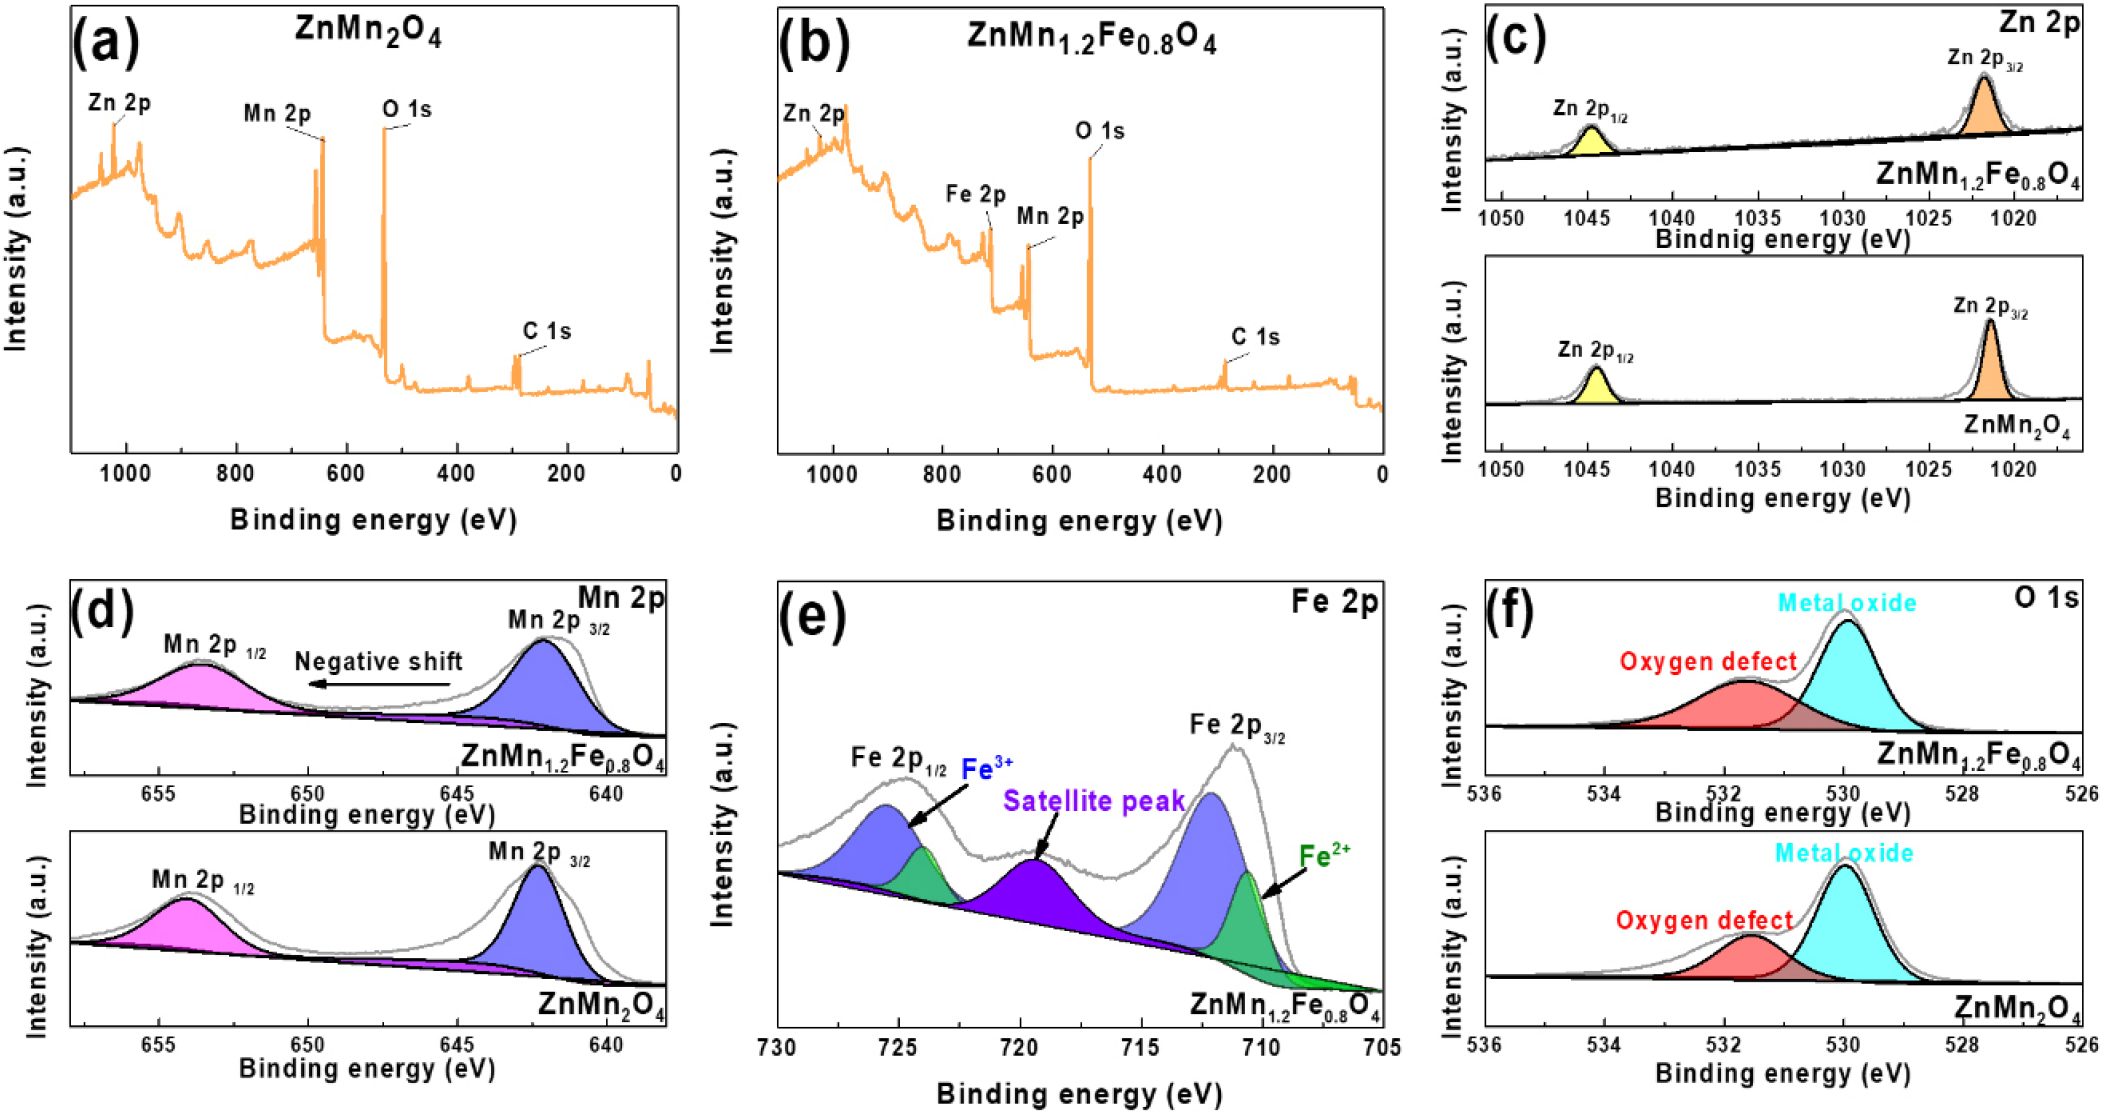
Fig. 4.
(a, b) The full XPS spectra of (a) the ZnMn2O4 and (b) the Zn(Mn1.2Fe0.8)O4 powders. (c-f) The corresponding high-resolution Zn 2p (c), Mn 2p (d), Fe 2p (e), and O 1s (f) XPS spectra. In (c), (d), and (f), the upper panels represent the Zn(Mn1.2Fe0.8)O4 and the lower panels represent the ZnMn2O4.
These defects correspond to oxygen vacancies (), which are likely formed via the following reaction facilitated by Fe2+:
where represents Fe substituting for Mn. An appropriate level of oxygen vacancies has been reported to reduce the ion migration energy barrier and facilitate ion diffusion, thereby enhancing the electrochemical performance of electrode materials.12,13,18)
3.2. The electrochemical properties of the ZMFO
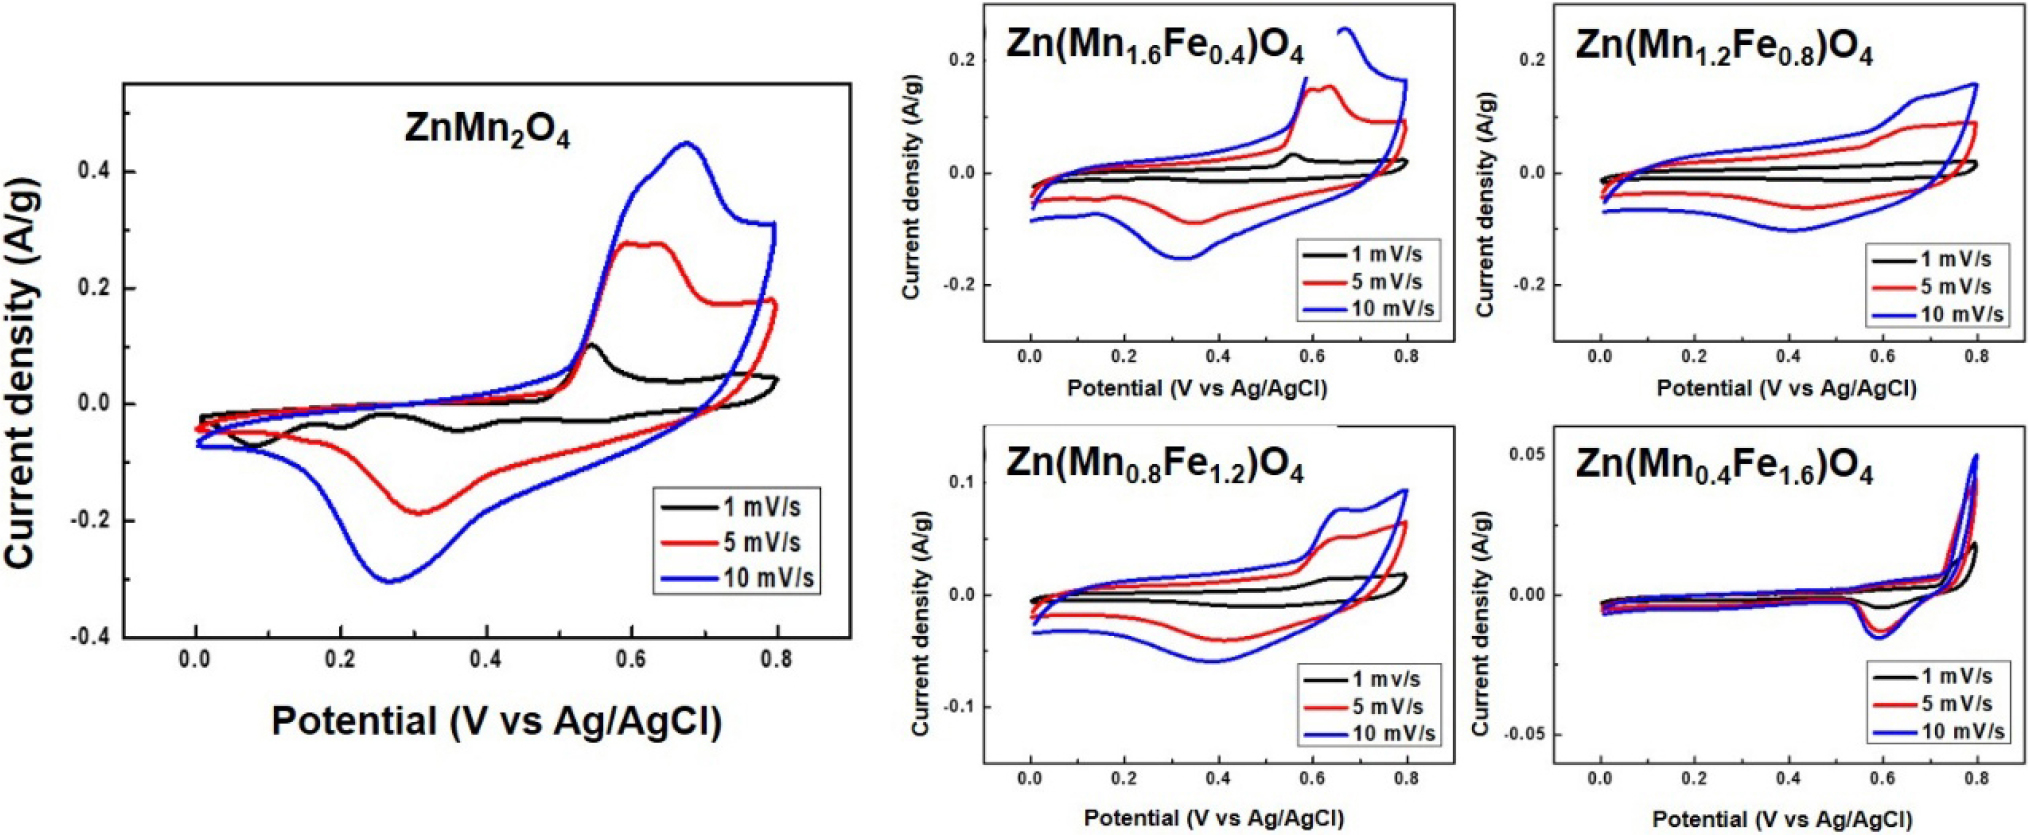
The CV curves of the Zn(Mn1.6Fe0.4)O4, Zn(Mn1.2Fe0.8)O4, Zn(Mn0.8Fe1.2)O4, and Zn(Mn0.4Fe1.6)O4 samples that were calcined at 600 °C are presented in Fig. 5. Here, all samples exhibit clear redox peaks, thereby indicating good electrochemical activity. A comparison of the CV curves reveals that while an increase in the Fe content leads to a reduction in the overall enclosed area, the curves maintain their shape even at higher scan rates, thereby demonstrating good rate capability. The asymmetric shape of each CV curve suggests a pseudocapacitive energy storage mechanism in each electrode.
To investigate the kinetics of the electrochemical reactions of ZMFO, the current contributions were estimated using Eq. (2)20,21,22):
where a and b are variable parameters, v is the potential scan rate (V/s) and the b-value represents surface-controlled (b = 1) and diffusion-controlled (b = 0.5) mechanisms. The b-values were calculated from the current response at 0.5 V in the CV curves, and the resulting values were plotted against Fe content in Fig. 6(a). Here, the b-value reached a maximum of 0.811 for the Zn(Mn1.2Fe0.8)O4, and then decreases with further Fe addition. This suggests that Zn(Mn1.2Fe0.8)O4 exhibits the most favorable mechanism for supercapacitor applications, where energy storage is dominated by surface-controlled redox reactions and ion transport, whereas excessive Fe substitution results in a shift toward the typical diffusion-controlled energy storage mechanisms of battery electrodes. Although such diffusion-controlled storage can offer higher capacity, it often leads to poor rate capability and structural instability due to ion insertion and extraction deep within the electrode. For supercapacitor applications, which demand fast charge-discharge and high power performance, surface-driven ion transport and redox reactions are more desirable.
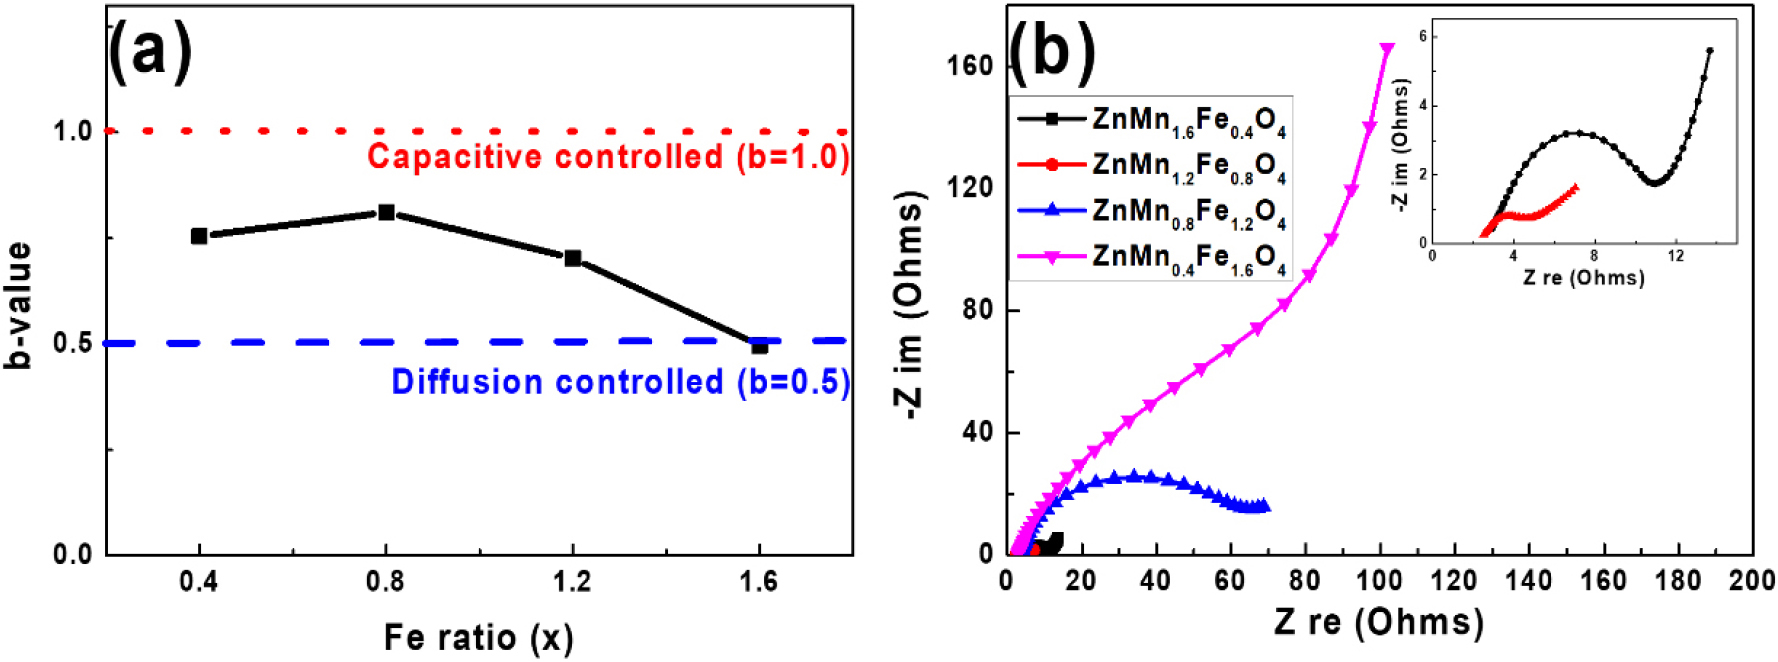
The electrochemical impedance spectroscopy (EIS) analysis of the various ZMFO samples is presented in Fig. 6(b). Each spectrum exhibited a half semicircle and linear behavior in the high- and low-frequency regions. The semicircular portion represents the electrolyte resistance (Rbulk) and charge-transfer resistance (Rct), while the linear part corresponds to the Warburg impedance. These results indicate that while the various samples exhibit similar bulk resistance (Rbulk) values, the Zn(Mn1.2Fe0.8)O4 exhibits the lowest charge transfer resistance (Rct), thereby indicating optimal electrochemical behavior. Increasing the Fe content beyond this level leads to higher Rct values, which is likely due to the increased formation of electrically-insulating Fe2O3 secondary phases.
The charge-discharge profiles at a current density of 0.1 A/g for the Zn(Mn1.2Fe0.8)O4 samples that were synthesized at various calcination temperatures are presented in Fig. 7(a). Unlike EDLCs, these electrodes exhibit asymmetric charge-discharge characteristics, which can be interpreted as indicating hybrid capacitor behavior. These charge-discharge profiles were used to calculate the capacitance (C) of the Zn(Mn1.2Fe0.8)O4 electrodes (unit: F/g) as a function of calcination temperature by using Eq. (3):
where ΔV is the voltage window (V), m is the mass in grams (g) of active material in the electrode, q is the total charge in coulombs (C), i is the applied current in amps (A), and t is the discharge time (s). Thus, the specific capacitances of the Zn(Mn1.2Fe0.8)O4 samples that were calcined at 400, 500, 600, 700, and 800 °C were calculated to be 96, 135, 374, 209, and 249 F/g, respectively (Table 3). These results indicate that the sample calcined at 600 °C exhibits the highest capacitance. Table 4 shows the previously reported electrochemical properties of ZnMn2O4 electrodes for supercapacitors. The specific capacitance exhibits a wide range of values depending on the synthesis method and morphology.
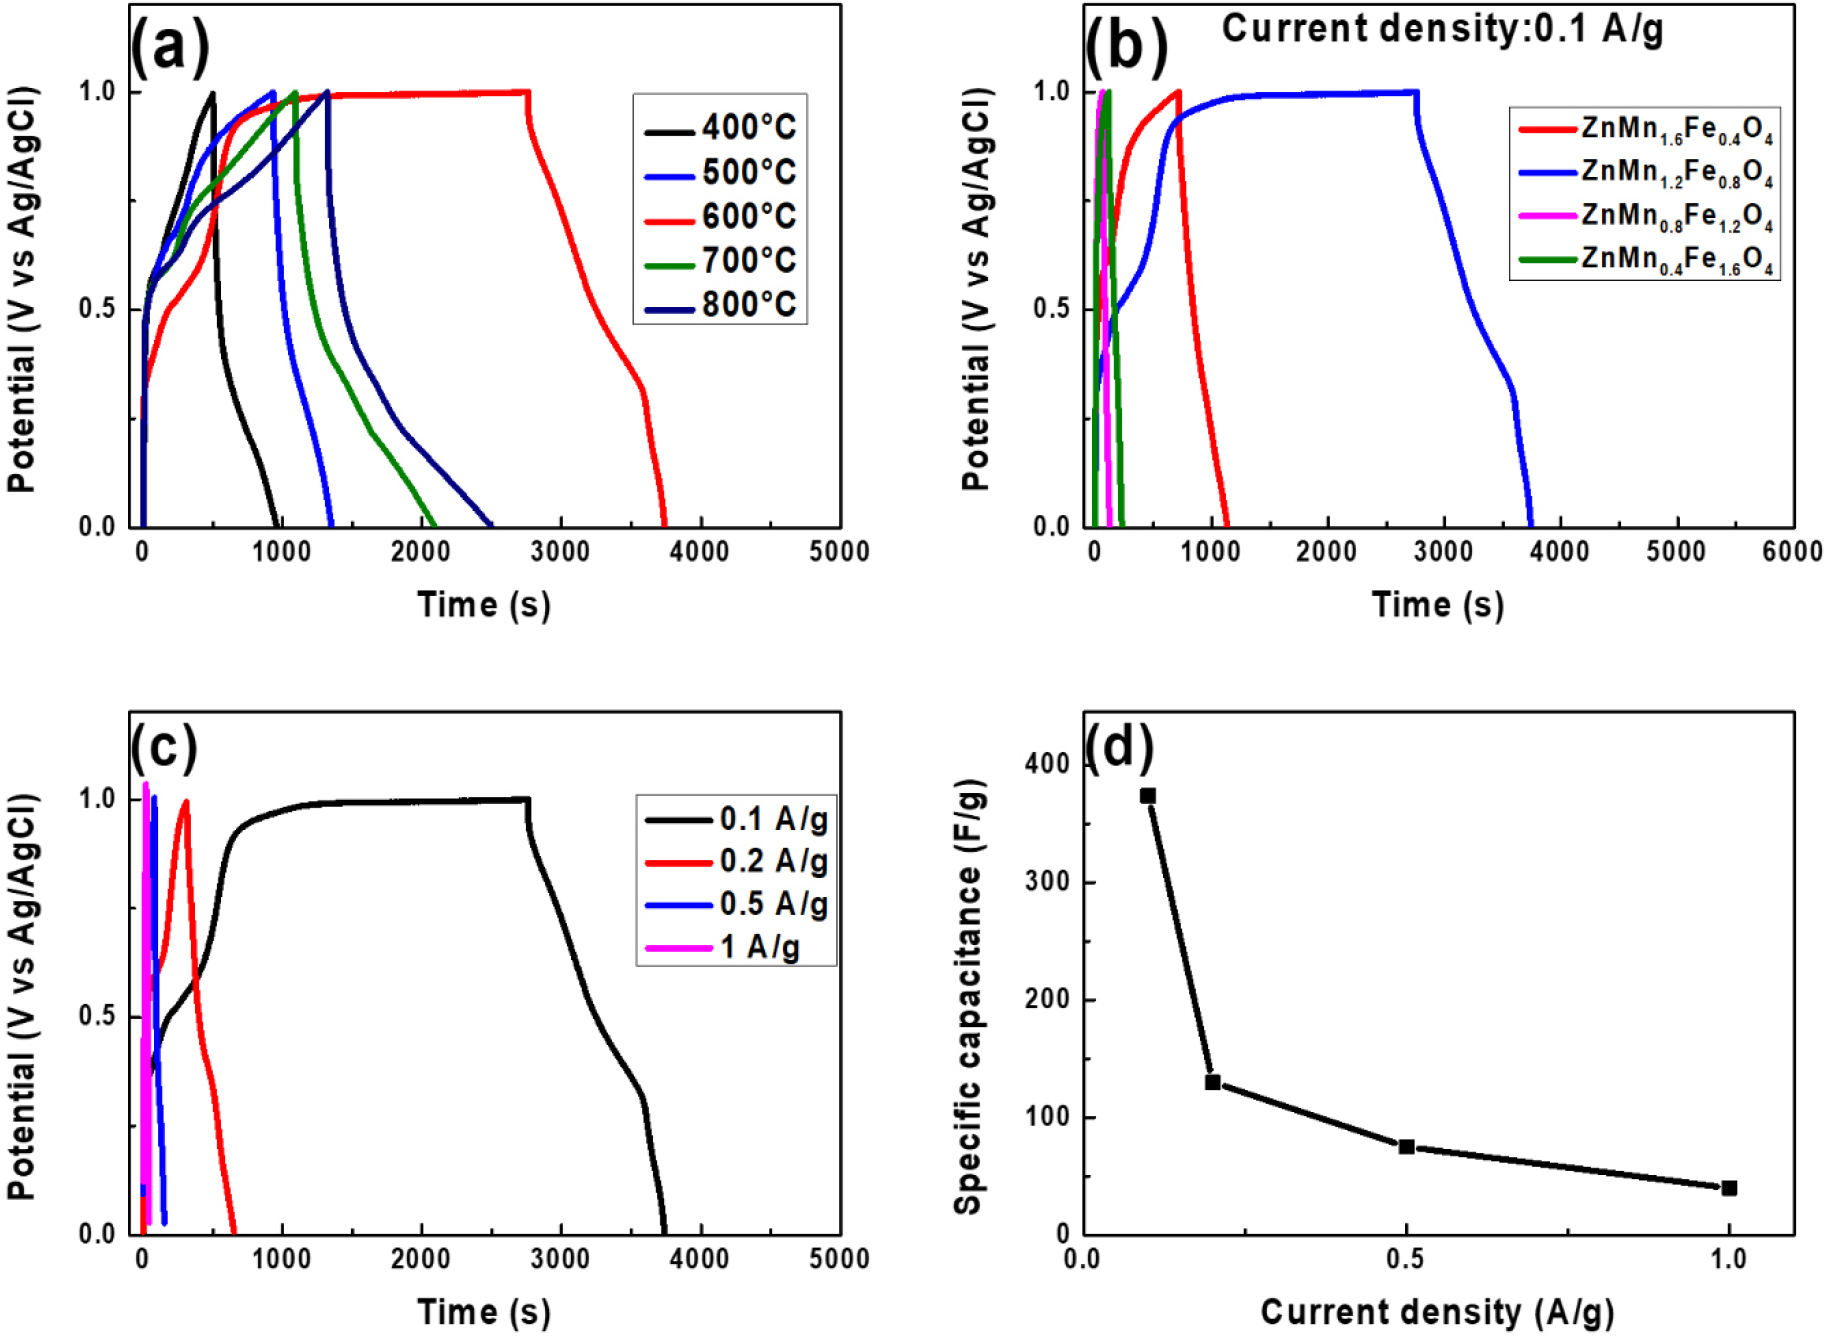
Fig. 7.
(a, b) The charge-discharge profiles at a current density of 0.1 A/g for (a) the Zn(Mn1.2Fe0.8)O4 synthesized at various calcination temperatures and (b) the Zn(Mn2-xFex)O4 samples (x = 0.4, 0.8, 1.2, and 1.6) that were calcined at 600 °C. (c) The charge-discharge curves under various current densities for the Zn(Mn1.2Fe0.8)O4 sample that was calcined at 600 °C. (d) A plot of specific capacitance versus current density for the Zn(Mn1.2Fe0.8)O4 sample.
Table 3.
Specific capacitance of Zn(Mn1.2Fe0.8)O4 samples that were synthesized at various calcination temperatures at a current density of 0.1 A/g.
| Calcination temperature (°C) | 400 | 500 | 600 | 700 | 800 |
| Specific capacitance (F/g) | 96 | 135 | 374 | 209 | 249 |
Table 4.
Electrochemical characterization of ZMO and MnO2 in supercapacitors.
| Preparation Method | Morphology | Electrolyte | Capacitance (F/g) | Retention (cycles) | Reference |
| Hydrothermal | Microspheres | KOH | 155 at 2 mV s-1 | 99 % (1,100) | 23) |
| Cd-doped ZMO | KOH | 364 at 2 mV s-1 | - | 24) | |
| Precipitation | Pomengranate-like | KOH | 447 at 1 A g-1 | 52 % (800) | 25) |
| Nanoparticles | KOH | 545 at 1 A g-1 | - | 26) | |
| Combustion | Composite with carbon | KOH | 119 at 0.3 A g-1 | 97 % (5,000) | 27) |
| Composite with carbon | KOH | 122 at 0.3 A g-1 | 90 % (5,000) | 28) | |
| Hydrothermal | Carbon/MnO2 Composites | Na2SO4 | 60.3 at 1.0 A g-1 | 99.6 % (5,000) | 29) |
| MnO2 nanowire | Na2SO4 | 180 at 1.0 A g-1 | 78 % (2,000) | 30) |
The charge-discharge profiles at a current density of 0.1 A/g for the Zn(Mn2-xFex)O4 electrodes (with x = 0.4, 0.8, 1.2, and 1.6) that were calcined at 600 °C are presented in Fig. 7(b). These results confirm that Fe additions of up to x = 0.8 improve the electrochemical performance, but excessive Fe doping beyond this level leads to increased formation of insulating Fe2O3 phases, thereby reducing the electrical conductivity and compromising the electrode performance. Consequently, the Zn(Mn1.2Fe0.8)O4 sample exhibits the highest specific capacitance of approximately 374 F/g, thereby suggesting that this represents the optimal doping level. Further, the results in Fig. 7(c) and (d) indicate that the Zn(Mn1.2Fe0.8)O4 electrode exhibits specific capacitance values of 374, 130, 75, and 40 F/g at current densities of 0.1, 0.2, 0.5, and 1 A/g, respectively. This trend reflects the typical decrease in discharge time (and thus storage capacity) with increasing current density, which can be attributed to limited ion diffusion into the deeper regions of the electrode at higher charge-discharge rates. Notably, the samples maintain stable discharge profiles even at 1 A/g, thereby indicating good rate capability.
The charge-discharge curves of a HSC coin cell containing the Zn(Mn1.2Fe0.8)O4 electrode at current densities of 0.1, 0.2, 0.5, and 1 A/g are presented in Fig. 8(a). Here, the symmetrical shapes indicate pseudocapacitive behavior within the HSC. Notably, the overall shape of the curves remains largely unchanged even at higher current densities, thereby suggesting good structural stability and rate capability. The specific capacitances measured at each current density were 121.44, 71.5, 58.44, and 51.25 F/g, respectively (Table 5). Compared with the three-electrode measurements in Fig. 7, the coin cell exhibits lower capacitance values. This is because both electrodes in the full two-electrode system actively participate in the charge-discharge process, and factors such as electrode-electrode interactions, internal resistance, and electrolyte resistance collectively reduce the measured capacitance relative to the three-electrode configuration.
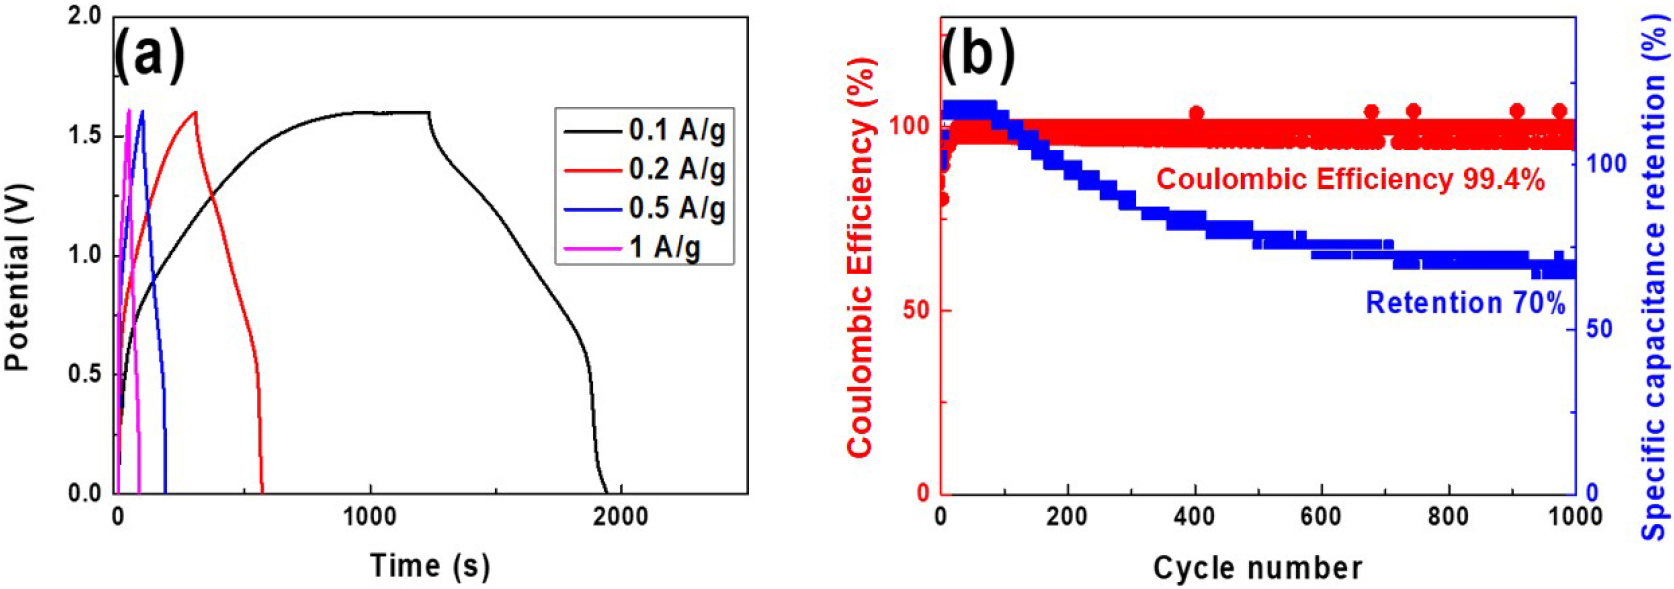
Table 5.
Specific capacitance at various current densities of a hybrid supercapacitor coin cell based on a Zn(Mn1.2Fe0.8)O4//Graphite electrode configuration.
| Current density (A/g) | 0.1 | 0.2 | 0.5 | 1 |
| Specific capacitance (F/g) | 121.44 | 71.5 | 58.44 | 51.25 |
The coulombic efficiency and capacitance retention of the coin cell during 1,000 charge-discharge cycles at a high current density of 1 A/g are presented in Fig. 8(b). Here, the cell exhibits a slight increase in capacitance during the initial activation phase and maintains 70 % of its initial capacitance after 1,000 cycles, with a high coulombic efficiency of approximately 99.4 %. The capacitance retention is calculated as the ratio of the capacitance after cycling to the initial capacitance and serves as a critical indicator of device lifetime and suitability for long-term operation. Meanwhile, the coulombic efficiency is defined as the ratio of charge delivered during discharge to charge stored during charging and reflects the reversibility of the charge-discharge process. The high coulombic efficiency observed here indicates that the HSC operates with minimal side reactions or electrode degradation, thus suggesting excellent long-term cycling stability suitable for practical energy storage applications.
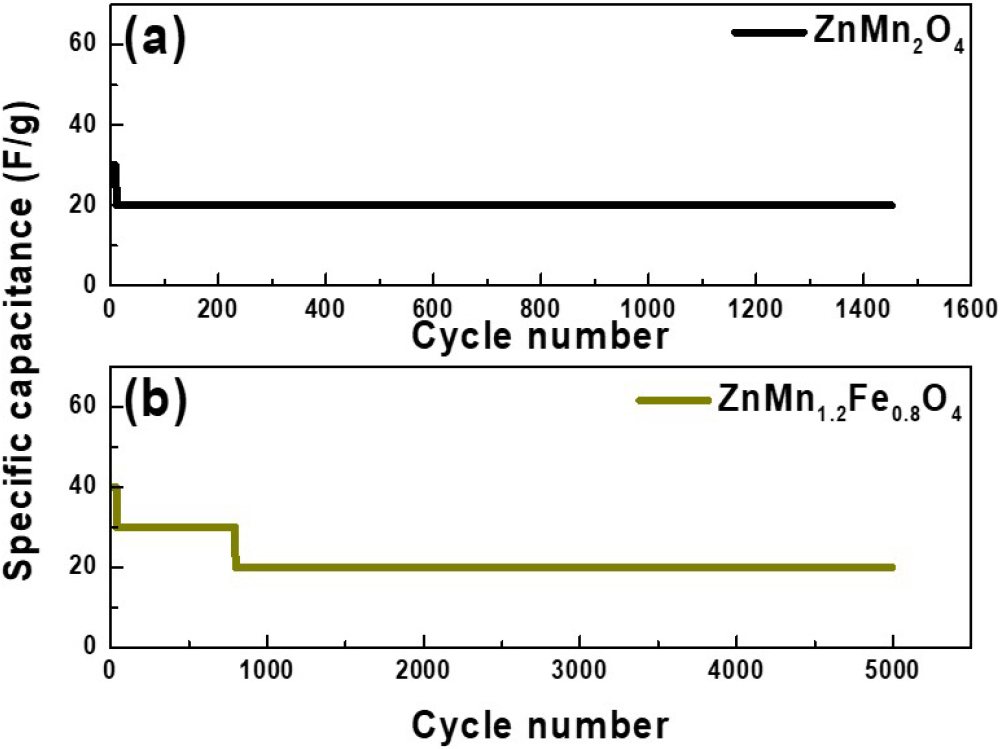
Fig. 9 shows the cycling stability of ZnMn2O4 and Zn(Mn1.2Fe0.8)O4. After 5,000 charge-discharge cycles, the capacitance of ZnMn2O4 began to decrease from approximately the 40th cycle and completely faded by the 1,450th cycle. In contrast, Zn(Mn1.2Fe0.8)O4 exhibited a slight decrease around the 800th cycle after the initial activation process, but maintained stable capacitance up to 5,000 cycles. These results indicate that Zn(Mn1.2Fe0.8)O4 possesses significantly enhanced cycling stability compared to ZnMn2O4, which can be attributed to the improved structural stability of the electrode through Fe substitution for Mn.
4. Conclusion
Herein, hybrid supercapacitor electrodes with enhanced electrochemical performance and electrode durability were fabricated using hydrothermally synthesized Zn(Mn2-xFex)O4 (ZMFO) powders with various Fe contents (x = 0.4, 0.8, 1.2, and 1.6). The structural and electrochemical properties of the electrodes depending on the amount of substitution of Fe for Mn were evaluated. An XRD analysis confirmed the successful Fe substitution at Mn sites, while excessive Fe doping led to the formation of secondary Fe2O3 phases within the ZMFO matrix. Compared to ZnMn2O4, the Zn(Mn1.2Fe0.8)O4 sample exhibited increased oxygen defects and dominant Fe3+ ion substitution, which contributed to an improved electrochemical performance. However, as the Fe content increased, the amount of Fe2O3 also increased, thereby resulting in increased charge transfer resistance (Rct). The CV curves of the fabricated electrodes displayed well-defined redox peaks, with increased CV areas at higher scan rates, thereby indicating enhanced electrochemical reactivity. The charge-discharge tests revealed that the Zn(Mn1.2Fe0.8)O4 achieved the highest specific capacitance of 374 F/g, which was approximately five times that of ZnMn2O4 (72.3 F/g), thereby demonstrating significant improvements in both electrochemical performance and electrode longevity. A hybrid supercapacitor coin cell containing the Zn(Mn1.2Fe0.8)O4 exhibited a specific capacitance of 121.44 F/g at 0.1 A/g and maintained 70 % of its capacitance after 1,000 charge-discharge cycles at 1 A/g. Among the various compositions tested, the Zn(Mn1.2Fe0.8)O4 showed the most outstanding properties. The ZMFO powders and electrodes developed herein are expected to overcome the present limitations related to the capacity and lifespan of ZnMn2O4 based electrodes.
