


1. Introduction
Coal gangue is the solid waste that is discharged during coal mining and coal washing. As a kind of black-gray rock produced in coal-forming process with lower carbon content, it is harder than coal. It is estimated that the discharged coal gangue accounts for more than 40 % of industrial solid waste in China, which is one of the largest industrial solid wastes. If the coal gangue is disposed improperly, it will threaten the environment and bring about serious pollution.1) Using coal gangue aggregate in concrete can bring economic and environmental benefits. The advantages of coal gangue coarse aggregate include low environmental pollution, occupy less valuable landfill space, save natural aggregate resources and reduce energy consumption.2)
Research has shown that coal gangue concrete presents lower compressive strength, frost resistance and antipermeability compared with ordinary concrete3) which caused the limited use of CGC. On the contrary, the addition of steel fibers into concrete matrix can improve its properties, and enable the utilization of high strength concrete, while maintaining a ductile behavior.4) Steel fiber as reinforced material has been used widely.
Ati and Karahan5) showed that the addition of steel fibers into Portland cement concrete and fly ash concrete, improve the tensile strength properties, drying shrinkage and freeze-thaw resistance. It can also reduce workability and increase sorptivity coefficient. Kim et al.6) investigated the effect of steel fiber inclusion on the compressive and flexural performance of alkali-activated slag(AAS) concrete. Results showed that steel fiber inclusion improve the mechanical performance of AAS concrete. Wang and Zhao2) found that the compressive strength, flexural strength and tensile splitting strength of coal gangue coarse aggregate concrete at the age of 28 days increase with the steel fiber content increasing, while impermeability decreases. They also optimized the steel fiber content in coal gangue concrete by Efficacy Coefficient Method. Kayali et al.7) studied the effect of steel fibers on high strength lightweight aggregate concrete, the results showed that a significant gain in ductility when steel fiber reinforcement is used. Topçu and Canbaz8) investigated the effects of three different types of steel and polypropylene fibers, they found that addition of fibers provide better performance for the concrete. Karahan et al.9) experimentally investigated the effects of milled cut steel fiber reinforced concretes on water absorption rate. Their finds showed that the addition of milled cut steel fibers does not significantly increase water absorption as compared to the situation without milled cut steel fibers. Niu et al.10) obtained that the use of steel fiber could improve the pore structure and decelerate the damage of concrete during freeze-thaw cycles. It was also shown that the steel fiber content has the great influence on the frost-resisting property of steel fiber reinforced concrete.
However, few researches have been conducted on capillary water absorption of CGC with addition of steel fibers under freeze-thaw cycles. Although in most cases the dominating mechanism for water ingress in cementitious materials is capillary absorption,11) the capillary water absorption is the most affected parameter from freeze-thaw cycles.12) In addition, the CGC has been used as a kind of ecological concrete, and the steel fiber has been used to reinforced concrete for a long time. Therefore we pose the question: how will the addition of steel fiber affect the capillary water absorption of CGC under freeze-thaw cycles?
The present study aims to develop a better understanding of the effects of volume fraction of steel fiber and number of freeze-thaw cycles on capillary water absorption by sorptivity test and freeze-thaw test. Three prediction models of the initial sorptivity of SFRCGC under freeze-thaw cycles were established to evaluate the water absorption of SFRCGC. The researcher provides not only a basis for the evaluation of capillary water absorption, but also the theoretical support for the research on frost resistance of SFRCGC.
2. Materials and Experiments
2.1. Raw Materials
Ordinary Portland cement P·O 42.5 manufactured by Cement Plant of Qinling Shaanxi with no agglomeration, and the fine aggregate consisted of Bahe River sand with the mud content is less than 2 % were used in this experiment. The coarse aggregate is the gravel of the particle size is 5~25 mm without needle-like sheet. Coal gangue produced from the Hongliulin coal mine and mainly consisted of black limestone. in order to avoid excessive particle size and needle plate content of coal gangue, the screening was carried out and completed by using porous sieve before the test to minimize the dispersion of concrete. Steel fiber was of shearing wave type, a diameter of 0.8 mm and a length of 30 mm adopted. A high performance of water-reducing of TPEG- 2400 Polycarboxylic with the water-reducing ratio of 20 % was used in this study.
2.2. Mixture proportions and specimens preparation
Cubic specimens having 100 mm × 100 mm × 100 mm were prepared for the test. The specimens’ signs, mix proportions and 28-day compressive strength were given in Table 1.
Table 1
Mix proportions and 28-day compressive strength of concrete.
2.3. Test Methods
2.3.1. Sorptivity test
The sorptivity test was based on ASTM C1585.13) The test apparatus is shown in Fig. 1.
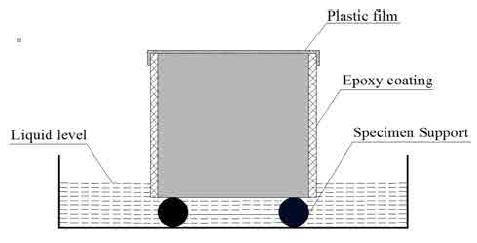
Prior to the test, the specimens were sealed using epoxy coating on the four sides(pouring surface as the top surface). When the epoxy was dry, the specimens were placed in an oven at a temperature of 105 °C and a relative humidity of 80 ± 3 % for 48h until constant mass was achieved. The top surface of the cooled specimens was covered with a plastic film secured with a rubber brand. The capillary water uptake was in one direction from the bottom up throughout the entire test. Only one surface(untreated surface) of the specimens was allowed to contact with water and placed specimens on the support device so that the water level is 1 to 3 mm above the top of the support device. Measure the length of each side of the contact water surface of specimens 3 times with vernier caliper, and calculate the exposed area of the specimens. The specimens were weighed at defined intervals in Table 2 to get the average weight of three specimens in each group. The weighing precision is 0.01 g, and the time precision is 1s.
2.3.2. Freeze-thaw test
The freeze-thaw test was performed in accordance with the rapid freeze-thaw test method in Chinese Standard GB/T 50082-2009,14) All specimens were subject to the condition of standard curing 28d, and immersed in water (the water exceeds the top surface of specimens at least 20-30 mm) for 4d before applying freeze-thaw cycles. The specimens were tested by KDR-V9 series concrete rapid freeze-thaw tester, and the specimens should be kept saturated during the freeze-thaw testing. Freeze-thaw were carried out up to 30 cycles on specimens. After every 10 freeze-thaw cycles, the sorptivity test was carried out again.
3. Results and Discussion
Calculate the change of specimens mass at defined intervals from the test, equation (1) can be used to obtain the cumulative water absorption:
where: I = absorption, in mm; mt = the change of specimen mass in grams, at the time t, in units of g; a = the exposed area of the specimen, in mm2, and d = the density of the water in g/mm3.
Ignoring the hydration reaction, the theoretical expression for the cumulative water absorption of one-dimensional capillary water-absorbing concrete in a certain period of time is shown in equation (2).15))
where: S = the rate of water absorption(sorptivity), in mm/s1/2, defined as the slope of the line that is the best fit to I plotted against the square root of time(s1/2), obtain this slope by using least squares, linear regression analysis of the plot of I versus time1/2; B = the vertical axis of the curve intercept, which is caused by the rapid fill of the capillary pores as water contacts with the specimen surface.
3.1. The curve of cumulative water absorption
Under freeze-thaw cycles, the variation of cumulative water absorption of CGC specimens and SFRCGC specimens with the square root of time are shown in Fig. 2.
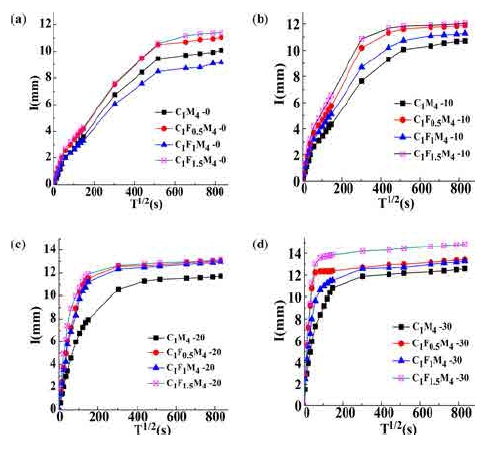
Fig. 2
The curve of cumulative water content versus the square root of time. (a) Without freeze-thaw cycles, (b) 10 freeze-thaw cycles, (c) 20 freeze-thaw cycles and (d) 30 freeze-thaw cycles.
From Fig. 2, it can be seen that the cumulative water absorption process of SFRCGC increased non-linearly with the square root of time, but a relatively rapid increase in the early stage (T1/2 = 0~147s); slower increase in the middle stage (T1/2 = 147~518s) and it tended to be stable until balanced in the late stage (T1/2 = 518~831s). It was found that the cumulative water absorption increased linearly in all the three stages respectively, but the increasing rate was gradually decreasing. In other words, the initial rate of water absorption was faster, secondary rate slowed down, and the late rate of water absorption tended to be stable, which was caused by the capillary suction. Once the bottom of the specimens contacted with water, the moisture could immerse in the specimens rapidly and then instantaneously filled the capillary pores spread on the specimens’ surface. With the extension of water absorption time, the depth of water seepage increased, and the transmission of moisture in the internal specimens was hindered, which slowed down the rate of water absorption.
As shown in Fig. 2(a), the addition of 1.0 % steel fiber in volume fraction showed the lowest cumulative water absorption without freeze-thaw cycles. It indicated that the steel fibers had a strong bond with the cement mortar in CGC, which strengthened the impact of steel fiber on cement mortar and the function of the steel fibers could be fully achieved. It also showed that the addition of 0.5 % steel fiber in volume fraction had higher cumulative water absorption than that of 1.0%. The phenomenon indicated that adding little steel fibers could not provide the crack resistance to CGC; in turn, it will increase the amount of porosity and the probability of occurrence of harmful pores in CGC, which will destroy the dense internal structure of CGC and produced more penetration path contributing to high cumulative water absorption.
From Fig. 2(b) to Fig. 2(d), it can be observed that the cumulative water absorption of SFRCGC increased fairly high with the increase of freeze-thaw cycles. The reason is that the mortar damage gradually accumulates with the increase of freeze-thaw cycles, which will weaken the bonding strength between the aggregate and steel fibers. As a result, steel fibers could easily be pulled out and the role of steel fibers could not be effectively performed. Fig. 3 showed the damage morphology of specimens under 30 freeze-thaw cycles, in which the steel fibers and aggregate coal gangue are exposed, and the specimens has been destroyed with multiple micro-cracking and penetrating cracks.
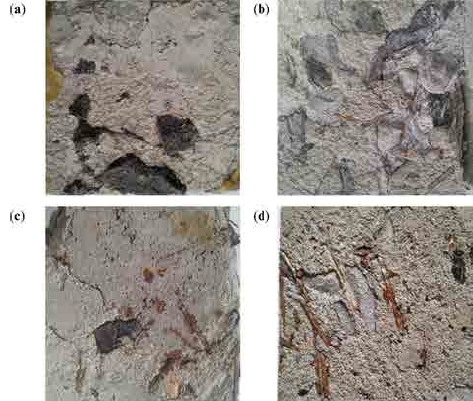
Fig. 3
The damage morphology of specimens under 30 freezethaw cycles. (a) C1M4, (b) C1F0.5M4, (c) C1F1M4 and (d) C1F1.5M4.
Under the freeze-thaw cycles, SFRCGC presents higher water absorption when the steel fiber content is 1.5 %. The reasons include: 1) The interfacial zone between the steel fiber and coal gangue aggregate increases due to the addition of excessive steel fibers, and the interfacial zone is the weak area in SFRCGC; 2) The addition of excessive steel fiber makes the inhomogeneity of CGC become more and more obvious. The density of CGC decreases, the number of large pores and defects increases, which will lead to the increase of cumulative water absorption of SFRCGC.
Based on the above analysis, it seems that the addition of 1.0 % volume fraction of the steel fiber to CGC can be regarded as the suitable content in this test. Although the 1.0 % steel fiber volume fraction added into CGC does not work under freeze-thaw cycles, but it causes the lowest water absorption compared with that of the 0.5 and 1.5 % volume fraction. It reminds the researchers that too much coarse coal gangue added to CGC may lead to the result that the 1.0 % steel fiber does not work under the freeze-thaw cycles. Therefore, further studies on the effect of steel fiber by volume fraction to CGC (the substitution rate of coal gangue coarse is less than 40 %) should be carried out.
3.2. Relationship between the rate of water absorption and freeze-thaw cycles
Fig. 4 showed the variation of the rate of water absorption( sorptivity) of SFRCGC specimens with the number of freeze-thaw cycles. The initial, the secondary and the final sorptivity are obtained by the linear fitting of the first-stage, the second-stage and the third-stage data respectively in Fig. 2.
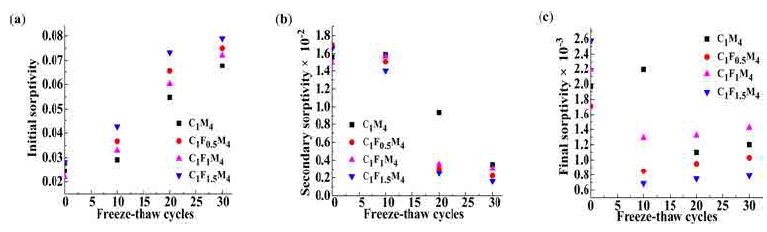
Fig. 4
The variation of the rate of water absorption(sorptivity) with freeze-thaw cycles. (a) the initial sorptivity, (b) the secondary sorptivity and (c) the final sorptivity.
Fig. 4(a) showed that with the increase of freeze-thaw cycles, the initial rate of water absorption in SFRCGC and CGC increases. With the freeze-thaw cycles increasing into 30, the trends of the initial sorptivity curve in SFRCGC and CGC were almost the same. Compared 30 freeze-thaw cycles with the situation without freeze-thaw cycles, the maximum initial rate of water absorption among SFRCGC increased by 3.28 times, while the initial rate of water absorption in CGC increased by 2.76 times. The initial sorptivity of SFRCGC increases remarkably with the internal damage caused by freeze-thaw cycles, which indicates that the SFRCGC is comparatively more sensitive to the action of freeze-thaw cycles.
From Fig. 4(b), It was observed that the change of the secondary rate of water absorption of SFRCGC and CGC were negatively correlated with the increase of freezethaw cycles. But their reduction rates are different, the more the initial sorptivity, the more the reduction of secondary sorptivity, which causes the curve of SFRCGC and CGC are somewhat different. A knee point in SFRCGC was observed when the freeze-thaw cycles was 20, which led to the decrease of the secondary sorptivity of SFRCGC much slower than that of CGC. The reasons have been explained in the analysis of Fig. 2.
As shown in Fig. 4(c), the final rate of water absorption of CGC slightly increased at 10 freeze-thaw cycles, and then decreased suddenly. As the freeze-thaw cycles reached 20, the final sorptivity remained constant and the curve tended to be gentle. Once the SFRCGC was exposed to freeze-thaw cycles, its final sorptivity began to reduce greatly. After 10 freeze-thaw cycles, the final sorptivity decreased to a certain value and remained constant, and the curve tended to be stable eventually. Therefore, the final sorptivity can be used as an indicator to evaluate the service life of concrete.
From the above analysis, it can be seen that the freezethaw cycles is the most influential factor on the initial sorptivity of SFRCGC, and the more the number of freezethaw cycles, the greater the initial sorptivity, which leads to water with a large number of harmful substances immersing into SFRCGC in a short time, and the process accelerates its damage and deterioration rate. Briefly, The addition of steel fibers accelerates the rate of water absorption.
4. Establishment of Prediction Model
The initial rate of water absorption(initial sorptivity) can be used to evaluate the capacity of capillary water absorption of SFRCGC, so it is worth establishing the initial sorptivity prediction model for SFRCGC under freeze-thaw cycles.
Basic Assumptions:
1) The water absorption process is one-dimensional, such factors as the chemical reactions between the composition materials and water, the effect of evaporation are ignored;
2) The specimens in a completely dry state at the very beginning, the absorbent boundary conditions are stable during the water absorption process;
3) The initial sorptivity is only a function of the number of freeze-thaw cycles, the freeze-thaw temperature and other environmental conditions are ignored;
4) With the increase of freeze-thaw cycles, the initial sorptivity increases, and both are positive.
4.1. The Exponential Prediction Model
4.1.1. Determination of Basic Form of Prediction Model
Equation (3) presents the basic form of initial sorptivity prediction model of SFRCGC, which is obtained by exponential fitting of the data in Fig. 4(a), and the Rsquare are all above 0.84.
where: SI = the initial sorptivity; A, B = Influence coefficient of steel fibers by volume fraction; and N = the number of freeze-thaw cycles
4.1.2. Parameter Determination
The results of exponential fitting of C1M4, C1F0.5M4 and C1F1.5M4 were analyzed by regression analysis, which can be used to establish the relationship between influence coefficient of steel fibers by volume fraction and the steel fibers volume fraction, as shown in Equations (4) and (5):
where:
The initial sorptivity prediction model of SFRCGC can be obtained by taking Equations (4) and (5) into Equation (3), The specific form is as follows:
where:
4.1.3. Verification of Equation (6)
The initial sorptivity of C1F1M4 is used to validate the Equation (6). The actual value and calculated value of C1F1M4 are shown in Table 3.
Table 3
Comparison between trial value and calculated value.
| Sign | Freeze-thaw cycles | 0 | 10 | 20 | 30 |
|---|---|---|---|---|---|
| C1F1M4 | Actual value(AA) | 0.02195 | 0.03294 | 0.0602 | 0.07203 |
| Calculate value(CA) | 0.03248 | 0.04438 | 0.06064 | 0.08286 | |
| AA/CA | 0.6758 | 0.74223 | 0.99274 | 0.8693 | |
Based on Table 3, the average value of AA/CA is 0.8200, and the standard deviation is 0.1183.
4.2. Linear Function Prediction Model
4.2.1. Determination of Basic Form of Prediction Model
The linear fitting of the data in Fig. 4(a) gives the basic form of the initial sorptivity prediction model of SFRCGC, as shown in Equation (7), and the R-square were all above 0.91.
where:
4.2.2. Parameter Determination
The results of fitting linear of C1M4, C1F0.5M4 and C1F1.5M4 were analyzed by regression analysis, which can be used to establish the relationship between influence coefficient of steel fibers by volume fraction and the steel fibers volume fraction. as shown in Equations (8) and (9):
where:
The initial sorptivity prediction model of SFRCGC can be obtained by substituting Equations (8) and (9) into Equation (7), The specific form as follows:
where:
4.2.3. Verification of Equation (10)
The initial sorptivity of C1F1M4 is used to validate the Equation (10), Table 4 presents the actual value and the calculated value of C1F1M4.
Table 4
Comparison between trial value and calculated value.
| Sign | Freeze-thaw cycles | 0 | 10 | 20 | 30 |
|---|---|---|---|---|---|
| C1F1M4 | Actual value(AA) | 0.02195 | 0.03294 | 0.0602 | 0.07203 |
| Calculate value(CA) | 0.02802 | 0.04605 | 0.06409 | 0.08212 | |
| AA/CA | 0.78337 | 0.71531 | 0.9393 | 0.87713 | |
Based on Table 4, the average value of AA/CA is 0.8289, and the standard deviation is 0.0837.
4.3. The Polynomial Prediction Model
4.3.1. Determination of Basic Form of Prediction Model
Equation (11) shows the basic form of initial sorptivity prediction model of SFRCGC, which is obtained by polynomial fitting of the data in Fig. 4(a).
where:
4.3.2. Parameter Determination
The results of polynomial fitting of C1M4, C1F0.5M4 and C1F1.5M4 were analyzed by regression analysis, which can be used to establish the relationship between influence coefficient of steel fibers by volume fraction and the steel fibers volume fraction. Results show in follows:
where:
The initial sorptivity prediction model of SFRCGC can be obtained by substituting Equations (12), (13), (14) and (15) into Equation (11), The specific form as follows:
Where:
4.3.3. Verification of Equation (16)
The initial sorptivity of C1F1M4 was used to validate the Equation (16). The actual value of C1F1M4 were compared with the calculated value, as shown in Table 5.
Table 5
Comparison between trial value and calculated value.
| Sign | Freeze-thaw cycles | 0 | 10 | 20 | 30 |
|---|---|---|---|---|---|
| C1F1M4 | Actual value(AA) | 0.02195 | 0.03294 | 0.0602 | 0.07203 |
| Calculate value(CA) | 0.0288 | 0.0411 | 0.07165 | 0.07877 | |
| AA/CA | 0.76215 | 0.80146 | 0.8402 | 0.91443 | |
Based on Table 5, the average value of AA/CA is 0.8296, and the standard deviation is 0.0548.
4.4. A Comparative Analysis of the three Prediction models
The Polynomial prediction model shows higher calculation precision compared with the other two models.
But the form of the Polynomial prediction model is relatively complex, which consists of more cumbersome coefficients, thus reducing its application value in engineering.
The exponential prediction model and linear function prediction model are simple in form, and the linear function prediction model presents higher calculation precision between them.
Therefore, the linear function prediction model is more applicable in predicting the capillary water absorption of SFRCGC under freeze-thaw cycles.
5. Conclusion
In this paper, we posed the question: How will the addition of steel fibers affect the capillary water absorption of CGC under freeze-thaw cycles? To this end, we experimentally studied the effect of steel fiber on water absorption of CGC, and the following conclusions were drawn :
1) Without freeze-thaw cycles, the capillary water absorption of SFRCGC decreases in the situation of the 1.0 % steel fibers in volume fractions added into CGC, while the volume fraction of 0.5 %, 1.5 % steel fibers into CGC increases the capillary water absorption. Hence, the addition of the steel fiber at 1.0 % volume fractions into CGC in non-cold areas can reduce the capillary water absorption of SFRCGC, and then improve the frost resistance.
2) Under freeze-thaw cycles, the addition of steel fibers into CGC significantly increases the capillary water absorption of CGC, and 1.0 % steel fiber in volume always causes the lowest water absorption besides that of without steel fibers. It seems that the addition of 1.0 % volume fraction of the steel fiber to CGC can be regarded as the suitable content at the level of this test.
3) The effect of freeze-thaw cycles on the durability of SFRCGC should be taken into account in severe cold regions, because the capacity of capillary water absorption of SFRCGC is stronger than that of CGC under freeze-thaw cycles.
4) The linear function prediction model provides the theoretical basis for the evaluation of the capillary water absorption of SFRCGC, which has great application value in practical engineering because of its simple form and high calculation precision.
5) Further studies should be conducted on the effect of steel fiber by volume fraction to CGC (the substitution rate of coal gangue coarse is less than 40 %), which can be used to determine whether the 1.0 % steel fibers added to CGC will reduce the water absorption of CGC under the freeze-thaw cycles.