

1. Introduction
As a next-generation solar cell, Perovskite solar cells have demonstrated high photoelectric conversion efficiency (PCE) and fill factor (FF). Recent studies have reported a PCE up to 25.2 %.1,2)
Perovskite solar cell comprises an electron transfer layer (ETL), a photoactive layer (AL), a hole transfer layer (HTL), and an electrode. The ETL is mainly composed of n-type metal oxides such as TiO2,3-7) ZnO,8-10) and Al2O3.11-13) In particular, TiO2 and ZnO ETL show better electron conductivity than other ETLs and have been reported to enhance the PCE and the FF of the Perovskite solar cells.2,14-15) Especially, when mesoporous (mp) TiO2 is used as an ETL, it facilitates the transfer of electrons faster because of its porous specificity.5-7,14-15) It has been revealed that direct coating of Perovskite AL on the mp TiO2 ETL leads to penetration of Perovskite AL into the pores of mp TiO2, causing lower electron conductivity due to the recombination of electrons and holes.
In this study, ZnO was coated on mp TiO2 (ZMT) ETL to prevent Perovskite from seeping into the ETL and to prevent recombination of electrons and holes. The Perovskite solar cells with ZMT ETL showed better PCE than conventional mp TiO2 ETL devices.
2. Experiment
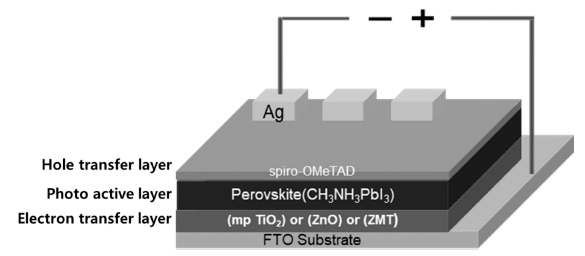
We fabricated 3 types ETL, ① mp TiO2 ② ZnO ③ ZMT. The aim was also to compare the photoelectric conversion efficiency (PCE) and fill factor (FF) of Perovskite solar cells. Fig. 1 represents the structural representation of the devices as FTO/ETL/Perovskite (CH3NH3PbI3, AL)/spiro-MeOTAD(HTL)/Ag(electrode).
TiO2 paste (P25, DYESOL) and ethanol were ultrasonicated for 2 hours at a ratio of 1:6 wt% in room temperature (RT) to make mp TiO2 ETL precursor. ZnO ETL precursor was made by the following method, ethanolamine was added to 1 M of zinc acetate in an ethanol solvent, and after the mixture was stirred at 80 °C for 22 hours.
Perovskite AL precursor was made by the following method, PbI2 (1 M, Sigma Aldrich) was stirred in N,Ndimethylformamide at 80 °C for 12 hours. Methyl ammonium iodide (MAI, 0.5 M, DYESOL) was stirred in isopropyl alcohol at RT for 2 hours.
Bis(trifluoromethylsulfonyl)amine lithium salt (Li-TFSI, Sigma Aldrich) and 4-tert-buylpyridine were added with spiro-MeOTAD (0.5 M, Luminescence Technology Corp.) into chlorobenzene solvent, and after the mixture was stirred at RT for 12 hours to make spiro-MeOTAD HTL solution.
The FTO glass was cleaned in acetone and IPA for 20 minutes respectively, dried for 10 minutes in a vacuum oven and fabricated 3 types of ETLs on FTO glass by following method, respectively. The mp TiO2 ETL was made by spin-coating mp TiO2 precursor on FTO glass and sintering it at 450 °C in the furnace for 30 minutes. ZnO precursor was spin-coated on FTO glass and sintered at 190 °C for 2 hours to make ZnO ETL. ZMT ETL was made by the following method: mp TiO2 precursor was spin-coated on FTO glass and then sintered at 450 °C in the furnace for 30 minutes. And after that, the ZnO precursor was spin-coated on TiO2 ETL and sintered at 190 °C for 2 hours.
ETLs were pre-heated at 50 °C for 5 minutes, later PbI2 solution was spin-coated on ETLs at 4,000 rpm for 20 second followed by annealing at 80 °C for 10 minutes. PbI2 layer with ETLs was dipped in MAI solution for 1 minute and spin-coated at 4,000 rpm for 20 second, and subsequently annealed at 100 °C for 5 minutes for the synthesis of Perovskite active later. The spiro-MeOTAD solution was spin-coated on Perovskite AL at 4,000 rpm for 20 second and then dried for 5 minutes in RT. Finally, the Ag electrode was deposited to 100 nm at 1 Å/s using a thermal evaporator.
The morphology, crystal structure, and energy bonding of ETLs were measured by scanning electron microscope (SEM, Gemini 500, Oxford), X-Ray diffractometer (XRD, X'Pert PRO MPD), and X-ray photoelectron spectroscopy (XPS, K-ALPHA+), respectively. The electrical characteristics of Perovskite solar cells were measured by the solar simulator, under the condition of 1 SUN and 1.5 AM.
3. Results and Discussion
Fig. 2 represents the SEM images of mp TiO2, ZnO, and ZnO on mp TiO2 ETL. In Fig. 2(a), the morphology of mp TiO2 ETL shows the presence of numerous pores on the surface. The presence of pores could possibly entertain the penetration of the photoactive layer into mp TiO2 ETL, which is unsuitable for the synthesis of Perovskite AL. Fig. 2(b) reveals the morphology of ZnO ETL as web-shaped structures without pores. This morphology prevents the penetration of the photoactive layer, thus preventing recombination with electrons and holes. In Fig. 2(c), the morphology of the ZnO on mp TiO2 ETL is similar to that of the ZnO ETL, confirming that the surface pores are filled. This morphology prevents the penetration of the Perovskite AL into the ETL, thereby leading to the stable synthesis of the Perovskite AL and preventing the recombination of electrons and holes. Fig. 2(d) shows the surface morphology of the Perovskite AL on ZnO on mp TiO2, the other ETLs same also.
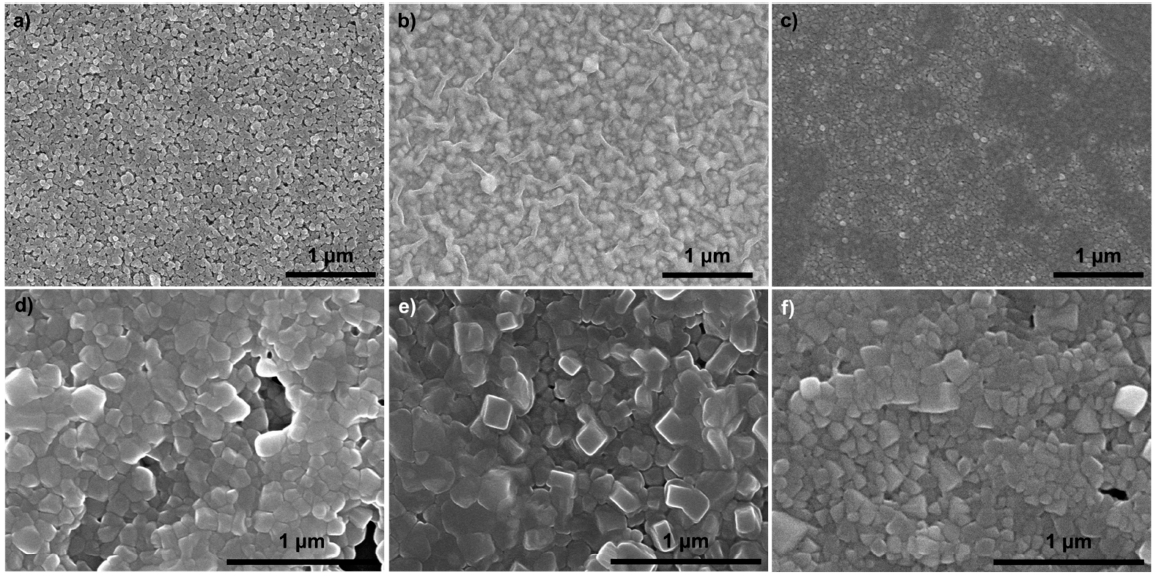
Fig. 2
SEM images of ETL surface: (a) mp TiO2, (b) ZnO, (c) ZMT, (d) ~ (f) Perovskite photoactive layer on (a) ~ (c) respectively.
Fig. 3 shows the XRD pattern of ZMT, TiO2, and ZnO ETLs. The XRD pattern of ZnO shows a hexagonal wurtzite phase along the 002 planes (JCPDS: 36-1451). And XRD pattern of mp TiO2 shows the anatase phase along the 101 planes (JCPDS: 00-021-1272). In the annealing process of ZnO, the crystal structure of TiO2 is partially destroyed, so the intensity of ZMT is considered to be decreased.
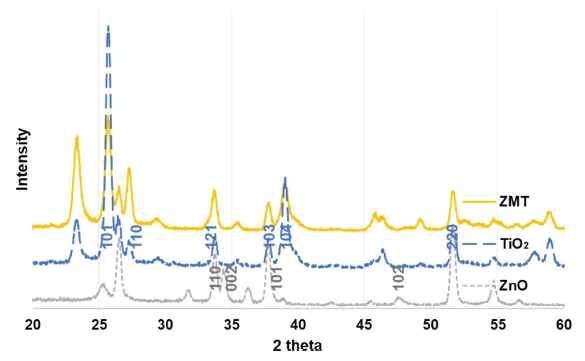
Fig. 3
XRD patterns of ETLs, ZnO ETL shows hexagonal wurzite phase along the 002 plane, and TiO2 ETL was anatase phase along the 101 plane. Decreasing the intensity of ZMT is considered that the annealing process of ZnO caused the destruction of TiO2.
Fig. 4 represents the energy bonding of ETLs XPS pattern. Fig. 4(a) shows the energy bonding of mp TiO2 and ZMT Ti 2p peak as XPS pattern, the Ti 2p3/2, and Ti 2p1/2 peaks were confirmed at 458.58 and 464.38 eV respectively. The peak of the Ti 2p energy bond change amount is 5.8 eV, which means mp TiO2 was formed as ETL. Fig. 4(b) shows the energy bonding of ZnO and ZMT Zn 2p peaks as XPS pattern, the Zn 2p3/2, and Zn 2p1/2 peaks were confirmed at 1,021.68 and 1,044.78 eV respectively. The peak of the Zn 2p energy bond change amount is 23.1 eV, which means ZnO was formed as ETL. Fig. 4(c) shows the XPS pattern of energy bonding of mp TiO2, ZnO, and ZMT O 1s peaks, 528~531 eV range of O 1s peaks means metal oxide.16)
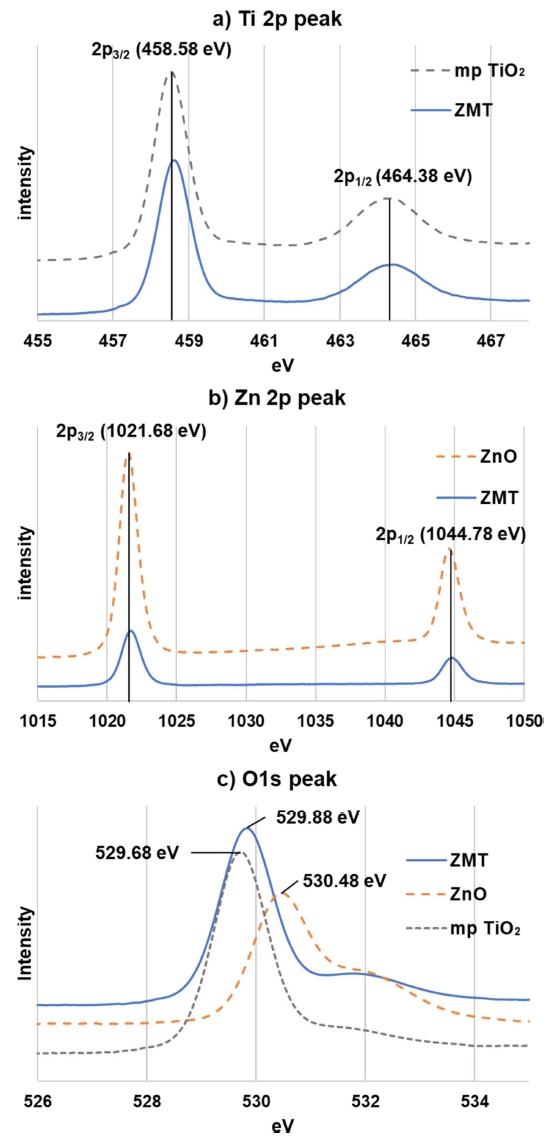
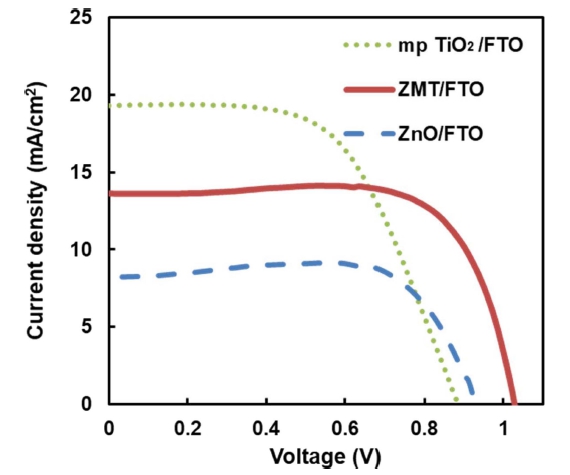
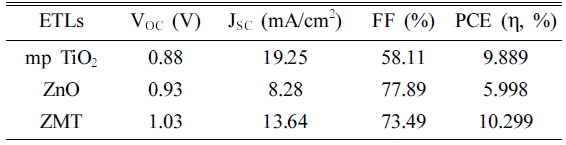
Fig. 5 and Table 1 show the open circuit voltage (VOC), short circuit current density (JSC), fill factor (FF), and photoelectric conversion efficiency (PCE) of Perovskite solar cells using the solar simulator. The VOC of Perovskite solar cells with ZnO and ZMT ETL was more than 0.9 V. However, the VOC of mp TiO2 ETL device was less than 0.9 V. In other words, penetration of Perovskite AL into mp TiO2 ETL pores led to a decrease in the VOC due to recombination of electrons and holes. On the other hand, mp TiO2 ETL device showed the highest JSC as 19.25 mA/cm2 because of porous specificity. The highest FF of ZnO ETL device was 77.89 %, similar to ZnO on mp TiO2 ETL device (73.49 %). The FF of mp TiO2 ETL device was 58.11 %, because of AL penetration into mp TiO2 ETL pores to some extent. The PCE of the device with ZnO on TiO2 (ZMT) ETL was the highest demonstrating 10.29 %.
4. Conclusions
The VOC and FF of the mp TiO2 ETL Perovskite solar cell are relatively low, which is considered due to the porosity of TiO2. On the other hand, the ZMT ETL Perovskite solar cell showed a VOC of 1.03 V and a high FF of 73.5 %, thereby obtaining an improved value over the mp TiO2 ETL device. However, the ZMT ETL device JSC showed 13.64 mA/cm2, which is about a 30 % decrease compared to the mp TiO2 device, which is considered the porosity of ZMT ETL was decreased. In order to achieve an increase in JSC and PCE, further research is needed to prevent the Perovskite AL from penetrating into mp TiO2 while maintaining the porous properties of TiO2.
