

1. Introduction
2. Material Preparation and Method
2.1. Experimental materials
2.2. Experimental methods and procedures
3. Results and Discussion
3.1. Setting time at different temperatures
3.2. Compressive strength of concrete and mortar at different temperatures
3.3 Thermal analysis of hydration
3.4 Chloride ion diffusion test
3.5 Sulfate resistance test
3.6 Scanning electron microscope
3.7 Potential limitations or challenges
4. Conclusion
1. Introduction
With the rapid development of the construction industry, concrete has been widely used as an emerging building material in the past hundred years, and the annual construction waste in China has reached billions of tons.1,2,3) It is urgent to improve the service life of buildings, reduce the output of construction waste from the source, and achieve green emission reduction. Modern urban buildings are bulky, improving their structural performance and durability can effectively reduce economic costs.4,5,6) Concrete has a relatively loose structure, rain into the concrete will cause cracking and corrosion of steel bars, infiltration problems will seriously affect the safety and durability of the structure, so the waterproof measures of the building is very important.7,8,9) Sodium sulfate has been proved by Liu et al.10) and Wu et al.11) to be a kind of capillary crystal waterproof material, and it is also widely used as an early strength agent in construction.
Different curing temperatures will have an important impact on the performance of Portland cement, and the temperature directly determines the strength development of cement and the change of various durability.12,13) Studies have shown that when the temperature is high, the hydration rate of cement in the early stage will be accelerated, but the strength will be reduced in the later stage.12) At low temperature, although the hydration rate of cement is slow, the cement is fully reacted, which makes the strength increase significantly in the later stage. However, there are also documents that show that no matter the temperature is high or low, the final degree of cement hydration will not change, and the temperature only affects the hydration process.13) The density of calcium silicate hydrate (C-S-H) and the degree of hydration of other products are also affected by temperature. The density of C-S-H increases with the increase of temperature, because the porosity of C-S-H decreases with the decrease of the number of layers. For example, at higher temperatures, ettringite will accelerate the conversion to low sulfur type calcium sulphoaluminate hydrate.
The setting time of cement is an important basis for maintaining the constructability of concrete. Huang et al.14) clarified the temperature dependence of cement setting by comparing the change of the storage modulus (G') of cement at different temperatures from 10 °C to 55 °C. The results show that the growth of G' is significantly accelerated by the increase of temperature in each stage of the solidification process, mainly because the increase of temperature promotes the formation of C-S-H bridge. It has been pointed out that the increase of temperature will accelerate the hydration rate of cement, thus accelerating the development of early compressive strength, but it will be the cement at high temperature, long-term compressive strength will be reduced.14,15,16,17) At low temperature, although the early hydration reaction rate is slow, the long-term compressive strength will be improved to a certain extent. It has also been reported that the high-temperature solidified cement will have a certain impact on the adsorption capacity of sulfate ions. With the increase of temperature, the mixing rate of sulfate ions and C-S-H is accelerated, which leads to the faster absorption of sulfate ions under high temperature conditions, thus prolongs the formation of ettringite.18,19,20,21,22)
At room temperature, cement begins to react with water after mixing with water. Among them, the hydration rate of tricalcium silicate (C3S) and tricalcium aluminate (C3A) is higher, and the hydration reaction of dicalcium silicate (C2S) is slow. The increase of curing temperature will not only accelerate the hydration reaction rate of C3S and C3A, but also increase the solubility of silicon oxide, reduce the solubility of calcium hydroxide, and increase the hydration reaction rate of C2S in the early curing period.23) That is, increasing the curing temperature accelerated the pre-hydration reaction rate of each clinker mineral component, but the hydration products generated in a short time did not have sufficient time to disperse and precipitate, and were wrapped around the cement particles, while the hydration products far away from the cement particles were less. The irregular accumulation of hydration compounds increases the microporous structure in the system and reduces the internal compactness of concrete.12)
It can be seen that temperature has a significant effect on concrete. As sodium sulfate is commonly used as early strength agent and crystalline waterproof material, it is necessary to explore its performance changes in different construction environments. The addition of sodium sulfate helps to enhance the performance of concrete and has a good waterproof effect. Exploring the influence of sodium sulfate on concrete at different temperatures is not only conducive to speeding up the popularization of engineering construction, but also helps to enhance the structural safety and service life of concrete buildings, and achieve the effect of energy saving and emission reduction.
2. Material Preparation and Method
2.1. Experimental materials
In this experiment, ordinary Portland cement (OPC), 5 mm~15 mm stone is used for coarse aggregate, sand with fineness of 2.3 is used for fine aggregate. Concrete fit is shown in Table 1:
Table 1.
Mix ratio of cement sample.
| name of the material | Cement | Stone | Sand | Water |
| material utilization amount | 270 g | 1299.3 g | 846.40 g | 198.37 g |
2.2. Experimental methods and procedures
2.2.1. Setting time at different temperatures
Experiments were conducted to determine the curing of 0 %, 0.5 %, 1 %, 1.5 %, 2 %, 2.5 %, 3 % of the cement paste at the temperature of 5 °C, 20 °C, 35 °C, 50 °C, humidity of 50 %, using the clean paste mixer slow stirring 120 s, stationary 15 s and then fast stirring 120 s. The water consumption of standard consistency measured by standard consistency meter is 28.5 %. The initial setting time and final setting time of cement paste at different temperatures were measured by standard Vicar instrument. The beginning of the setting time is when all the cement is added to the water. When the initial setting time is measured, take out the test mold from the curing box, make the test needle contact with the clean pulp surface and tighten the screw for 1 to 2 s, and the test needle will suddenly relax and fall freely. Observe the readings 30 s after the needle is stationary or released. Initial setting is reached when the test needle sinks to 4 ± 1 mm from the floor. When the final coagulation time is determined, the final coagulation test needle is changed, and the glass sheet is reversed 180° to continue the maintenance after the initial coagulation is completed. The final setting time was reached when the test needle sank 0.5 mm into the slurry without leaving a ring mark on the slurry.
2.2.2. Compressive strength at different temperatures
According to the national standard, the cement-sand ratio is 1:3.13. The mixing ratio of concrete is shown in Table 1. 0 %, 0.5 %, 1 %, 1.5 % sodium sulfate is added to the mixture and then water is added to stir. The standard maintenance of 100 mm × 100 mm × 100 mm test mold is adopted. After removing the mold, it is placed in the curing box at 5 °C, 20 °C, 35 °C and 50 °C for maintenance for 14 d and then transferred to the standard curing condition. Finally measured 14 d, 28 d, 90 d compressive strength.
2.2.3. Hydration heat analysis
2.2.3.1 TAM Air device
TAM Air is an isothermal calorimeter that measures the reaction temperature, the rate of heat released during the entire reaction process, and the total amount of heat released. It is a calorimeter channel on a temperature-controlled thermostat to monitor the heat release during the reaction in real time. The eight-channel version used in this paper has a sample tank and a control tank in each channel. In the course of the experiment, the sample is put into a 100 ml bottle and recorded by the computer in real time, and the heat release curve will be obtained.
2.2.3.2 Test Procedure
The dosage of each sample in the hydration heat experiment is obtained according to Eq. (1). Constant temperature calibration should be carried out at the beginning of the experiment. After the calibration is completed, the sample should be quickly mixed and put into the channel, and the experiment should be finished after the experimental data is completely completed.
where, mr and cr are the mass and thermal conductivity of deionized water in the reference group; mc and cc are the mass and thermal conductivity of cement.mw and cw are the mass and thermal conductivity of deionized water in experimental group. ma and ca are the mass and thermal conductivity of admixtures.
2.2.4 Test of diffusion coefficient of chloride ion
This experiment uses concrete RCM chloride ion diffusion coefficient tester. The concrete blocks cured for 28 d were put into a vacuum water retention instrument for 24 h, and then the experiment was carried out, and 0.3 mol/L NaOH solution and 10 % NaCl solution were prepared. First, the water retention test block is put into the rubber bucket, and the steel ring is installed and tightened. Fill the top of the rubber drum with water to check whether it is in good condition, and then dump it out. Then 300 mL NaOH solution was injected into the anodic rubber bucket, so that the surface of the anode plate and the specimen were immersed in the solution. NaCl solution was injected into the cathode experimental tank and flush with the NaOH solution in the rubber bucket. Turn on the power to determine the duration of the experiment according to the initial current flow, and the specific time is obtained according to Table 2. After the waiting time is over, take out the test block and cut it with a high-speed tight cutting machine. Apply 0.1 mol/L silver nitrate solution to the section of the test block, observe the precipitation of white silver nitrate after about 15 min, and calculate the average depth of the distance between the test boundary and the ground.
Table 2.
The initial voltage corresponds to the chloride ion resistance time.
| Initial current I(MA) | The electrification test time should be selected(h) |
| I < 5 | 168 |
| 5 ≤ I < 10 | 96 |
| 10 ≤ I < 30 | 48 |
| 30 ≤ I < 60 | 24 |
| 60 ≤ I < 120 | 8 |
| 120 ≤ I | 4 |
Finally, according to the depth of penetration to calculate the anti-chlorine ion permeability coefficient, the calculation Eq. (2) is as follows:
Eq. (2): DRCM is the unsteady diffusion coefficient of chloride ion (m2/s); T is the average temperature of anode and cathode solution during the experiment (°C); U is the absolute value (V) of the voltage during the experiment; L is the thickness of the specimen (mm); Xd is chloride ion diffusion depth (mm); t is the power-on time.
2.2.5 Sulfate resistance test
By soaking sulfate solution, the corrosion resistance of test blocks under different temperature curing was investigated. The test block in this experiment is a cube concrete block with a side length of 100 mm. The concrete blocks were removed and placed at different temperatures for curing. After curing for 14 d, the concrete blocks were soaked in 5 % sodium sulfate solution and water respectively. After continued curing to 28 d, the compressive strength was measured, and the strength loss of the test block was observed.
2.2.6 Scanning electron microscope
After curing the test block for 28 d, a small amount of sample is taken from the test block and soaked in alcohol for preservation, which can prevent further hydration of concrete. Before the experiment, the sample is dried and the experiment starts. During the observation, hydration products and ettringite in the structure are selected, and the hydration degree of concrete is further calculated by observing the amount of ettringite and hydration products. At the same time, the structure and arrangement of ettringite with temperature change were observed.
3. Results and Discussion
3.1. Setting time at different temperatures
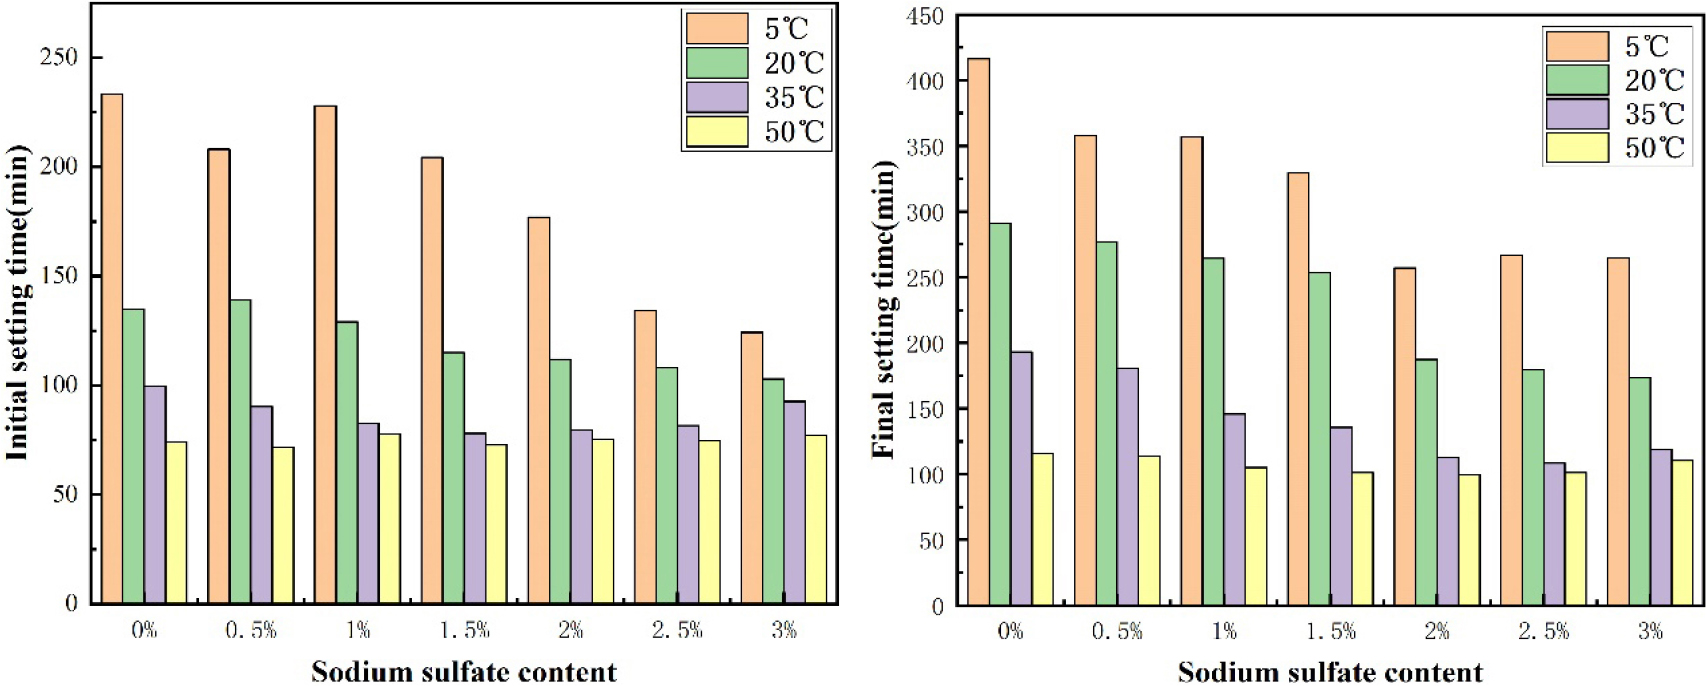
Setting time is an important guarantee to maintain the constructability of concrete. The effect of curing temperature on the initial and final setting time of cement added with sodium sulfate is shown in Fig. 1. At 5 °C, the initial setting time of cement without sodium sulfate was 228 min, and the final setting time was 421 min. With the increase of sodium sulfate, the initial setting time decreased by 44.7 % to 126 min, and the final setting time decreased by 36.5 % to 267 min. Through the use of sodium sulfate, the setting time of cement at low temperature was greatly reduced.15,16) The addition of sodium sulfate makes the sulfate group react with CH, resulting in CaSO4・H2O and C3S further reaction, rapidly forming a large number of Aft crystals, thus accelerating the coagulation and hardening of the cement slurry.14) At 20 °C, the initial setting time and final setting time of cement are gradually reduced. Under higher temperature conditions, the setting time also decreases with the increase of sodium sulfate content, but it is not obvious. The main reason is that under the conditions of 35 °C and 50 °C, the hydration of blank cement accelerates significantly, and the setting hardness has reached before the complete reaction between sodium sulfate and CH. Therefore, the increase of sodium sulfate content has little effect on the setting time of cement.
3.2. Compressive strength of concrete and mortar at different temperatures
3.2.1 Compressive strength of mortar
Fig. 2 shows the compressive strength of the mortar at 7 d, 14 d and 28 d.24) It can be seen from the results that the compressive strength at 5 °C for 7 d and 14 d is lower than that at 20 °C without sodium sulfate, but the compressive strength at 28 d is almost the same. The compressive strength of 35 °C and 50 °C also gradually increased, which indicates that with the increase of temperature, the strength of mortar in the early stage is constantly increasing, but with the extension of the maintenance time, the gap is gradually narrowing.25,26) This is because under low temperature conditions, the hydration reaction of cement mortar in the early stage is slow, resulting in a slow rise in strength. As time goes by, the further hydration makes the strength of cement mortar at low temperature gradually rise and finally reach a flat state.27)
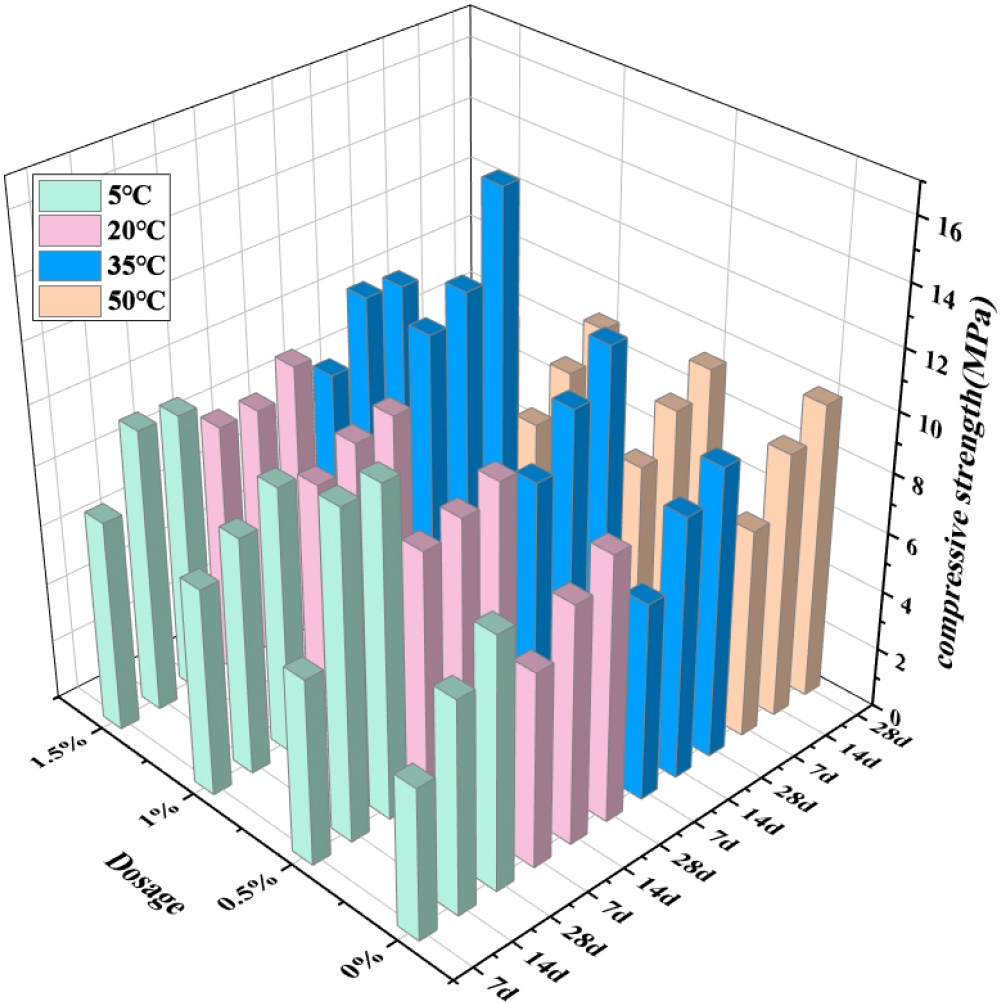
With the addition of sodium sulfate, the early hydration process was promoted, and the early strength gradually increased at 5 °C and 20 °C, but at 35 °C and 50 °C, the 7 d strength reached the peak when the sodium sulfate content was 1 % and then decreased. This is because the addition of excessive sodium sulfate will accelerate the hydration of cement, and the generated C3S will wrap the unhydrated cement and weaken its hydration degree, so it shows the phenomenon of reduced strength in the early stage. At the same time, the formation rate of ettringite is accelerated under high temperature, which makes the structural strength decrease.
3.2.2 Compressive strength of concrete
The compressive strength of concrete is shown in Fig. 3. The early-stage strength of blank group gradually increases with the increase of temperature. The compressive strength at 14 d at 5 °C is 13.7 MPa, and the compressive strength at 50 °C is 15.8 MPa, which is because the increase of temperature will accelerate the hydration of cement. The compressive strength at 50 °C reaches 21 MPa, and the strength decreases somewhat.
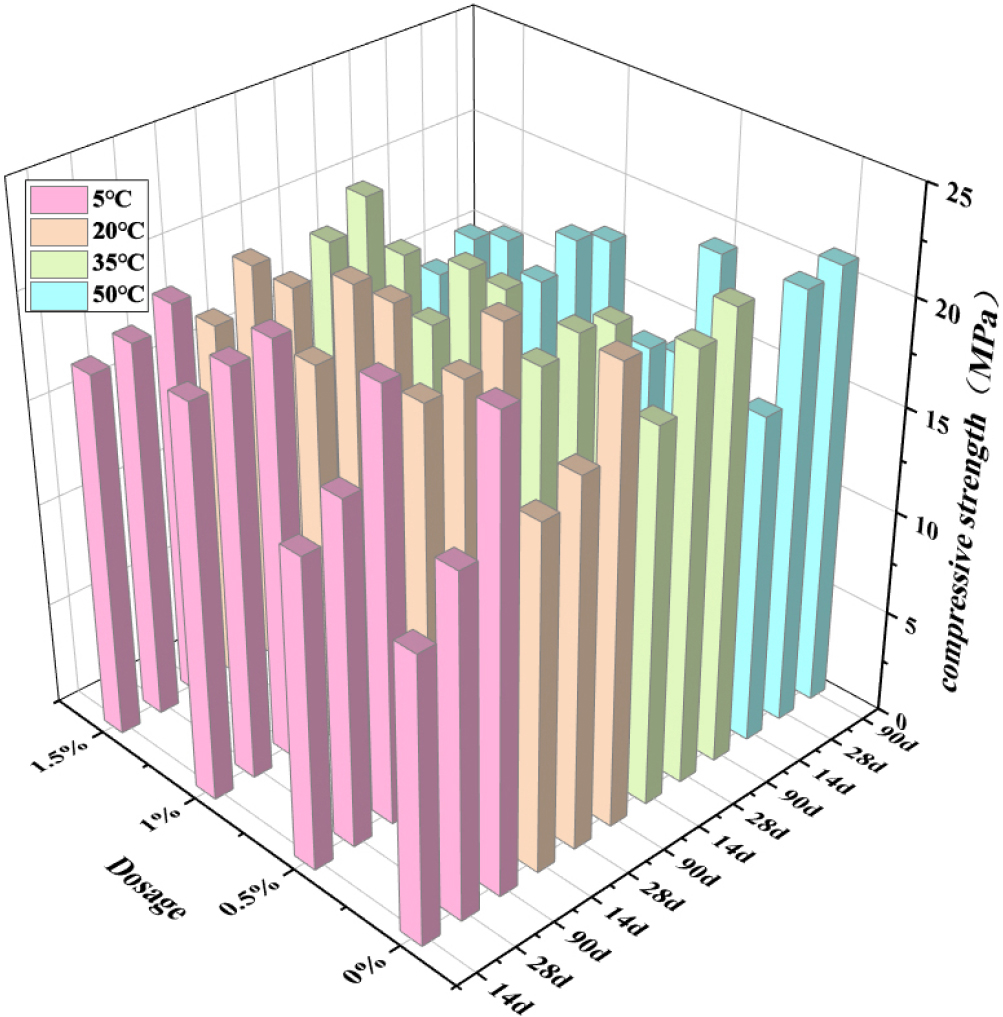
This is because hydration is basically completed, the reaction rate is slow at low temperature and the hydration is complete, while the hydration rate is fast at high temperature, resulting in insufficient hydration of cement, so the strength decreases.28,29) The 90 d strength of sodium sulfate at 5 °C and 20 °C is lower than that of the blank group. The 90 d compressive strength of sodium sulfate at 35 °C and 50 °C is lower than that of 28 d when the content of sodium sulfate exceeds 1 %. This is due to the addition of excessive sodium sulfate, a large amount of ettringite is generated, and the generation of ettringite causes damage to the concrete structure, leading to its deterioration. Reduce its compressive strength, so when the temperature is too high, sodium sulfate will cause the deterioration of concrete, the need to control the amount of sodium sulfate.
3.3 Thermal analysis of hydration
Hydration heat experiment can reflect the early hydration process of cement well, and can better analyze the relationship between hydration stage and setting time. General cement hydration heat release stage has four, respectively induction period, acceleration period, decay period, stable period. The initial reaction of cement in hydration is relatively rapid, and the resulting product C3S quickly hardens the cement, so the first radiation peak appears.30,31) This is followed by an extremely slow reaction time of 1 to 4 h, called the quiescent phase, which is mainly due to the rapid formation of C3S on the surface of the cement particles to prevent further hydration of the cement, which corresponds to the protective layer theory and delayed nucleation theory.32,33) Generally, the end of the induction period represents the arrival of the initial setting time of cement. With the rupture of the protective shell produced by the quiescent period, the cement again comes into contact with the water molecules, causing the reaction to accelerate again, this period is called the acceleration period. A second exothermic peak occurs during the acceleration period, which typically lasts 4 to 8 hours before reaching its peak.
At this point, the final solidification has passed and the hardening has begun. The delayed nucleation theory is that when C3S is rapidly hydrolyzed after contact with water, calcium ions and hydroxide ions enter the solution, so that the original C3S surface becomes a “calcium-deficient” or “silicon-rich” surface layer, and the calcium ions in the liquid phase will be adsorbed on the silicon-rich surface due to chemical adsorption, and the surface will be positively charged.34,35,36) The high concentration of calcium ions on the surface of C3S reduces the further hydrolysis of the cement, thus forming the rest stage of the induction phase. Calcium ion and hydroxide ion dissolve successively at a low rate, and when the liquid phase is supersaturated with calcium hydroxide, calcium hydroxide crystal nucleus is formed rapidly.36) The growth of calcium hydroxide crystals will reduce the calcium ions and hydroxide ions in the solution, so that hydration is accelerated. The gradual decrease in the reaction rate is due to the accumulation of hydration materials around the cement, which prevents the further hydration of C3S, allowing the reaction to transition from an accelerated process to a deceleration process, which generally lasts from twelve to eighteen hours, and the hydration rate is also controlled by the diffusion rate of water molecules.
The reaction rate is very low in the stable stage. The initial product of C-S-H grows on the surface of cement particles, and then water molecules need to pass through this layer of C-S-H to enter the interior of the particles and continue to react with unhydrated C3S. The hydration reaction is completely controlled by the diffusion rate. The final hardened cement slurry is a heterogeneous multiphase system consisting of a solid phase of various hydrated products and no hydrated clinker, voids, water and air present in the voids.
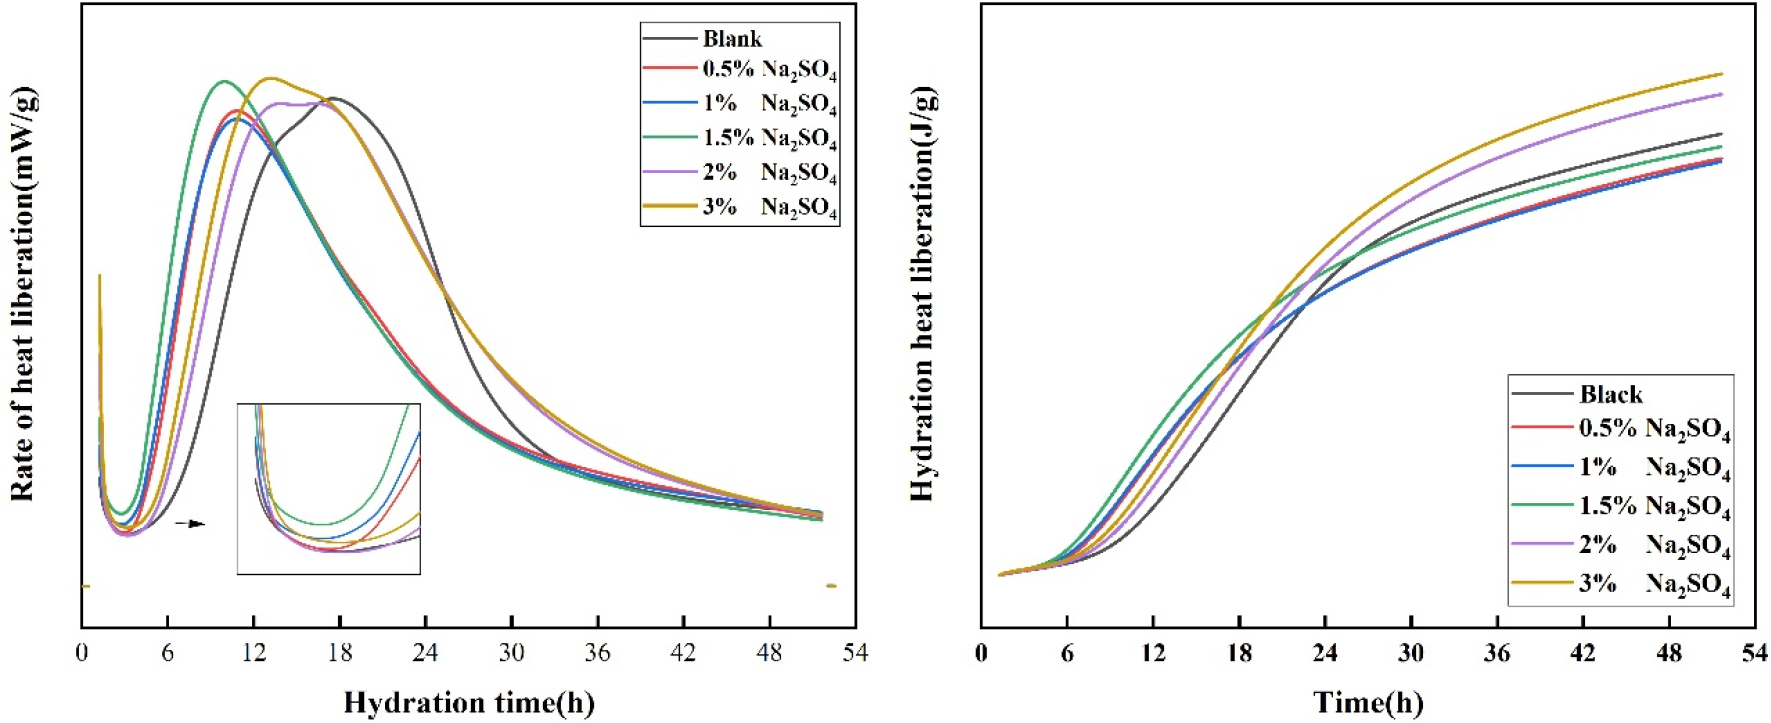
That is, the hardened cement slurry is a porous body composed of solid, liquid and gas. It can be seen from Fig. 4 that the addition of sodium sulfate has an earlier peak than that of the blank group, indicating that sodium sulfate promotes the hydration rate of the cement in the early stage. Therefore, the addition of sodium sulfate will speed up the setting time of cement, and the compressive strength of the early stage will also increase.
3.4 Chloride ion diffusion test
An important characteristic of concrete is that it is porous, and its pore structure and porosity are directly related to its permeability. From the perspective of microstructure, the porosity, pore size distribution and mineral composition of the aggregate matrix interface of concrete will affect the permeability, and the larger the pore, the stronger the permeability.18,37) The interfacial zone of ordinary concrete is loose and porous, and Ca(OH)2 in the interfacial zone is enriched and grown, which often becomes a channel for various harmful media to invade its interior, which has a great influence on the permeability. Secondly, we generally say that the “diffusion” of chloride ions in concrete is an inaccurate concept, including diffusion, convection, electromigration and other processes, which is to promote the diffusion of chloride ions from the bottom to the top by applying a potential difference at both ends of the test block. When there are free chloride ions on the surface of the concrete, the chloride ions will enter the pores and structural pores in the concrete under the drive of voltage, and further diffuse to the interior of the concrete. The cross-section of the test block is shown in Fig. 5.
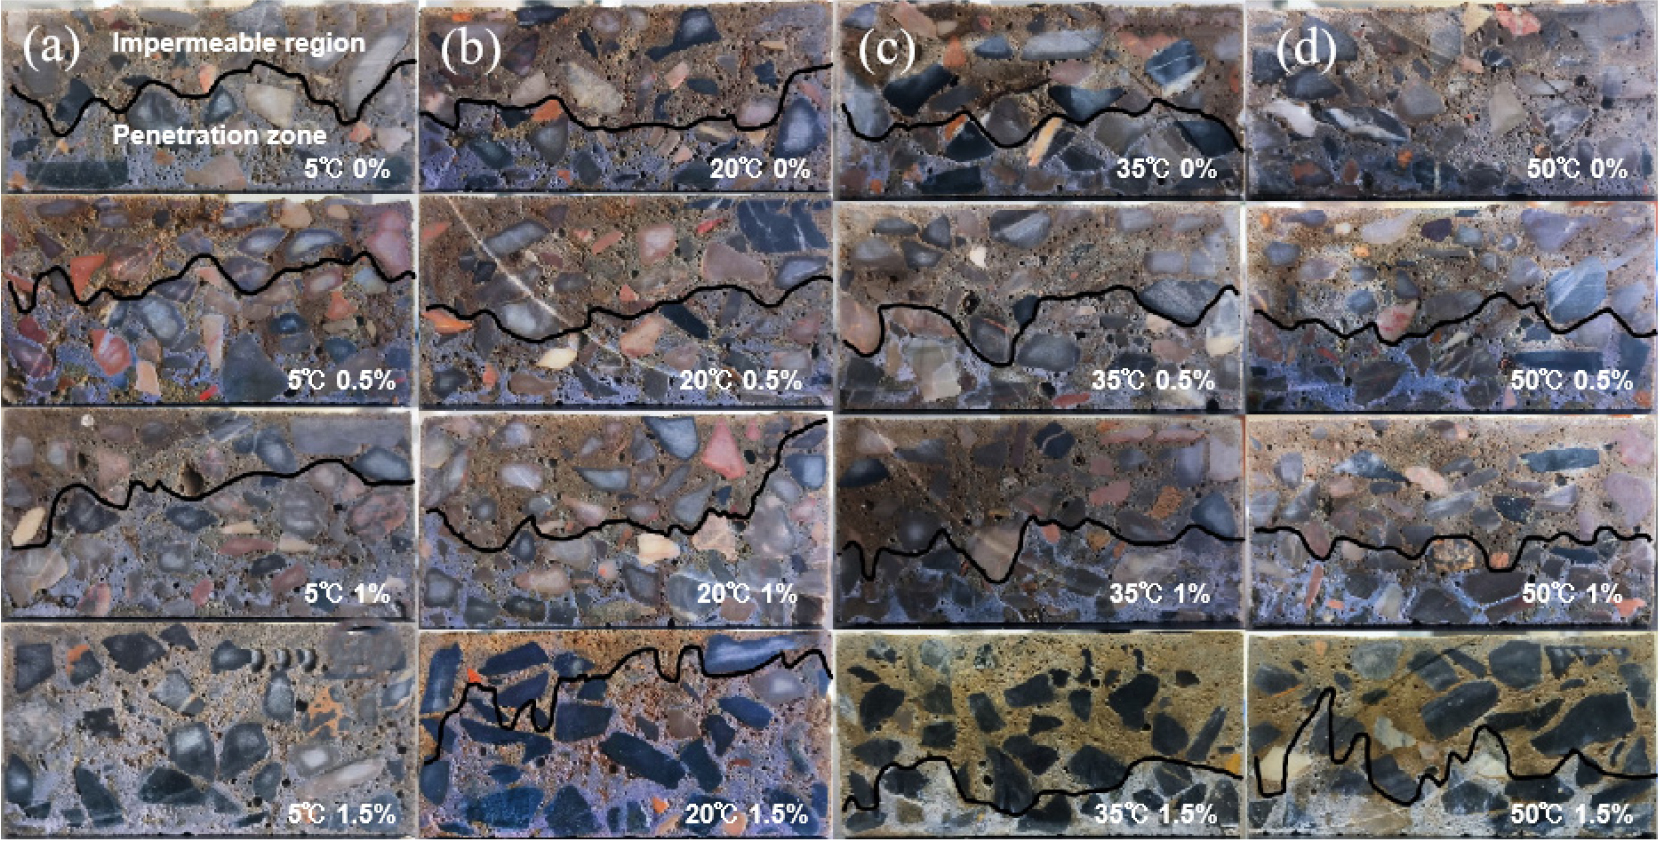
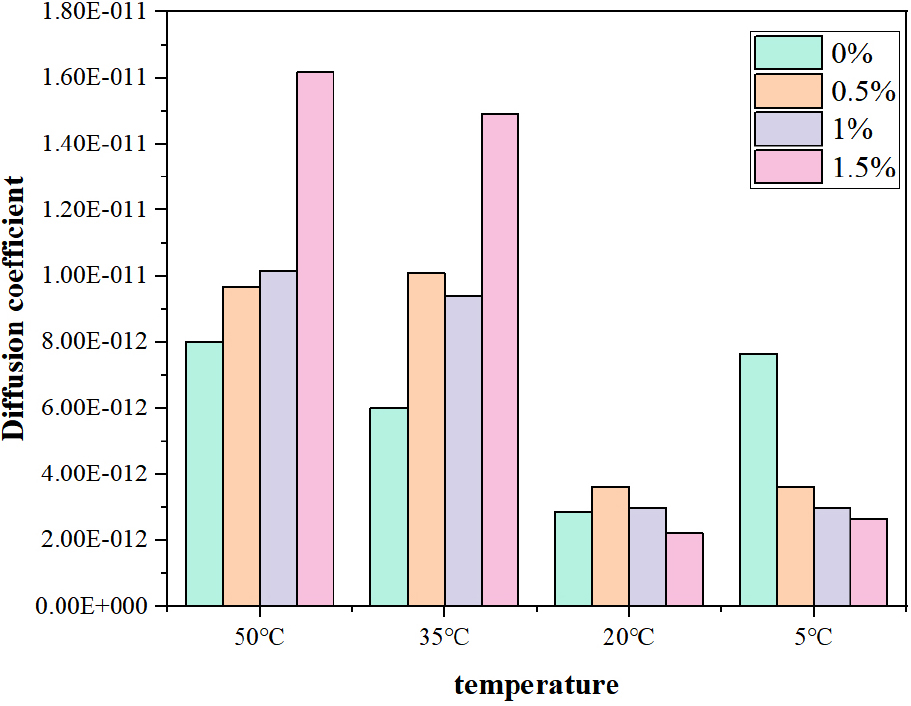
The diffusion coefficient of chloride ions is shown in Fig. 6. The results show that at 20 °C and 5 °C, the diffusion coefficient of chloride ion gradually decreases with the increase of sodium sulfate content, and at 35 °C and 50 °C, the diffusion coefficient also increases with the increase of temperature. This is because at lower temperatures, the hydration reaction is slow to make the structure dense, and the rate of formation of ettringite is also reduced by sodium sulfate, and the generated ettringite is also used to fill small gaps to reduce its permeability.38,39) However, under the condition of high temperature, the hydration reaction is rapid and the hydration is not thorough enough, which causes the porosity of concrete to rise, and a large amount of ettringite is generated, which changes the void structure and leads to a decline in the impermeability. Therefore, in the high temperature environment, sodium sulfate has a great harm to the durability of concrete, resulting in the deterioration of concrete.
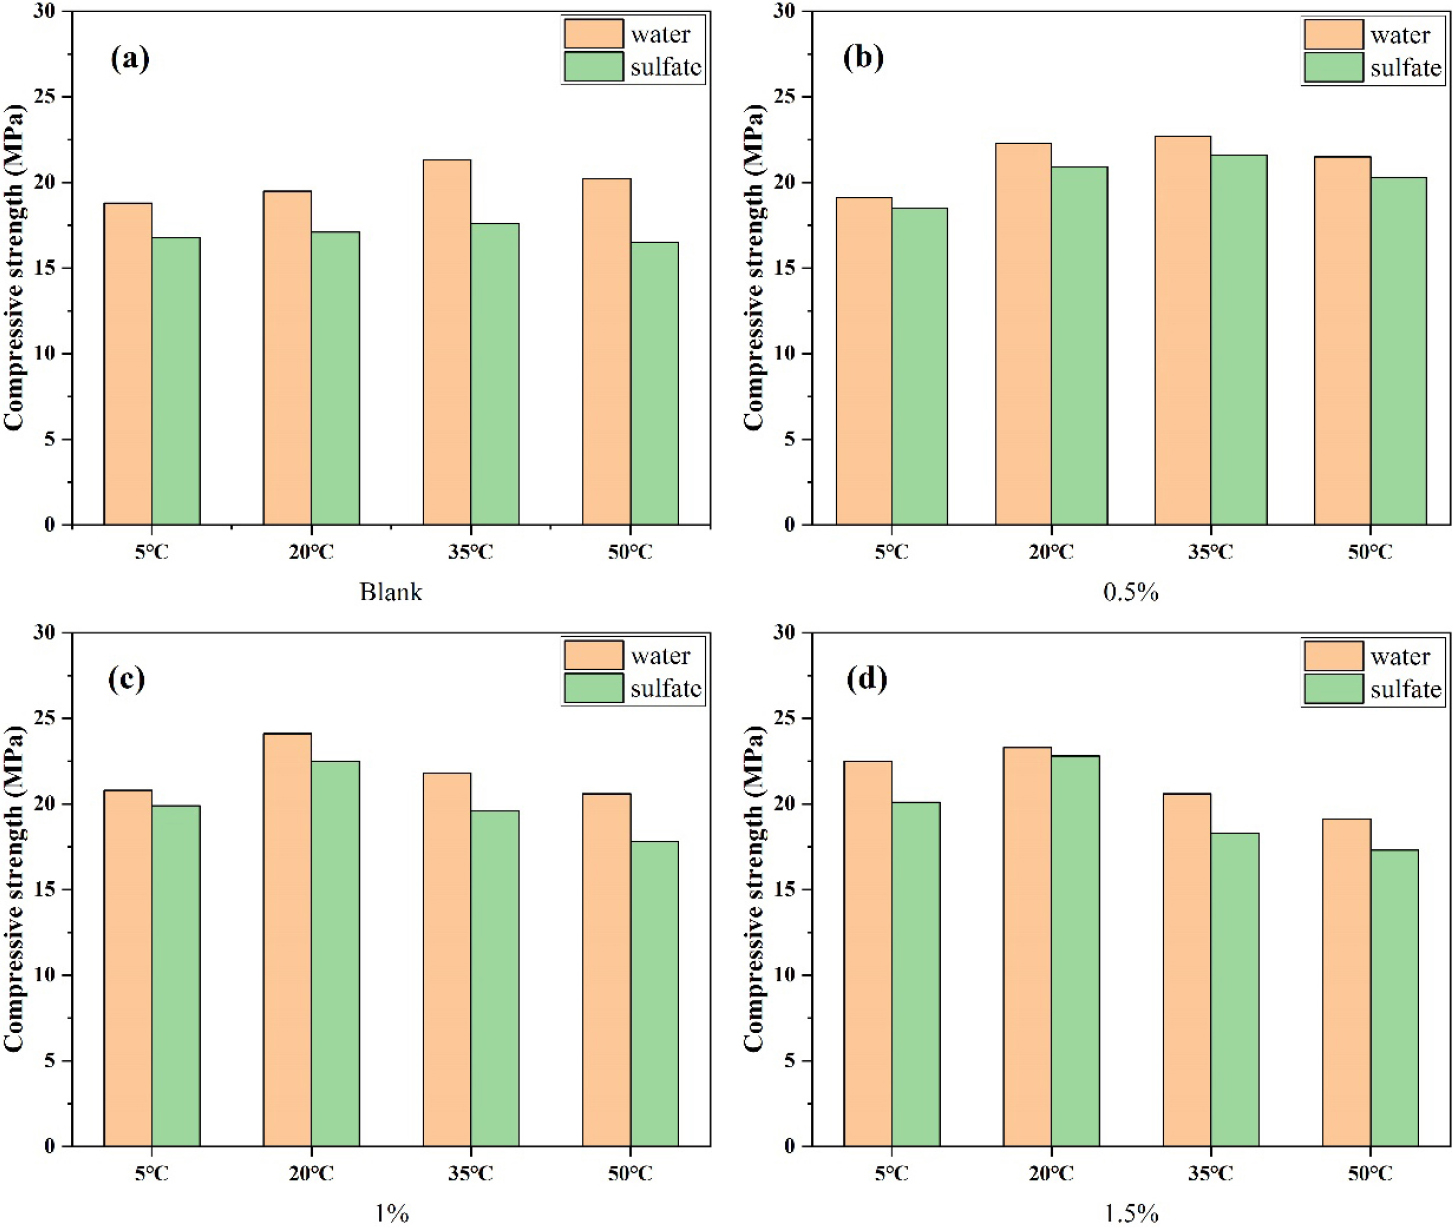
3.5 Sulfate resistance test
This experiment explores the durability of concrete by studying the resistance of test block to sulfate attack. Sulfate erosion of concrete will cause the decalcification of cement hydration product C-S-H. As a result, more gypsum is formed in the matrix, resulting in volume expansion, which reduces the strength of the test block and affects its durability. The compressive strength after curing under different curing conditions is shown in Fig. 7. It can be seen from Fig. 7(a) that the resistance to sulfate erosion of the test block gradually decreases with the increase of temperature when sodium sulfate is not added. At 50 °C, the sulfate resistance coefficient is reduced to 0.82. This is because at low temperature, the hydration rate of cement decreases and the reaction rate slows down. The slower reaction rate is beneficial to increase the density of the matrix. The higher the density of the matrix, the stronger its resistance to sulfate attack. After adding sodium sulfate, the sulfate resistance of the concrete test block has been significantly improved, and the sulfate resistance coefficient of the concrete test block added 0.5% sodium sulfate at 5 °C reaches 0.97. At the same curing temperature, the sulfate corrosion resistance coefficient of concrete test blocks added with different amounts of sodium sulfate is higher than that of blank group. This is because the addition of sodium sulfate makes the body become more ettringite, the formation of ettringite weakened the C-S-H decalcification phenomenon. The resulting ettringite can be used to fill and densify the matrix, further improving its erosion resistance.
3.6 Scanning electron microscope
Ettringite is the main product of sodium sulfate accelerated cement hydration, and its structure is mainly needle-like and rod-like.40) With the increase of temperature, the ettringite will become thin and sparse, and the signs of cross-growth will become weaker.
It can be observed from Fig. 8 that no ettringite was found in the pores of cement without ammonium sulfate after curing for 28 d at 5 °C, but a large amount of ettringite was generated after 1 % sodium sulfate was added. This indicates that the hydration rate of cement is low and the reaction is slow at low temperature. After adding sodium sulfate, a large amount of ettringite is formed to fill the pores, resulting in a more dense pre-structure and significantly enhanced permeability resistance.41,42) Sodium sulfate can improve the impermeability of concrete at low temperature, which is consistent with the experimental results of chloride ion diffusion.
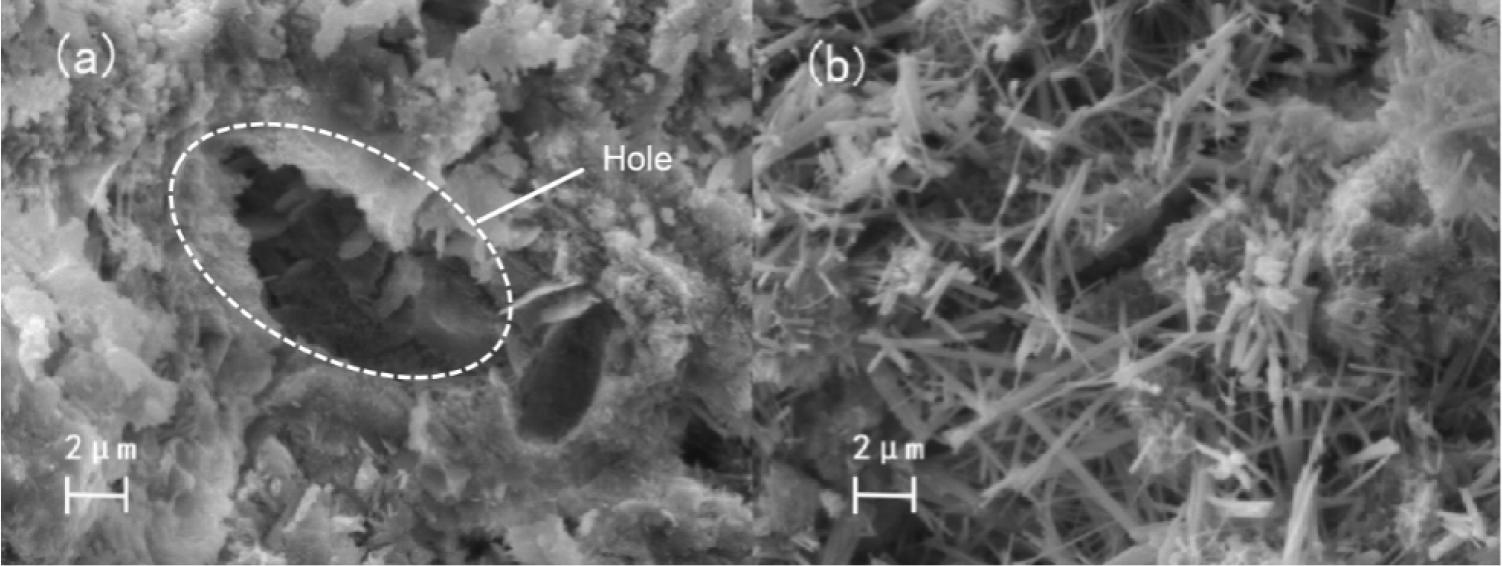
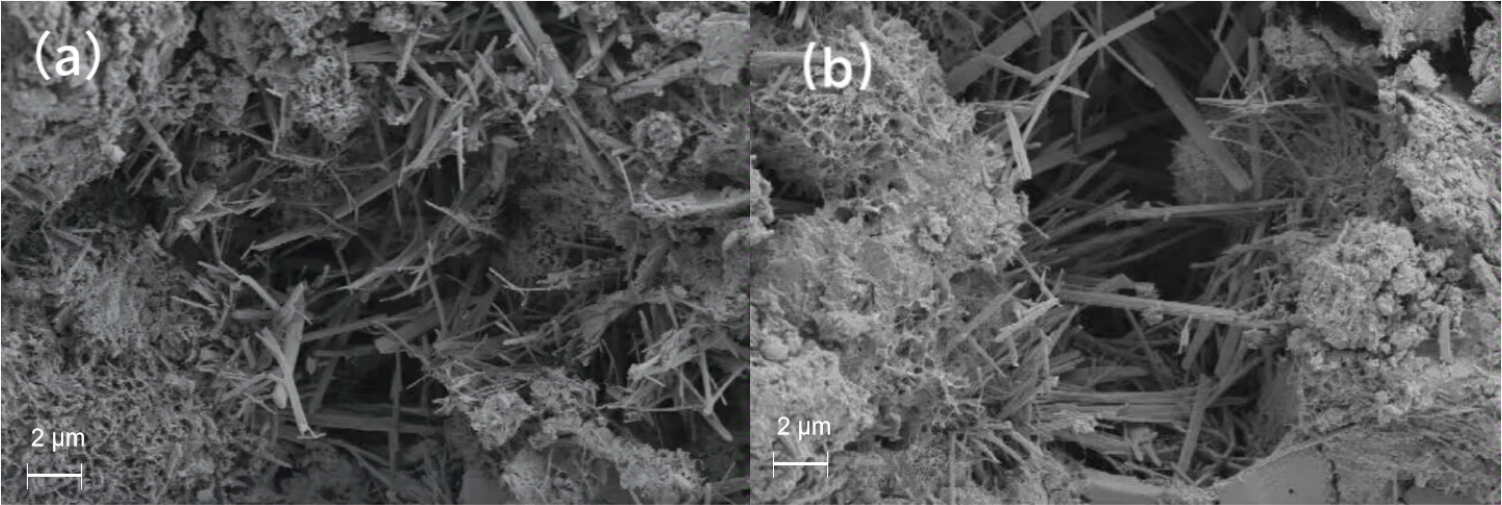
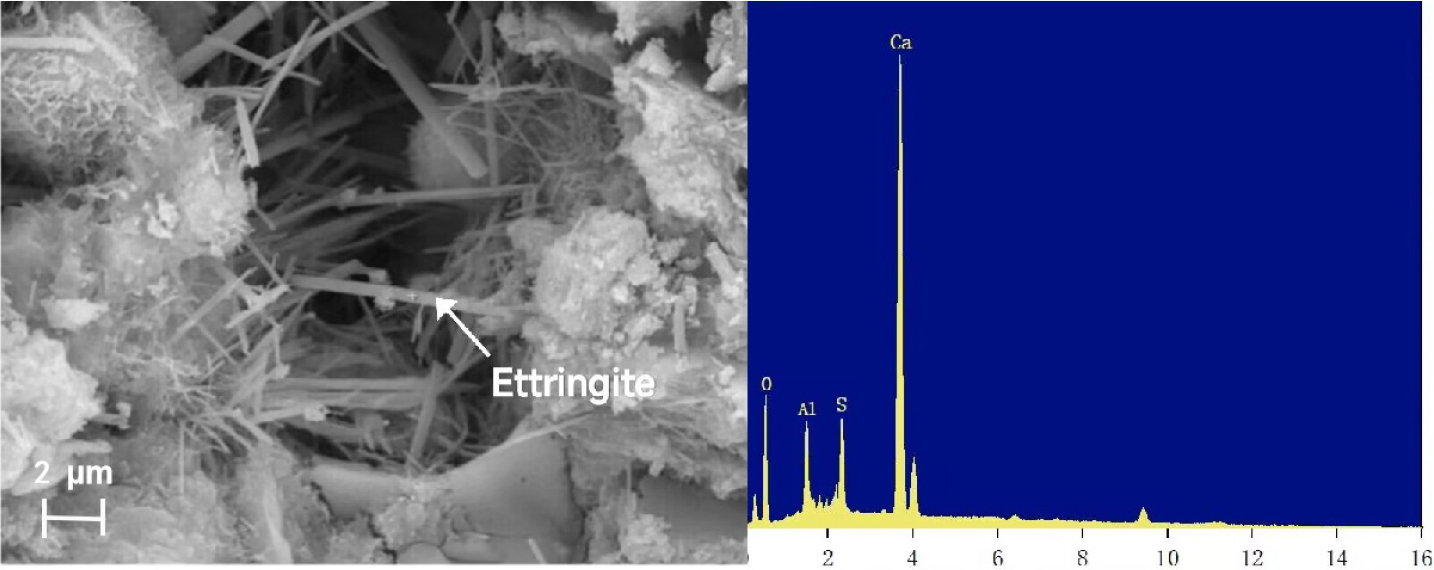
Temperature also has an important effect on the formation of ettringite. Fig. 9 shows the microscopic morphology after adding 1 % sodium sulfate at 5 °C and 50 °C. It can be obviously observed that under the condition of 5 °C, ettringite cross-growth, close links between each other. Under the condition of 50 °C, ettringite grows in the same direction, and the signs of cross-growth are obviously weaker.43,44,45) This is because the increase of temperature will increase the collision probability of the reactant ions forming ettringite, and then promote the rapid formation of the central column and groove part of the ettringite structure. Under high temperature conditions, ettringite grows in the same direction and the length-diameter ratio becomes larger. Fig. 10 shows the EDS of rod-like substances, and the results show that its elements are basically consistent with the elements of ettringite, so it can be judged that the short rod-like substances in the figure are all ettringite.
3.7 Potential limitations or challenges
(1) Pay attention to the construction temperature when adding sodium sulfate as a crystalline waterproof material. At 35-50 degrees Celsius, the setting time is significantly shortened, and the shorter setting time reduces the constructability of concrete.
(2) Pay attention to the amount of sodium sulfate when adding it. Excessive dosage will lead to the formation of excessive ettringite in concrete, which will damage the durability of the matrix.
4. Conclusion
Through the setting time compressive strength test, the development of cement in the early stage is roughly obtained. The hydration process was further obtained by hydration thermal analysis and electron microscope scanning. The final hydration of cement was investigated by chloride ion resistance test. The following conclusions can be drawn:
(1) To make a comprehensive evaluation of the constructability of sodium sulfate added concrete by measuring the setting time at different temperatures. The amount of sodium sulfate is generally controlled at 1 %, which has a promoting effect under various temperature conditions, and is the best use of sodium sulfate.
(2) The rise of temperature will further promote the strength development of mortar and concrete in the early stage, but too high temperature has an adverse impact on the long-term development of concrete, and excessive sodium sulfate will also lead to the deterioration of concrete in the later stage, resulting in strength loss.
(3) As a self-healing material, the ettringite generated by sodium sulfate can effectively fill the pores and cracks, and improve the impermeability of concrete at normal and low temperatures. However, under high temperature conditions, the degree of deterioration is greater than the degree of healing, which is not conducive to the healing of concrete.
