

1. Introduction
Perovskite materials have a wide range of physical and chemical properties. Due to their extremely flexible structural possibilities, these materials exhibit a wide range of electrical and magnetic activity. Their wide-ranging uses span a variety of disciplinary domains, including optoelectronic and photochromic applications, industrial electrical uses, energy-related uses, and diverse sectors of sensors, biosensors, and catalysts. The general formula for perovskites is ABX3,1) where X can either be oxygen or a halogen, and A and B are cations. They fall under the perovskite oxide or perovskite halide family based on this. Gustav Rose found the first perovskite, CaTiO3, in 1839, and Count Le Alexerch von Perovskite was the inspiration for the name “perovskite”.2-4) According to the reports, perovskite materials exhibit insulator, semiconductor, metal, and superconductor activity. Surface acoustic wave signal processing, switching, and filtering devices are among the areas in which they have applications.5) Heterogeneous catalysis of nitrogen oxide reductions is one of the industrial applications of perovskite materials as a catalyst.6-9) These substances are known as cleaning catalysts because they are utilized in car exhaust gas catalysts to selectively remove impurities from gaseous mixtures. Perovskite materials can also catalyze oxygen evolution reactions and oxygen reduction reactions, which are employed in fuel cells, rechargeable batteries, water electrolysis, the production of organic compounds, and rechargeable batteries.10) Additionally, these substances are employed in hydrogen evolution processes. The topic of sensors and biological sensors has seen a wide range of research.11,12) Perovskite has been used in a number of studies as a gas sensor and neurotransmitter sensor. The perovskite materials have also aided research into fuel cells and solar cells.13) The optoelectronic and photovoltaic uses of metal halide perovskites are well recognized.14,15) Multi-perovskite compounds, composed of layers of perovskite swapping atoms at the sites between the layers, make up the crystal structure of superconducting substances. The oxide of lanthanum, barium, and copper is one of these substances.16-20)
The preparation of a Lanthanum-barium-copper oxide compound, abbreviated as LBCO and examination of the structural characteristics of its three phases (LaBa2Cu2O9, LaBa2CaCu3O12 and LaBa2Ca2Cu5O15) will be the main topics of this article.
2. Experimental
The polycrystalline LaBa2Cu2O9, LaBa2CaCu3O12 and LaBa2Ca2Cu5O15 samples were prepared using a solid-state reaction technique from the nominal starting compositions of high purity oxides (99.99 %) with appropriate proportions of LaO, CaO, BaO and CuO. The oxides were mixed using an electric mixer for an hour in order to obtain a homogeneous mixture. For the three vehicles. And heated at 820 °C. For more than 8 h. The heated precursor was then thoroughly combined and formed into pellets with the dimensions of 15 mm in diameter and 3 mm in thickness. The pellets underwent a 48 h, 950 °C furnace heating and 48 h, room-temperature cooling process. The pellets were heating in the furnace at 950 °C for 48 h and cooled by the same rate at room-temperature. Samples were tested using X-ray diffraction technique (Philips) with the following properties: source current Cukα (20 mA), voltage (40 KV), and λ = 1.5405 Å. Lattice parameters a, b and c were calculated by using a computer program based (Cohen’s least squares method). Scanning electron microscope (Philips XL 30) to examine the surface topography of the samples.
3. Results and Discussion
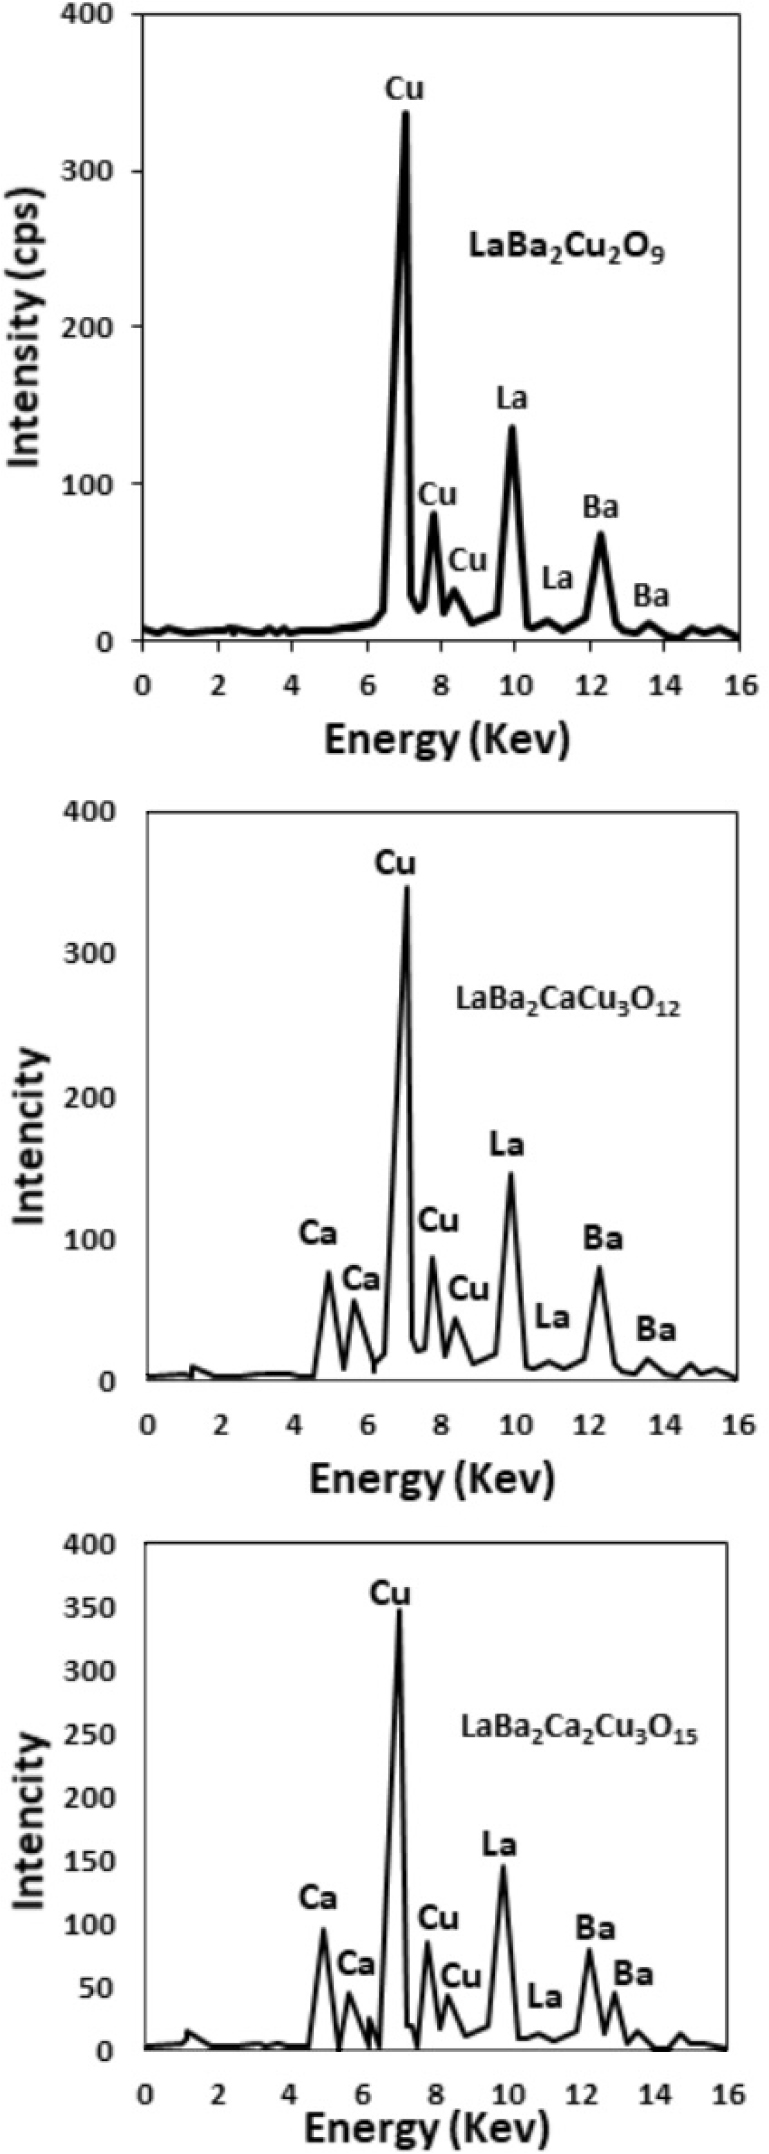
X-ray fluorescence (XRF) analysis was used to evaluate the LaBa2Cu2O9, LaBa2CaCu3O12 and LaBa2Ca2Cu5O15, composition of the samples. The results are displayed in Fig. 1. The samples’ XRF examination reveals that the ratios of La: Ba: Ca: Cu are approximately 1:2:0:2, 1:2:1:3, and 1:2:2:5. for the samples LaBa2Cu2O9, LaBa2CaCu3O12 and LaBa2Ca2Cu5O15, respectively.
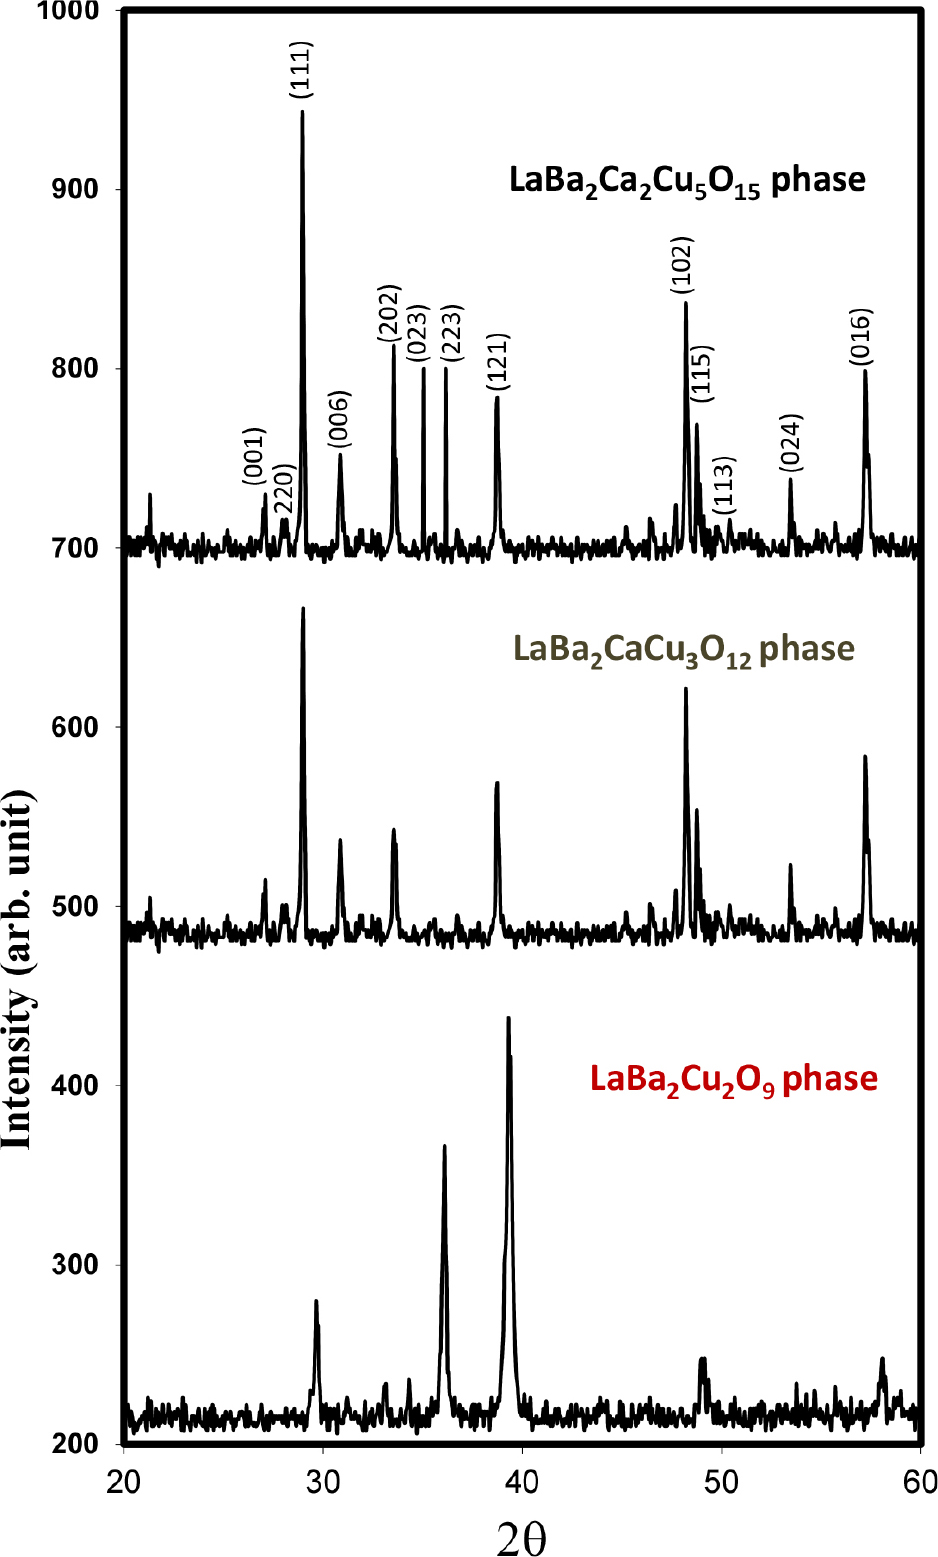
The well-known structures of LaBa2Cu2O9, LaBa2CaCu3O12 and LaBa2Ca2Cu5O15 phases were tested by X-ray diffraction. The X-ray diffraction patterns powder of laboratory-prepared 1202, 1213, and 1225 phases are displayed in Fig. 2. The three samples were found to primarily consist of the primary phases 1202, 1213, and 1225, with a minor amount of an unidentified secondary phase also present, according to the intensities and positions of the diffraction peaks.
A Cohen’s least squares-based algorithm was used to determine the lattice parameters for phases 1202, 1213, and 1225 using the (hkl) reflections and d values of observed X-ray diffraction patterns.21,22) All of our samples exhibit a tetragonal symmetry structure according to the measured parameters a, b, c, and ratio c/a. Along with the crystal lattice parameters a, b, and c and the ratio c/a, the mass density of each sample was also computed and presented in Table 1.
Table 1.
Values of crystal lattice parameters a, b, and c, ratio c/a, the mass density for LaBa2Cu2O9, LaBa2CaCu3O12 and LaBa2Ca2Cu5O15 samples.
| Phases | Samples | a (Å) | b (Å) | c (Å) | c/a | Mass density (g/cm3) |
| 1202 | LaBa2Cu2O9 | 3.72 | 3.72 | 10.892 | 2.490 | 6.15 |
| 1213 | LaBa2CaCu3O12 | 3.86 | 3.86 | 15.586 | 3.306 | 6.47 |
| 1235 | LaBa2Ca2Cu5O15 | 3.65 | 3.65 | 21.679 | 4.146 | 6.62 |
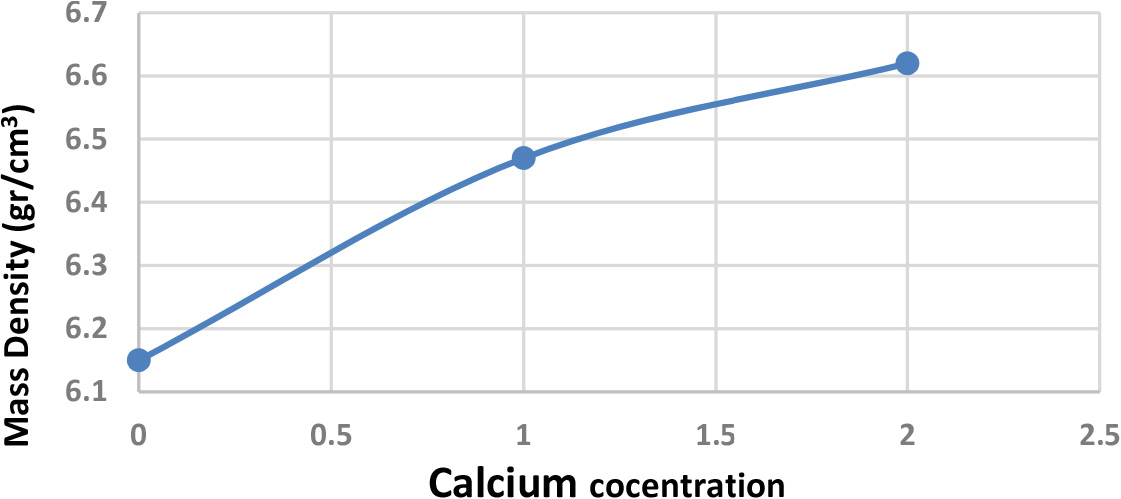
Fig. 3 illustrates the relationship between mass density and calcium concentration. It was shown from this figure that the increase increasing calcium content produced high mass density M, due to the growth of layers of calcium and copper oxides in the crystal structure, which caused an increase in the mass density with an increase in calcium concentration.23-26)
The crystal structure of the three samples LaBa2Cu2O9, LaBa2CaCu3O12 and LaBa2Ca2Cu5O15 are shown in Fig. 4, which was drawn based on the intensity values and individual X-ray diffraction angles taken in the XRD pattern using FullProf software. This figure shows the effect of increasing calcium and copper layers along the c-axis.27,28)
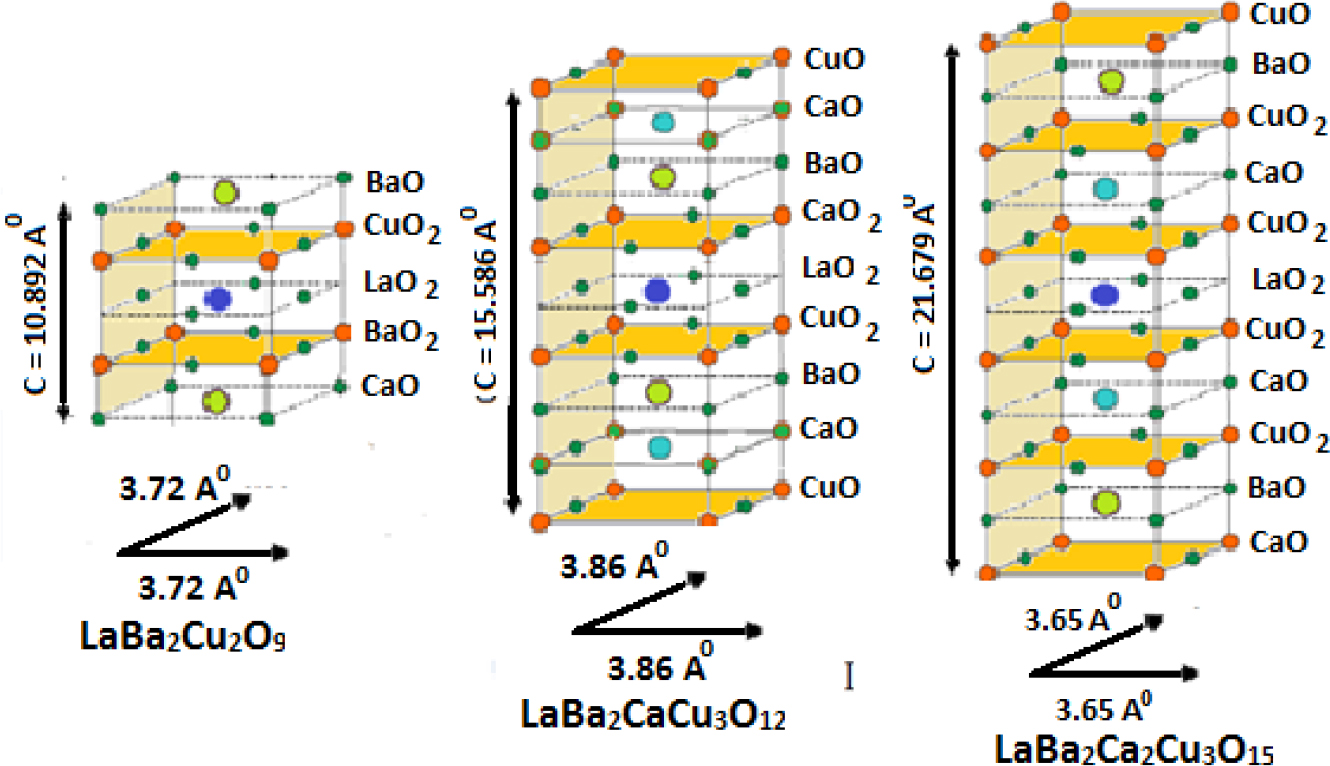
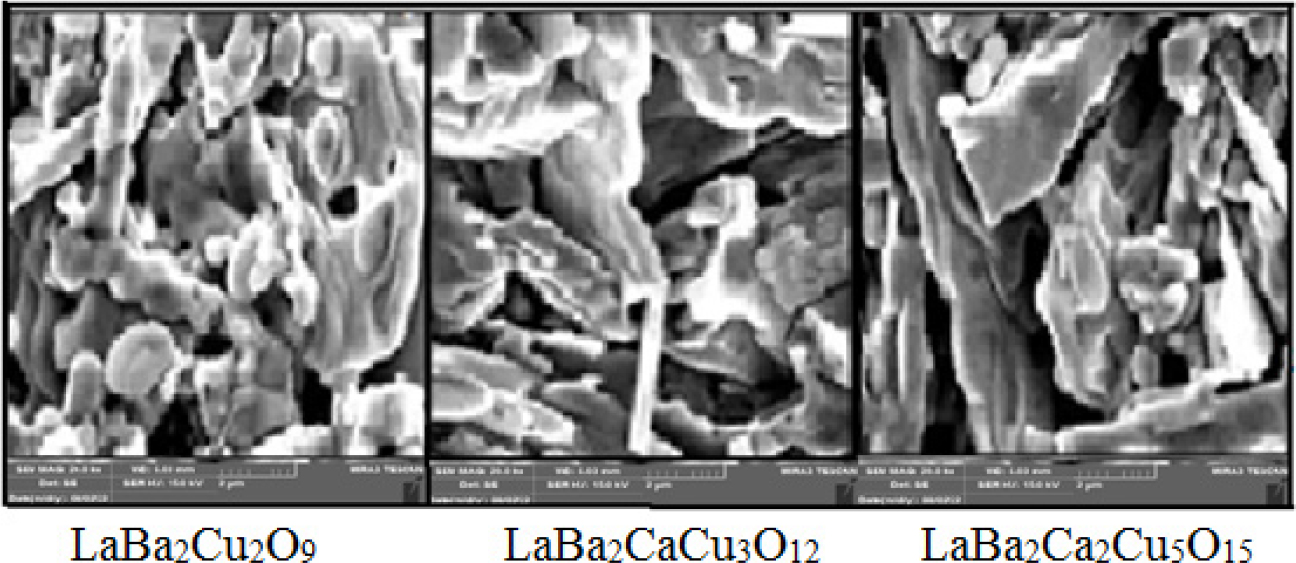
Fig. 5 displays SEM images of the LaBa2Cu2O9, LaBa2CaCu3O12 and LaBa2Ca2Cu5O15 phases. It is discovered that different Ca-O and Cu-O layers cause different grain sizes which were calculated using the scale shown at the bottom of Fig. 5. Within the limits of Scanning electron microscope (SEM) magnification, this figure depicts formation of the three phases, each of which is the characterized by thin, elongated grains without the preferred orientation.29,30) According to Table 1, the 1225 phase specimen contained larger grains than those of the 1202 and 1213 phases because of an increase in contact areas, which results in a higher density.31)
4. Conclusions
Three of LaBa2Cu2O9, LaBa2CaCu3O12 and LaBa2Ca2Cu5O15 phases were prepared by the solid-state reaction method. Changes are made to the values of the mass density and the lattice parameters (a, b, c, and c/a) by increasing calcium concentration. All samples according to XRD examination, have a tetragonal structure. The ratio c/a of the lattice parameters and c-axis lattice constant both increased as the Cu-O layers number increased. secondary electron SEM images of the phases discovered that increasing in the Ca-O and Cu-O layers cause different grain sizes, within the limits of SEM magnification.
