

1. Introduction
Magnesium is the seventh most abundant element on the planet. It is the lightest among metals and has high specific strength, so it can achieve high strength even with a small amount compared to other materials. Additionally, some features such as dimensional stability, electromagnetic wave shielding, machinability, vibration absorption, recyclability, eco-friendliness, biocompatibility, flame resistance have been employed for the manufacturing of transport equipment such as automobiles, ships, drones, aircraft, etc.1) The demand and production of magnesium and magnesium alloys are rapidly increasing in various technological fields like materials science, biosensing and electronics.2)
However, magnesium is the most chemically active among commercial metals, so it has a disadvantage of low corrosion resistance in an oxidizing environment. In order to improve these shortcomings, numerous surface treatment methods such as plating method, chemical conversion method, painting method, physicochemical vapor deposition method, aerosol deposition method, anodic oxidation method, etc. have been developed and used.3) However, these methods have certain downswings, for instant because of the uncontrolled reaction kinetics of the chemical conversion methods it is difficult to achieve the desirable characteristics of the forming layer.4,5) Thereby, the experimental reproducibility of the chemical conversion methods (including the non-chromiumbased) is highly questionable. In recent times a new eco-friendly surface treatment method based on plasma electrolytic oxidation (PEO) process has been employed by some researchers.6,7)
The plasma electrolytic oxidation method induces microarc discharge on the surface of metal immersed in an alkaline electrolyte. In this view, a passivation (oxide) layer has been formed on the surface of the metal thereby the physical/chemical characteristics such as hardness, friction, wear resistance, insulation, thermal resistance, fatigue strength, and surface uniformity can be controlled. Considering the fact that the PEO process chiefly involve the reduction of electrolytic solution (an/or formation of oxide layer) one can alter the film characteristics simply by modifying the electrolytic solution. Additionally, the PEO process is an eco-friendly and economically feasible surface treatment technology compared to other processes which utilizes harmful acids. Nonetheless, the plasma electrolytic oxidation (PEO) film is superior to other surface treatments. Moreover, it has also been known that the film formed through PEO process are highly porous, so the electrochemical properties or mechanical properties required for commercialization are insufficient.8-10) Therefore, in order to solve this problem, a few studies have been being conducted by optimizing the solution conditions i.e. adding some chemical agents and additives when preparing the electrolyte solution, and/or reducing pores through double coating and post-treatment.11-14) In this work we employed an organic electrolytic substitute during the PEO process. The biocompatible organic compounds are rarely used in PEO process which makes the current work relatively more attractive. We highlighted the effects of organic electrolyte on the mechanical and corrosion resistive properties of the metal surface. Our findings in this work advices a high potential of organic electrolytes compared to the conventional electrolytes used in PEO process.
2. Experimental Procedure
In this study, PEO coatings were carried out under various amounts of alginic acid (a bio-polymer material) in the electrolytic solution. For this purpose, the electrolytic solution was mixed with deionized water with 15 g/L Na2SiO3, 0.3 g/L Na2SiF6, 3 g/L NaOH, and 0 ~ 8 g/L alginic acid. Magnesium alloy specimen (AZ31, Ф = 10 mm) is prepared by polishing a coin-shaped processed specimen to #2000 using SiC abrasive paper. Followed by cleaning and immersing the substrate in an electrolytic plasma system. Then, AC 200 V and DC 260 V were applied simultaneously and coating is performed for 15 minutes.
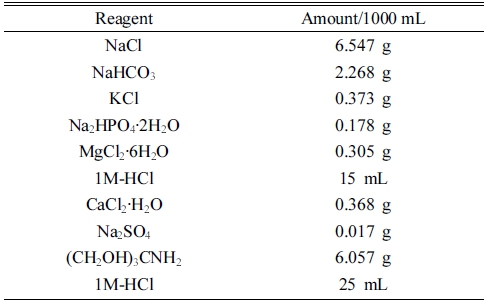
The coated specimen was cut, mounted, mirror polished, and then the shape, thickness, and porosity of the surface and cross-section were measured using a scanning electron microscope (SEM). The crystal structure of the coating layer was measured in the range of 20 ~ 80° using CuKα (λ = 1.5405 Å) as an X-ray wavelength using XRD equipment. The hardness was measured by pressing the single-sided coating layer with a load of 0.025 N for 10 seconds using a Micro Vickers hardness tester and averaged 10 times. As an electrochemical test in SBF solution (Table 1), a potentiostat was used to measure the polarization behavior of the coincidence.
3. Results and Discussion
Fig. 1 is an image of a coated specimen taken with a digital camera. As the amount of alginic acid increases, the color of the coating layer becomes darker and peeling occurs after 8 g/L.
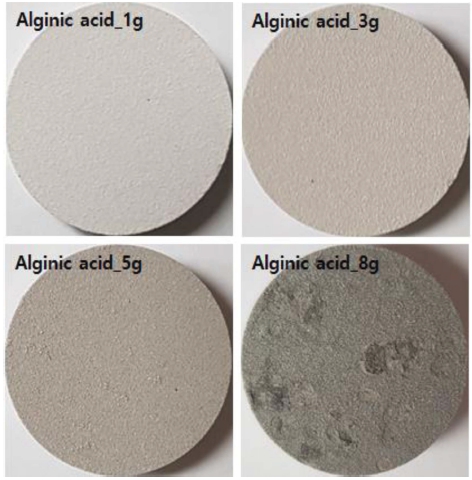
Fig. 1
Digital camera photo of the PEO coated surface according to the change in the amount of alginic aicd.
Fig. 2 shows the SEM image of the coating layer according to the change in the amount of alginic acid. It was confirmed that craters and nodules generated during the plasma electrolytic oxidation process were formed entirely on the surface of the coating layer.
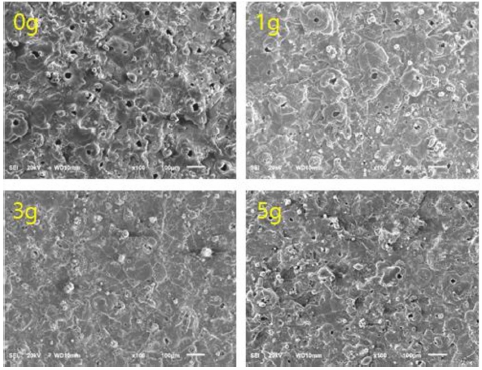
Fig. 3 is a cross-sectional SEM image of the of the coating layer. The thickness of the coating layer was confirmed to be increased as the amount of alginic acid has increased. In addition, the density of the coating layer close to the surface has grown indefinitely, while the large pores have also been formed locally. Here, the layer forming process may have proceed in two steps, First, the reduction of alginic acid followed by the formation of OH- ions. The electrolytic ions initiate the formation of oxide layer at the surface. Meanwhile, the pores are formed independently as the reaction proceeds. Thus, the increase in the thickness of the layer can be describe as: at sufficiently low concentration (1 g/L) of alginic acid, the OH- ions were small, so the thickness is also less. But as the concentration of alginic acid has increased, thickness of coating layer abruptly raises up to 100 μ m (see Fig. 3) because of availability of enough electrolytes in the solution. Thereby increasing the density of layer around the surface and/or reducing the porosity.
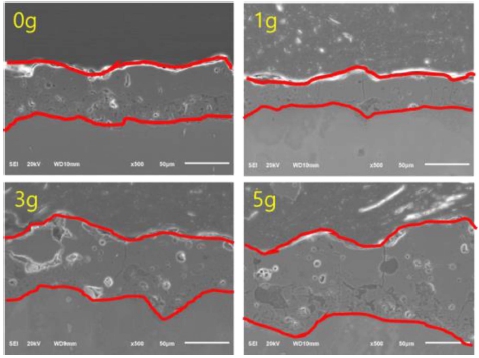
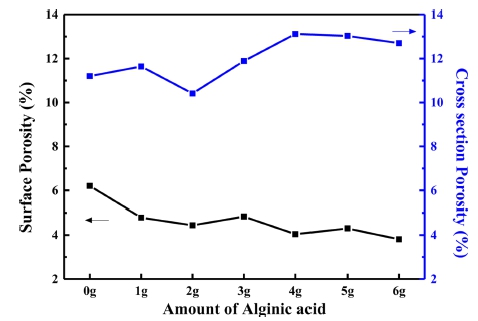
Fig. 4 shows the surface and cross-sectional porosity as a graph according to the amount of alginic acid. The surface porosity tends to decrease as the alginic acid concentration increases, and the cross-sectional porosity first decreases and then increases as the alginic acid concentration increases. However, since the overall porosity of the cross-section is around 10 % - 14 %, therefore at the macroscopic level the change in cross-sectional porosity can be considered insignificant. The minimum porosity (surface and cross-sectional) has been observed for an alginic acid concentration of 2 g/L. For this concentration the surface porosity has been found to be about 3.4 %, and subsequent changes were insignificant for high amounts of alginic acids. Similarly, the cross-sectional porosity was identified to be 10.41 % at 2 g/L. These results indicates that the porosity in general decreases upon raising the concentration of alginic acid, however above a critical concentration, the variation in porosity were roughly constant.
Next, we have measured the mechanical properties of the coating layer. The variation in the thickness and hardness with respect to the amount of alginic acid are shown in Fig. 5(a) and (b). The thickness continuously increases with the incorporation of alginic acid in the electrolytic solution and reached upto 107.6 μm for the highest concentration (6 g/L) of the alginic acid. In a similar fashion the hardness also tends to increase, and the highest hardness value of 1,059.2 Hv was recoded for 5 g/L of alginic acid concentration.
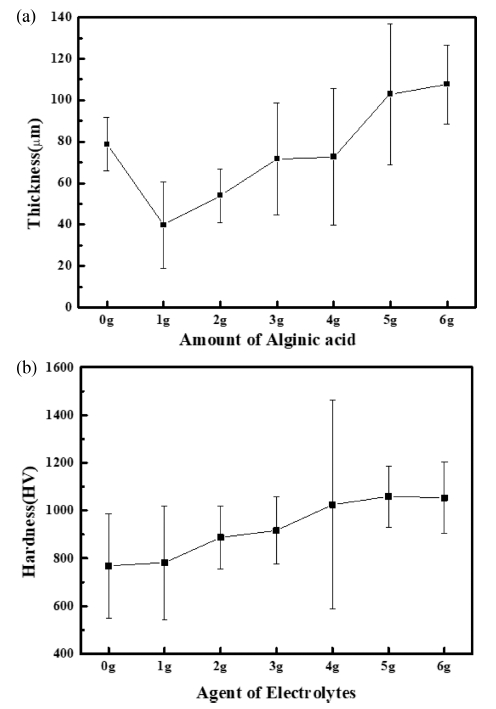
Fig. 5
(a) thickness and (b) hardness of the oxide layer according to the change in the amount of alginic acid.
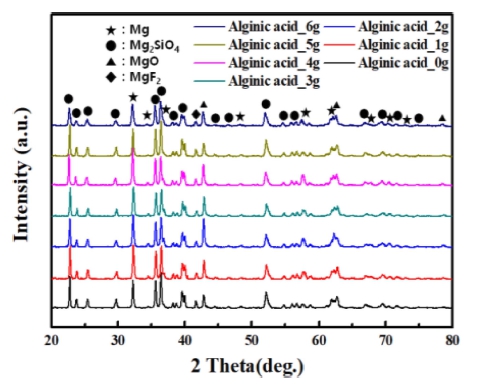
To analyze the phases constituting the coating layer the X-ray diffraction patterns has been analyzed and the diffraction profiles are presented in Fig. 6. In all samples the MgO, Mg2SiO4, and MgF2 composite phases were chiefly formed in the coating layer. We did not notice any significant change in the characteristic peaks of XRD profiles with increasing the concentration of alginic acid, which simply indicates that the polymer did not directly contribute to the growth of oxides. Thus, the coating layer may have formed by the following reaction equations.
First, the process of ionization of all the electrolytes and chemical reagents has been initiated according to eqs. (1)-(4). Then, to adjust the pH the hydroxide ions are generated from NaOH. Finally, the ions present in the electrolytic solution react to form a crystal phase with respect to eqs. (5)-(7).
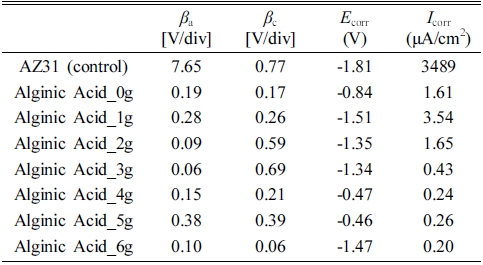
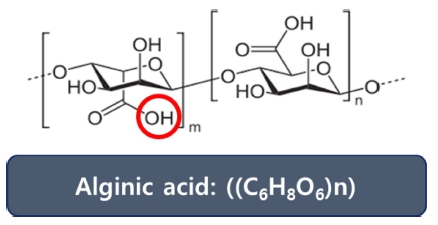
Fig. 7 electrochemical polarization curve of the coating layers and the derived electrochemical parameters are given in Table 2. We observe that the corrosion potential drastically enhances upon increasing the alginic acid content in the electrolytic solution. The corrosion potential (Ecorr) moved from -1.81 VSCE to -0.46 VSCE, and the corrosion current (Icorr) decreased from 3490 μA/cm2 to 0.24 μA/cm2 as the amount of algin acid increases from 0 g/L to 5 g/L respectively. the increase in the electrochemical parameters has been described as the following: The highly complex polymer structure of alginic acid (shown in Fig. 8) has a negative potential at the surface due to the OH ions. During the process of electrolysis, the polar components of alginic acid polymer chains combines with the electrolytic ions present in the solution through the electrostatic interactions. The alginic acid-electrolyte complex yields a hydrogel which induces an agglomeration phenomenon at a high concentration thereby hindering the movement of current.
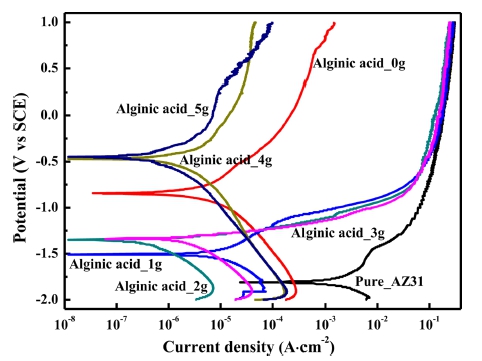
Table 2
Electrochemical parameters obtained from the same potential polarization curve as the amount of alginate.
 |
When the amount of alginic acid is appropriate, a dense oxide film is formed due to the increase of OH- ions in the electrolyte solution. But when the amount of alginic acid exceeds a certain concentration, an insulating layer is formed on the coating layer due to agglomeration. The agglomeration of these components causes a nonuniform distribution of electrolytes to the surface. Thus, the agglomeration interferes with the current/electrochemical potential and causes delamination in the local area.
In other words, it means that the charge concentration of the electrolyte can be controlled according to the amount of the polymer, and it contributes to the reaction rate with the deposition of cations at the anode surface.15,16)
4. Conclusion
In summary, the mechanical/electrochemical properties of the coating layer deposited through plasma electrolytic oxidation process have been successfully enhanced. The porosity and thickness of the coating layer have been modified through the addition of various concentrations of a bio-compatible polymer (alginic acid) to the electrolytic solution.
In the absence of alginic acid the mechanical and electrochemical properties were far lower and these properties abruptly improved when the coating was performed in an electrolytic solution containing alginic acid. The thickness of the coating layer was increased upon increasing the amounts of alginic acid. However, above a certain concentration, it seems that the properties of the coating layer are deteriorated due to aggregation due to alginic acid.
Therefore, our findings suggests that in order to achieve desirable mechanical, electrochemical and controlling the coating characteristics, one can simply set an optimum concentration of alginic acid in the electrolytic solution.
