

1. Introduction
2. Experimental Procedure
2.1. Chemicals
2.2. Synthesis of 0N-Cu-MOF
2.3. Synthesis of 1N-Cu-MOF
2.4. Synthesis of 2N-Cu-MOF
2.5. Characterization techniques
2.6. Development of the working electrode
3. Results and Discussion
3.1. Characterization
3.2. Electrochemical Efficiency
4. Conclusion
1. Introduction
As fossil fuel reserves continue to deplete rapidly and the greenhouse effect worsens, the conversion of CO2 into valuable products using intermittent or renewable electricity such as through electrocatalytic CO2 reduction (ECR) has emerged as a highly promising and effective solution.1,2) This process enables the production of valuable raw materials and fuels, including C1 products like HCOOH, CO, and CH4, as well as C2+ products such as ethylene (C2H4) and C2H5OH.3,4) While significant advancements have been made in generating C1 products, the production of high-value C2+ products remains a challenge, particularly C2H4, a key feedstock in petrochemical industries. This difficulty is primarily due to the complex electron and proton transfer processes, along with the challenging C-C coupling reactions involved in ECR.5,6,7) Extensive studies have shown that copper (Cu) sites show favorable adsorption properties during the ECR process. Specifically, they have positive and negative adsorption energies for the key *H and *CO intermediates, respectively, which aid in both protonation and C-C coupling reactions.8,9,10) Thus, Cu-based materials are regarded as one of the most promising catalysts for converting CO2 into C2+ products.
Currently, several promising strategies have been devised to enhance the efficiency of Cu-based catalysts for ECR to C2H4, including tandem effects, heterostructure building, crystal surface engineering, and generating catalysts with several active sites.11) Studies have indicated that Cu-based compounds with two or more active sites can effectively promote synergistic interactions between Cu+ and Cu0 species, enhancing the ECR to C2+ products.12) Metal-organic frameworks (MOFs) are thought to be the best of these electrocatalysts to produce these multi-active site systems because of their highly organized porous structures and adjustable active centers.13,14,15)
MOFs are a highly promising group of porous crystalline nanomaterials, generated by the self-assembly of inorganic clusters (nodes) or metal ions with organic ligands (linkers). With their well-defined regular channels and crystal structures, MOFs provide excellent platforms for investigating the relationship between structure and performance.16) MOFs offer increased specific surface area (SSA) and porosity compared to many other materials, and their adaptable structure enables precise control over their physical and chemical properties by modifying the nodes, pore environment, and linkers.17) However, the practical application of pristine MOFs in CO2 reduction is limited by their inherently low electrical conductivity, the dominance of the hydrogen evolution reaction (HER) caused by hydrophilic functional groups, and the inaccessibility of active metal centers due to obstruction by organic linkers.18) Recent studies on defective MOFs, such as those with missing clusters and missing-linker defects, have gained increasing attention for imparting new characteristics to the parent MOFs while maintaining the integrity of their porous structures.19) In particular, adding linker vacancies to MOFs can tune the d-band center and reveal undercoordinated metal sites, which improves CO2 adsorption, decreases hydrophilicity, stabilizes important intermediates, and encourages C-C coupling all of which increase CO2RR activity and selectivity.20) Yang et al.21) proposed a Cu@Cu20 heterojunction electrocatalyst that can selectively reduce carbon dioxide to methanol. They demonstrated that at 400 °C, it exhibits faster electron transfer rates and superior performance in CO2 reduction reaction (CO2RR). After 10 hours of stable operation, the faradaic efficiency (FE) of methanol remained stable at 45 %. Dr. Shenghua Chen and colleagues22) designed a UiO-67-coated NHC-coordinated CuSAS FE of 81 % for CH4 at -1.5 V vs. RHE, with a current density of 420 mA cm-2 and a conversion rate as high as 16.3 s-1. Yang et al.23) studied the effect of bimetallic coordination centers on CO2RR to formic acid. After optimization, the catalyst BiZn-MOF achieved 92 % FEHCOOH at a potential of -0.9 V (relative to RHE), which is thought to be attributed to the bimetallic coordination centers in the MOF. Moreover, Cu-based MOFs (Cu-MOFs) are particularly favored for C2+ product generation due to their optimal *CO and *H adsorption balance on Cu sites, along with their favorable reactivity for CO2RR.24) It is hypothesized that the characteristics for CO2 reduction can be improved by carefully adjusting the coordination microenvironments in Cu-based MOFs to the local electronic configuration of Cu sites, allowing for the effective production of C2+ products with high activity and selectivity.
Herein, Cu(I)-based coordination complexes, named H2(Cu4Br6)[(Cu4Br3) (TTTMB)2(H2O)]2 (ZZY-2) were developed as CO2 reduction reaction (CO2RR) electrocatalysts for efficient C2+ production. Further, N-doped MOFs were utilized to address key challenges such as low current density, excessive hydrogen evolution, and poor product selectivity in MOF materials. This approach successfully shifted the reaction overpotential to a more positive direction and effectively suppressed the HER.
2. Experimental Procedure
2.1. Chemicals
All reagents and solvents were acquired from renowned suppliers and utilized without further processing. Specifically, Na2CO3, HNO3, CuBr2, TTTMB (C18H21N9), C8H7NO4, and C2H5N5 were acquired from Shanghai Aladdin Biochemical Technology Co., Ltd. All solutions were made using 18.2 MΩ・cm of ultrapure water generated by a deionized (DI) water system TS-S20.
2.2. Synthesis of 0N-Cu-MOF
CuBr2 (0.2 mmol, 45 mg) and TTTMB (0.1 mmol, 36.3 mg) were dissolved within a solvent mixture of DI water (19 mL), methanol (7 mL), and concentrated HNO3 (50 µL). The mixture was stirred for a duration of 30 min at ambient temperature before being put into a 50 mL Teflon-lined stainless-steel autoclave. After sealing, the vessel underwent a 48 h thermal treatment at 120 °C. Black needle-shaped crystals of 0N-Cu-MOF were obtained after cooling gradually to room temperature at 3 °C/min.
2.3. Synthesis of 1N-Cu-MOF
To synthesize 1N-Cu-MOF, CuBr2 (0.2 mmol, 45 mg), TTTMB (0.1 mmol, 36.3 mg), Na2CO3 (2 mg), and 2-aminoterephthalic acid (0.1 mmol, 18.4 mg) were combined with DI water (19 mL), concentrated HNO3 (50 µL), and methanol (7 mL). Following 30 min of stirring at ambient temperature, the prepared mixture was transferred to a 50 mL autoclave lined with Teflon and heated to 180 °C. Following a 48 h reaction under autogenous pressure and controlled cooling at 3 °C/min, yellow square-shaped crystals of 1N-Cu-MOF were formed.
2.4. Synthesis of 2N-Cu-MOF
The 2N-Cu-MOF was prepared using the same procedure as 1N-Cu-MOF, except with an increased amount of Na2CO3 (4 mg) and 2-aminoterephthalic acid (0.1 mmol, 36.8 mg). The prepared mixture was stirred continuously at ambient temperature for a duration of 30 min, and then transferred into a Teflon-lined autoclave, where it was heated for 48 h at 180 °C. After gradual cooling to room temperature at 3 °C/min, white needle-like crystals of 2N-Cu-MOF were obtained.
2.5. Characterization techniques
X-ray diffraction (XRD) spectra were examined using a Rigaku D/Max 2200PC diffractometer with a Cu Kα radiation source, at 40 kV and 40 mA. The thermal properties of Cu-BTEC were assessed using a NETZSCH STA 409 PC simultaneous thermal analyzer through thermogravimetric/differential scanning calorimetry (TG/DSC) under a 40 mL/min airflow rate, a 10 °C/min heating rate, and an initial sample mass equal to 15.6 mg. Fourier-transform infrared (FT-IR) spectra were obtained utilizing KBr pellet samples via a Thermo Scientific Nicolet IS10 spectrometer, while Raman curves were obtained with a LabRAM HR Evolution-HRDLS20 Raman spectrometer using an excitation laser at 532 nm. Ultraviolet-visible (UV-Vis) absorption profiles were acquired via a UV-3600 spectrophotometer from Shimadzu with BaSO4 as the reference, while X-ray photoelectron spectroscopy (XPS) was carried out via a Thermo Scientific Escalab 250 system with Al Kα radiation, and all high-resolution binding energies were calibrated against the C 1s peak at 284.6 eV. X-band electron paramagnetic resonance (EPR) profiles were recorded at a temperature equal to 300 K using a Bruker A300 spectrometer, while in situ Raman analysis was conducted with a LabRAM HR Evolution system coupled with a laser at 785 nm in a CO2-saturated KHCO3 (0.1 M) electrolyte. X-ray absorption spectroscopy (XAS) was conducted at the BL14W1 beamline of the Shanghai Synchrotron Radiation Facility using fluorescence mode detection with a Lytle detector. For in situ XAS, a custom flow cell with a gas diffusion layer was employed, enabling CO2 to flow from the rear side. Reference samples included metallic Cu, CuO, and Cu2O. The acquired Extended X-ray Absorption Fine Structure (EXAFS) data were analyzed using standard protocols with the ATHENA module of the IFEFFIT software installations.
2.6. Development of the working electrode
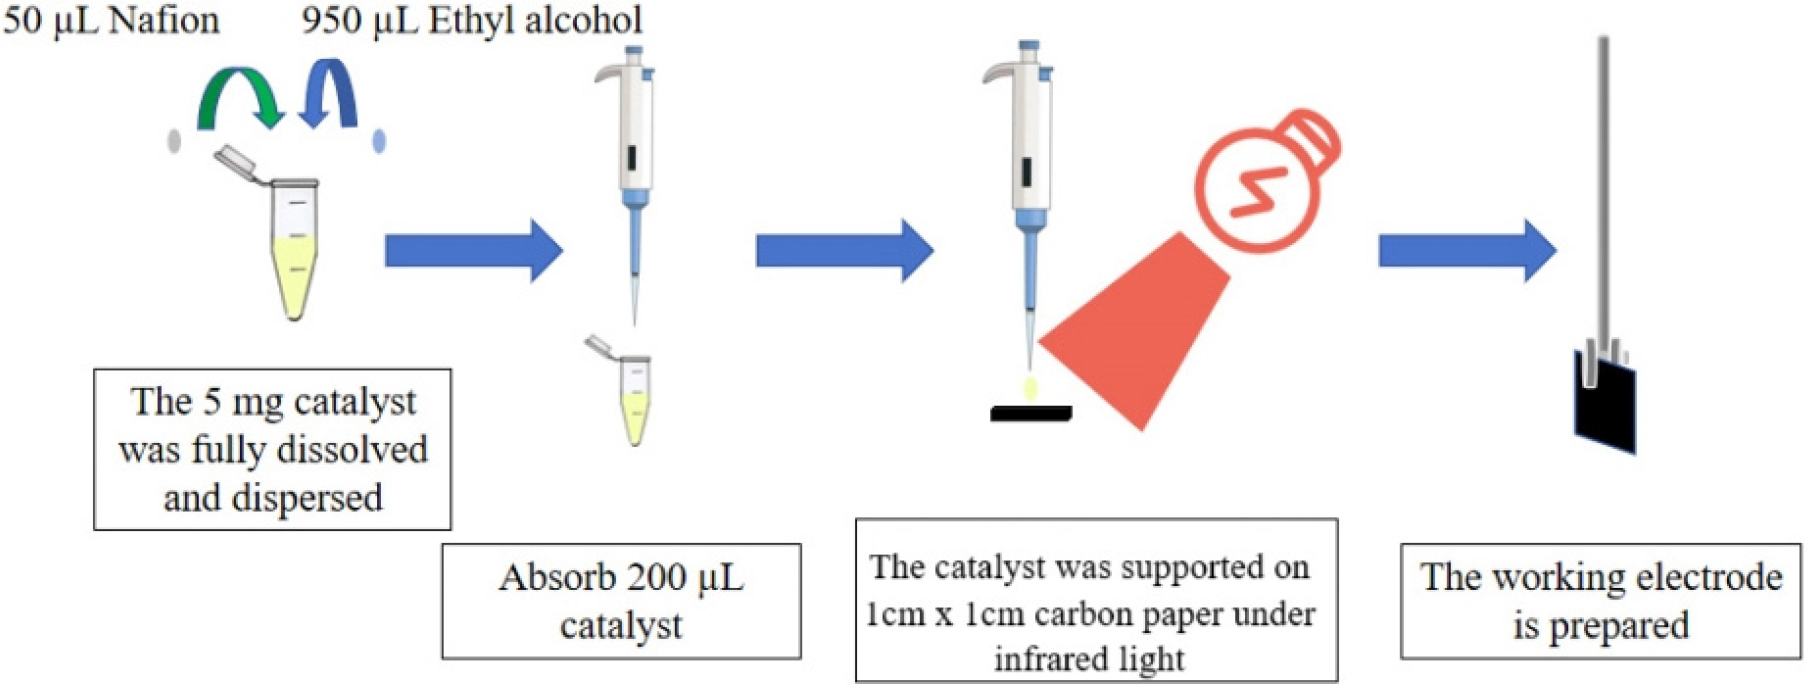
The working electrode was synthesized on a cleaned surface by cutting hydrophobic carbon paper into a 1 × 1 cm matrix using a cutting plate. (shown in Fig. 1) The cut pieces were then transferred to a Petri dish to avoid contamination. Next, the catalyst (5 mg) was carefully weighed and added to a mixture of 50 µL of 5 wt% Nafion® 117 and 950 µL of C2H5OH. The prepared mixture was sonicated for a duration of 15 min to ensure complete dissolution of the catalyst. Using a pipette gun, 200 µL of the solution was precisely applied onto the carbon paper, which was then dried using an IR lamp for 5 min, ensuring that the catalyst adhered firmly to the carbon paper, with 1 mg of electrocatalyst applied per unit area.
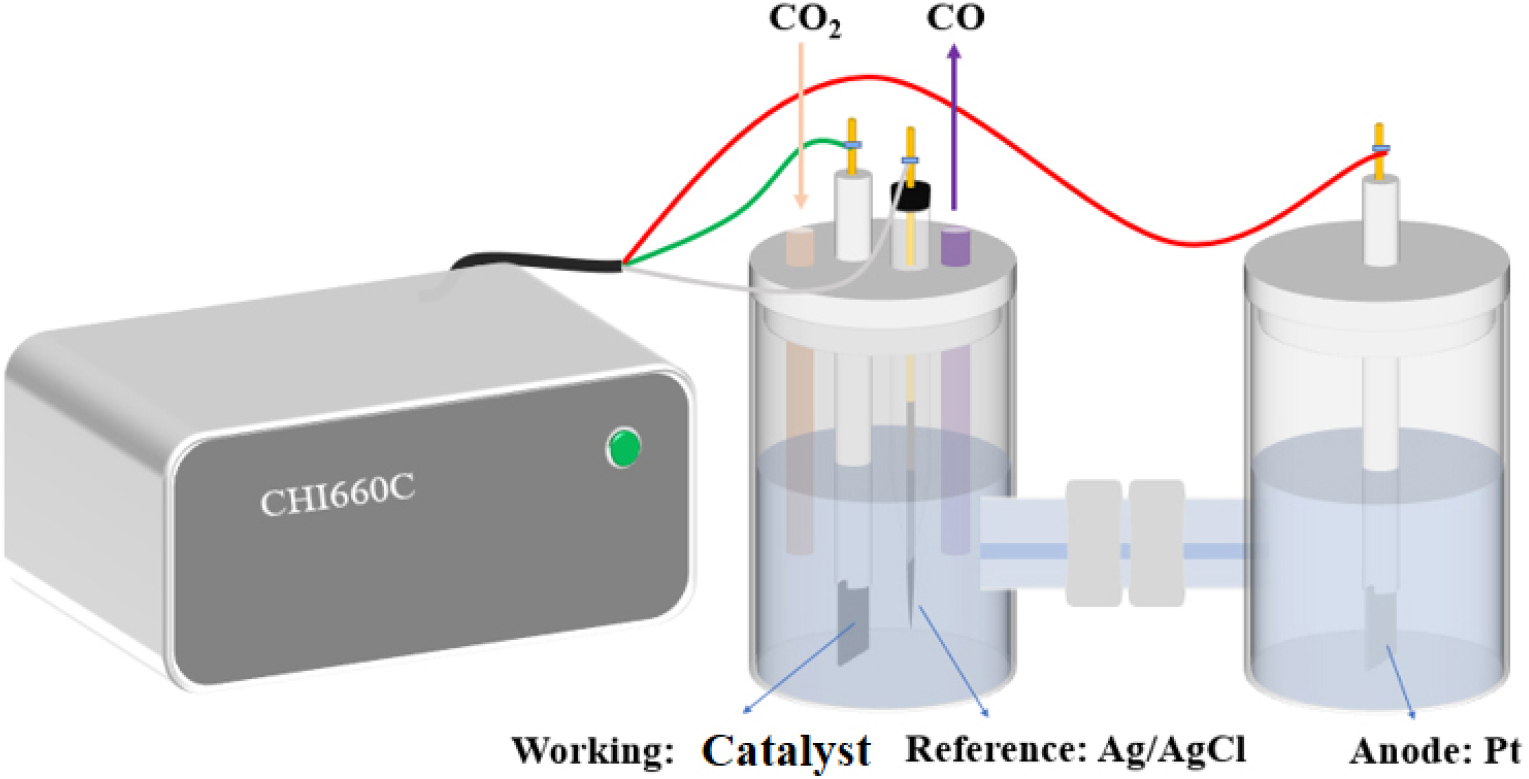
CO2RR performance was tested by Shanghai Chenhua electrochemical workstation (CHI660C) in 0.5 mol/L KHCO3 solution (shown in Fig. 2). In this paper, this system was used for all tests, with a Pt sheet electrode as the counter electrode, an Ag/AgCl electrode as the reference electrode, and a loaded carbon paper as the working electrode. During testing, argon was introduced to remove air from the cathode reaction chamber, followed by carbon dioxide to ensure that the electrolyte was filled with carbon dioxide gas.
3. Results and Discussion
3.1. Characterization
The crystal phase of the prepared specimens was examined using XRD. As depicted in Fig. 3, the main XRD peaks of the composite appeared at 10.15°, 11.08°, 14.53°, 17.14°, 21.24°, 22.70°, and 26.10°, which are characteristic of the 0N-Cu-MOF structure,25) confirming the successful target Cu-MOFs synthesis. The XRD analysis of xN-Cu-MOFs also revealed similar diffraction peaks at 10.15°, 11.08°, 14.53°, 17.14°, 21.24°, 22.70°, and 26.10°. As depicted in Fig. 3(b), the main XRD peaks coincided, indicating that N doping had a minimal impact on the overall structure of the prepared specimen, and the structural integrity remains largely unchanged. However, the intensity of the characteristic diffraction peaks varies according to the amount of N doping.
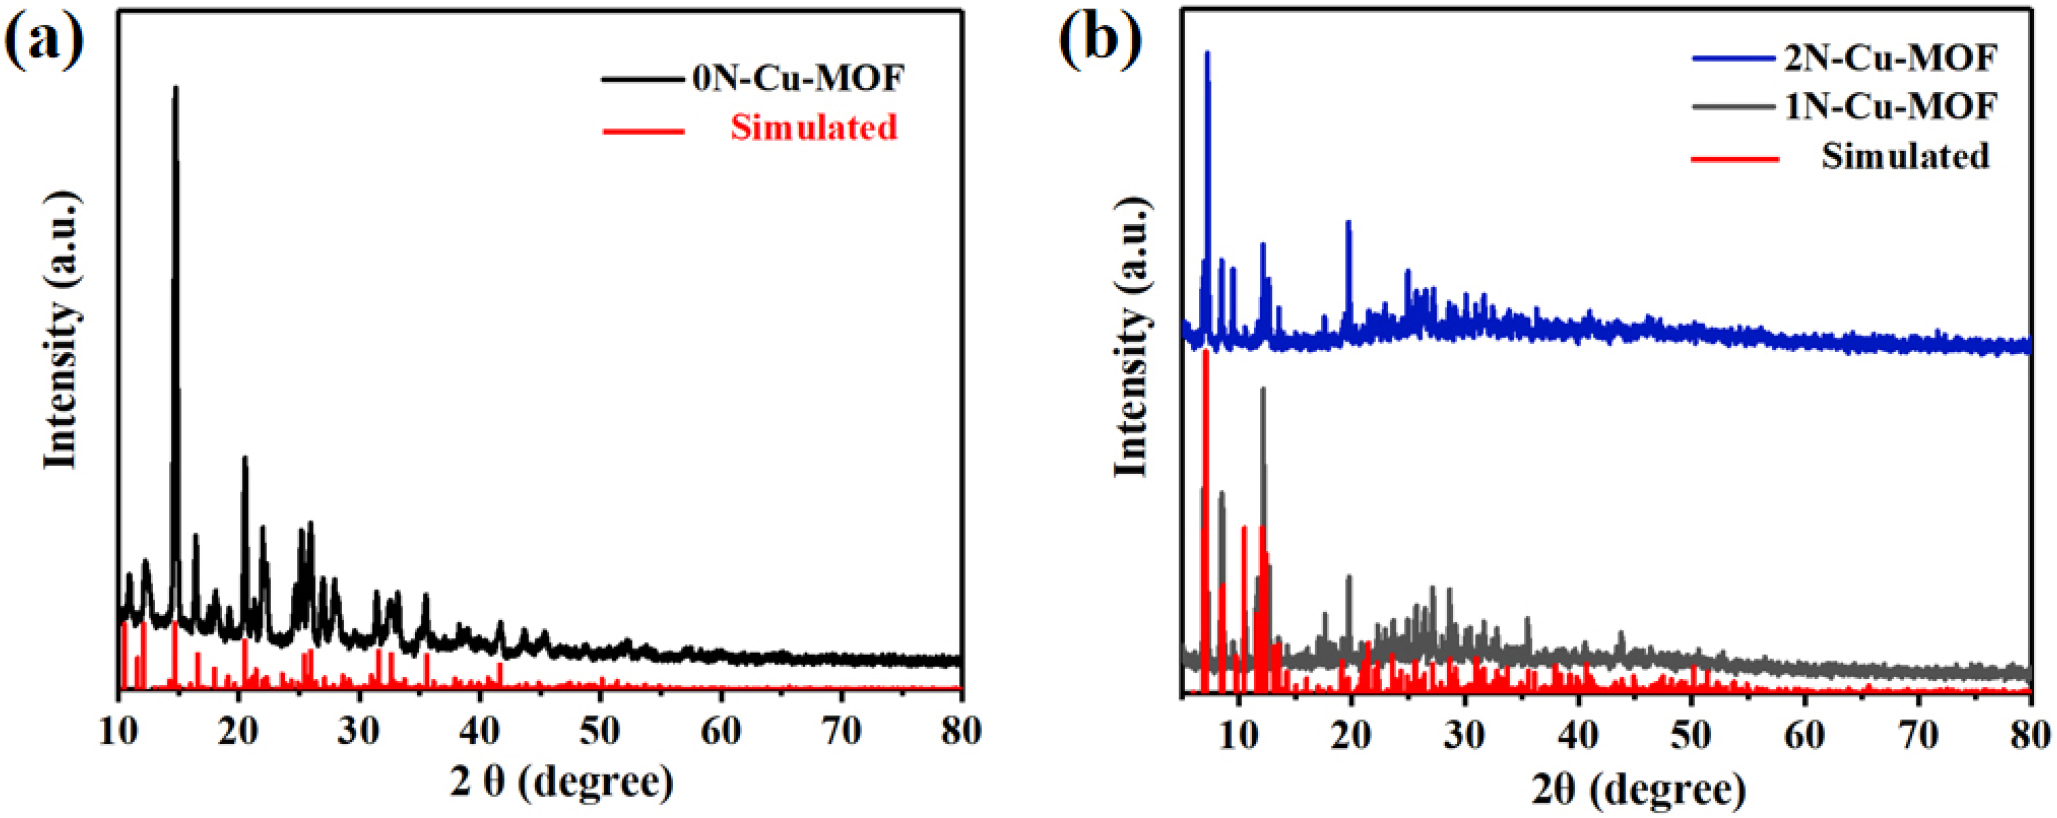
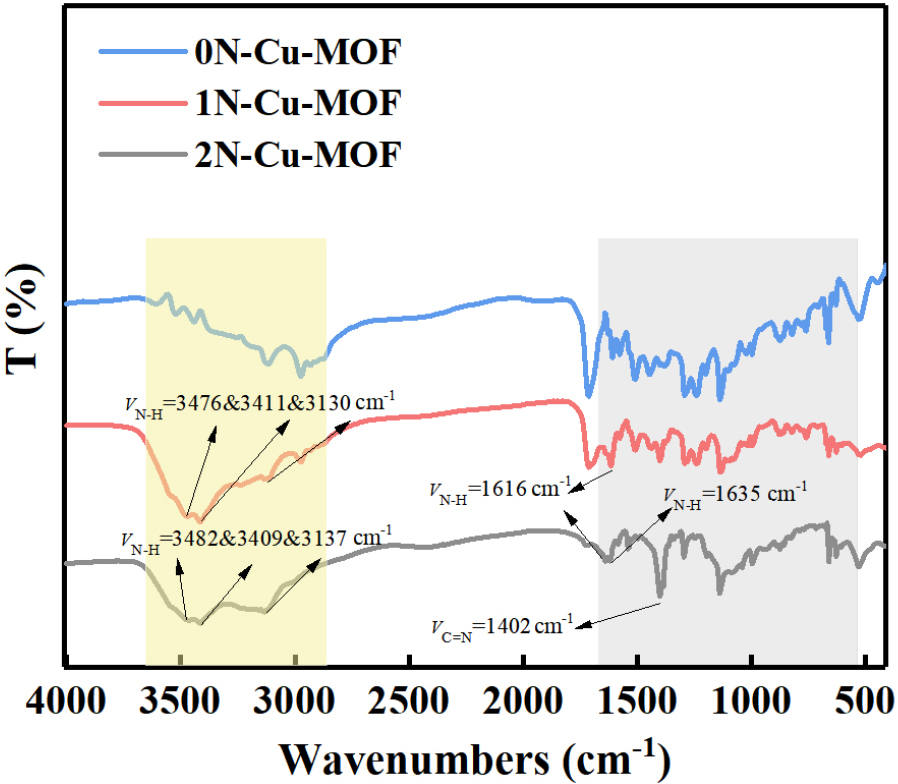
Fig. 4 presents the recorded FT-IR profiles of the 1N-Cu-MOF and 2N-Cu-MOF samples. The crystalline material revealed well-defined and sharp bands, while the profiles of the amorphous samples were less distinct. In the FT-IR spectra of 1N-Cu-MOF and 2N-Cu-MOF, strong and broad peaks appeared in the range extending from 3,100-3,500 cm-1. Based on their intensity and position, these peaks were associated with the amine νN-H and amide νN-H vibrations, which align with the target product and confirm that nitrogen is incorporated into the modified MOFs in the form of an “-NH2” group.26) The N-H bond stretching vibration peaks shifted from 3,476, 3,411, and 3,130 cm-1 in 1N-Cu-MOF to 3,482, 3,409, and 3,137 cm-1 in 2N-Cu-MOF. A broad absorption peak within the range of 2,750 to 3,600 cm-1 was ascribed to the vibrational absorption of water molecules, suggesting the presence of crystalline water in the complex. In the fingerprint region, the N-H group bending vibration and the C=N bond stretching peak in TTTMB shifted from 1,614 cm-1 to 1,402 cm-1, while the C-H bond peaks moved to 724 and 843 cm-1, indicating that triazole groups participate in coordination with Cu2+ and 3-NH3 to the oxygen of the terephthalate. Moreover, a weak peak observed at 416 cm-1 in both 1N-Cu-MOF and 2N-Cu-MOF corresponds to the Cu-O bond.27) A comparison of the diffraction patterns for all three samples indicates that the overall structure of the material remains unchanged. However, with increased N doping, variations in the intensity and broadening of the characteristic peaks were observed, confirming the successful incorporation of nitrogen into the framework in accordance with the experimental design.
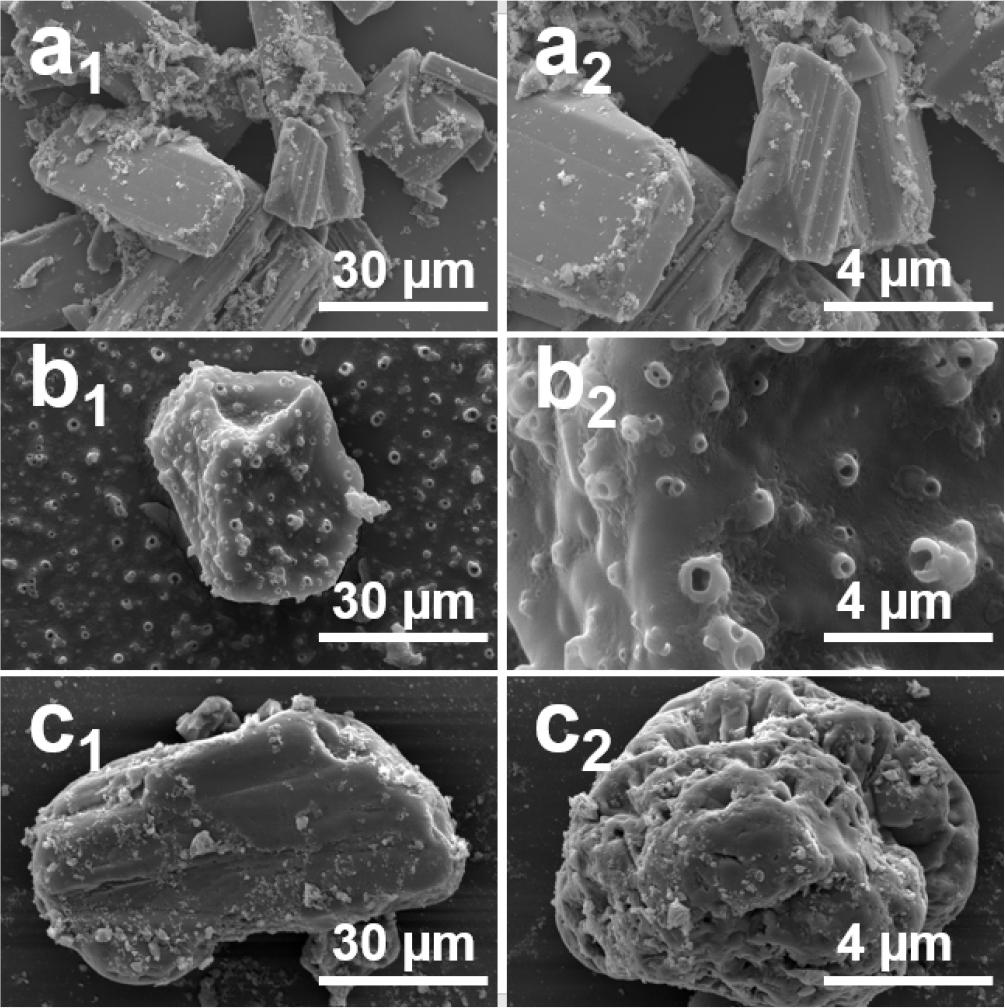
The morphology of xN-Cu-MOFs was mainly characterized using SEM. As depicted in Fig. 5 (a1-a2), the images reveal chlorophenols nano/micro structures (CPFs NSs) formation with micron-level dimensions and smooth surfaces. Across all samples shown in Fig. 5 (a1-c2), the MOF framework remained well-preserved following nitrogen incorporation. The particle size of the xN-Cu-MOFs was approximately 10 µm to 30 µm, similar to the black needle crystals prepared by Pillai et al.28)Fig. 5 (b1-b2) shows the 1N-Cu-MOF sample, where the structure remains intact after N doping, although some pores are visible on the particles. However, Fig. 5 (c1-c2) illustrates that with increased N doping, the particle surfaces become smoother, and the number of pores decreases. Combined with Brunauer-Emmett-Teller (BET) data, it indicates that this structure may enhance the adsorption performance of the material.
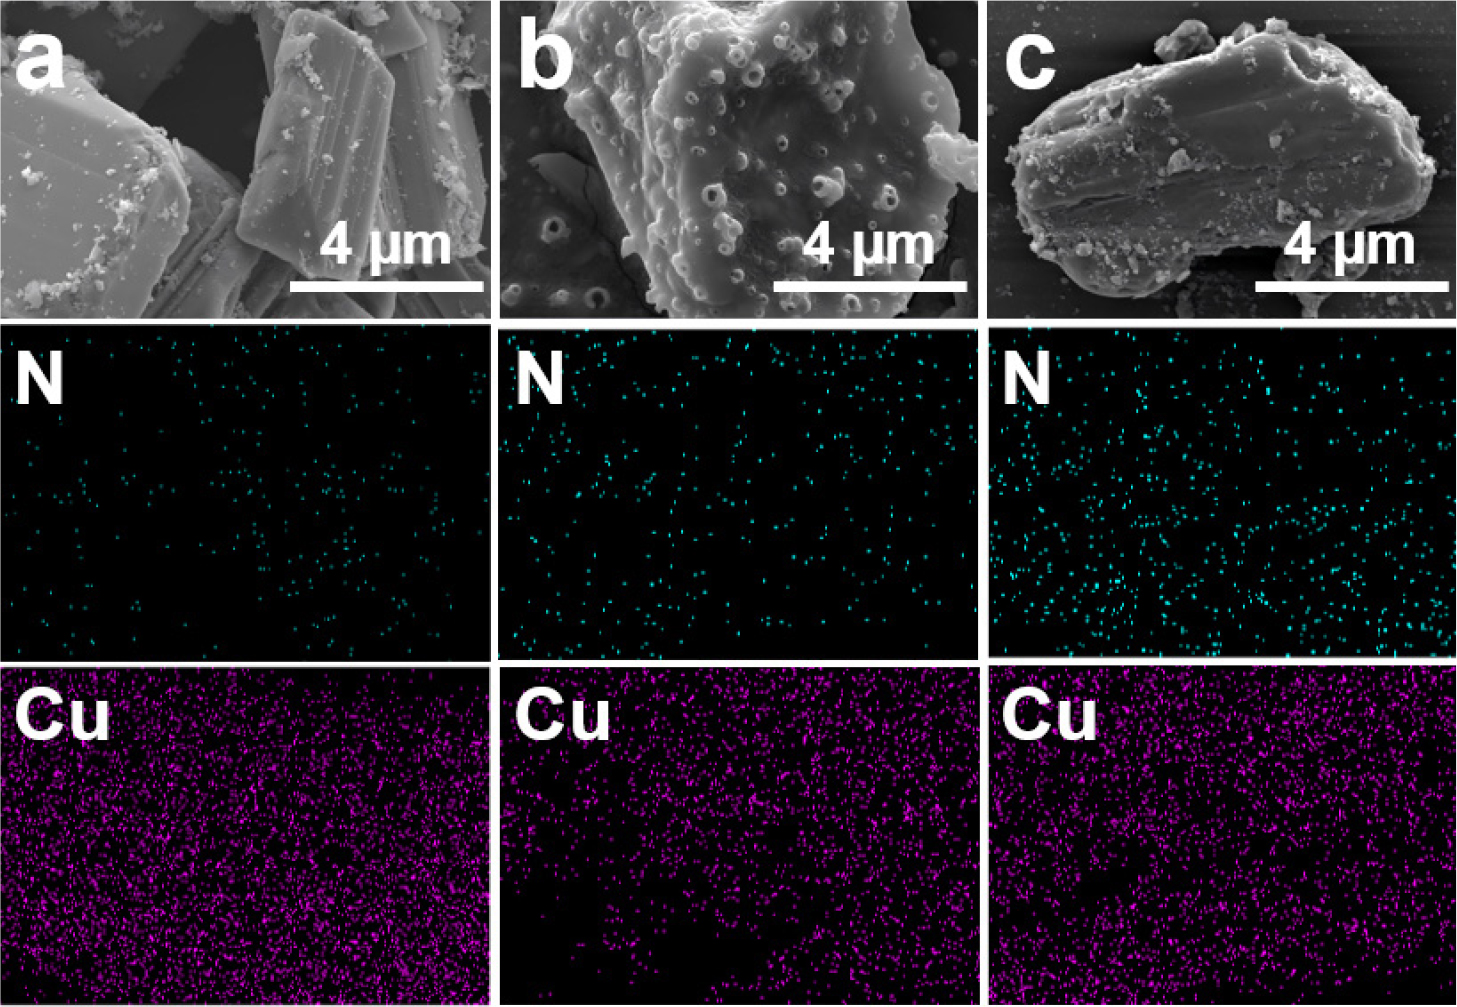
To further confirm that the nanoparticles were Cu-MOF crystals, the xN-Cu-MOF samples were analyzed using scanning electron microscope (SEM). Elemental mappings in Fig. 6 revealed that N atoms had a uniform distribution throughout the xN-Cu-MOF samples, while Cu atoms were enriched on the nanoparticles and showed a more prominent signal than N atoms. It was also observed that the N content increased from the 1N-Cu-MOF sample to the 2N-Cu-MOF sample. The experimental results demonstrated that the level of N doping in xN-Cu-MOFs could be controlled by varying the amount of nitrogen-containing reagents. The 2N-Cu-MOF sample exhibited the highest N content, followed by 1N-Cu-MOF, with the 0N-Cu-MOF containing the least.
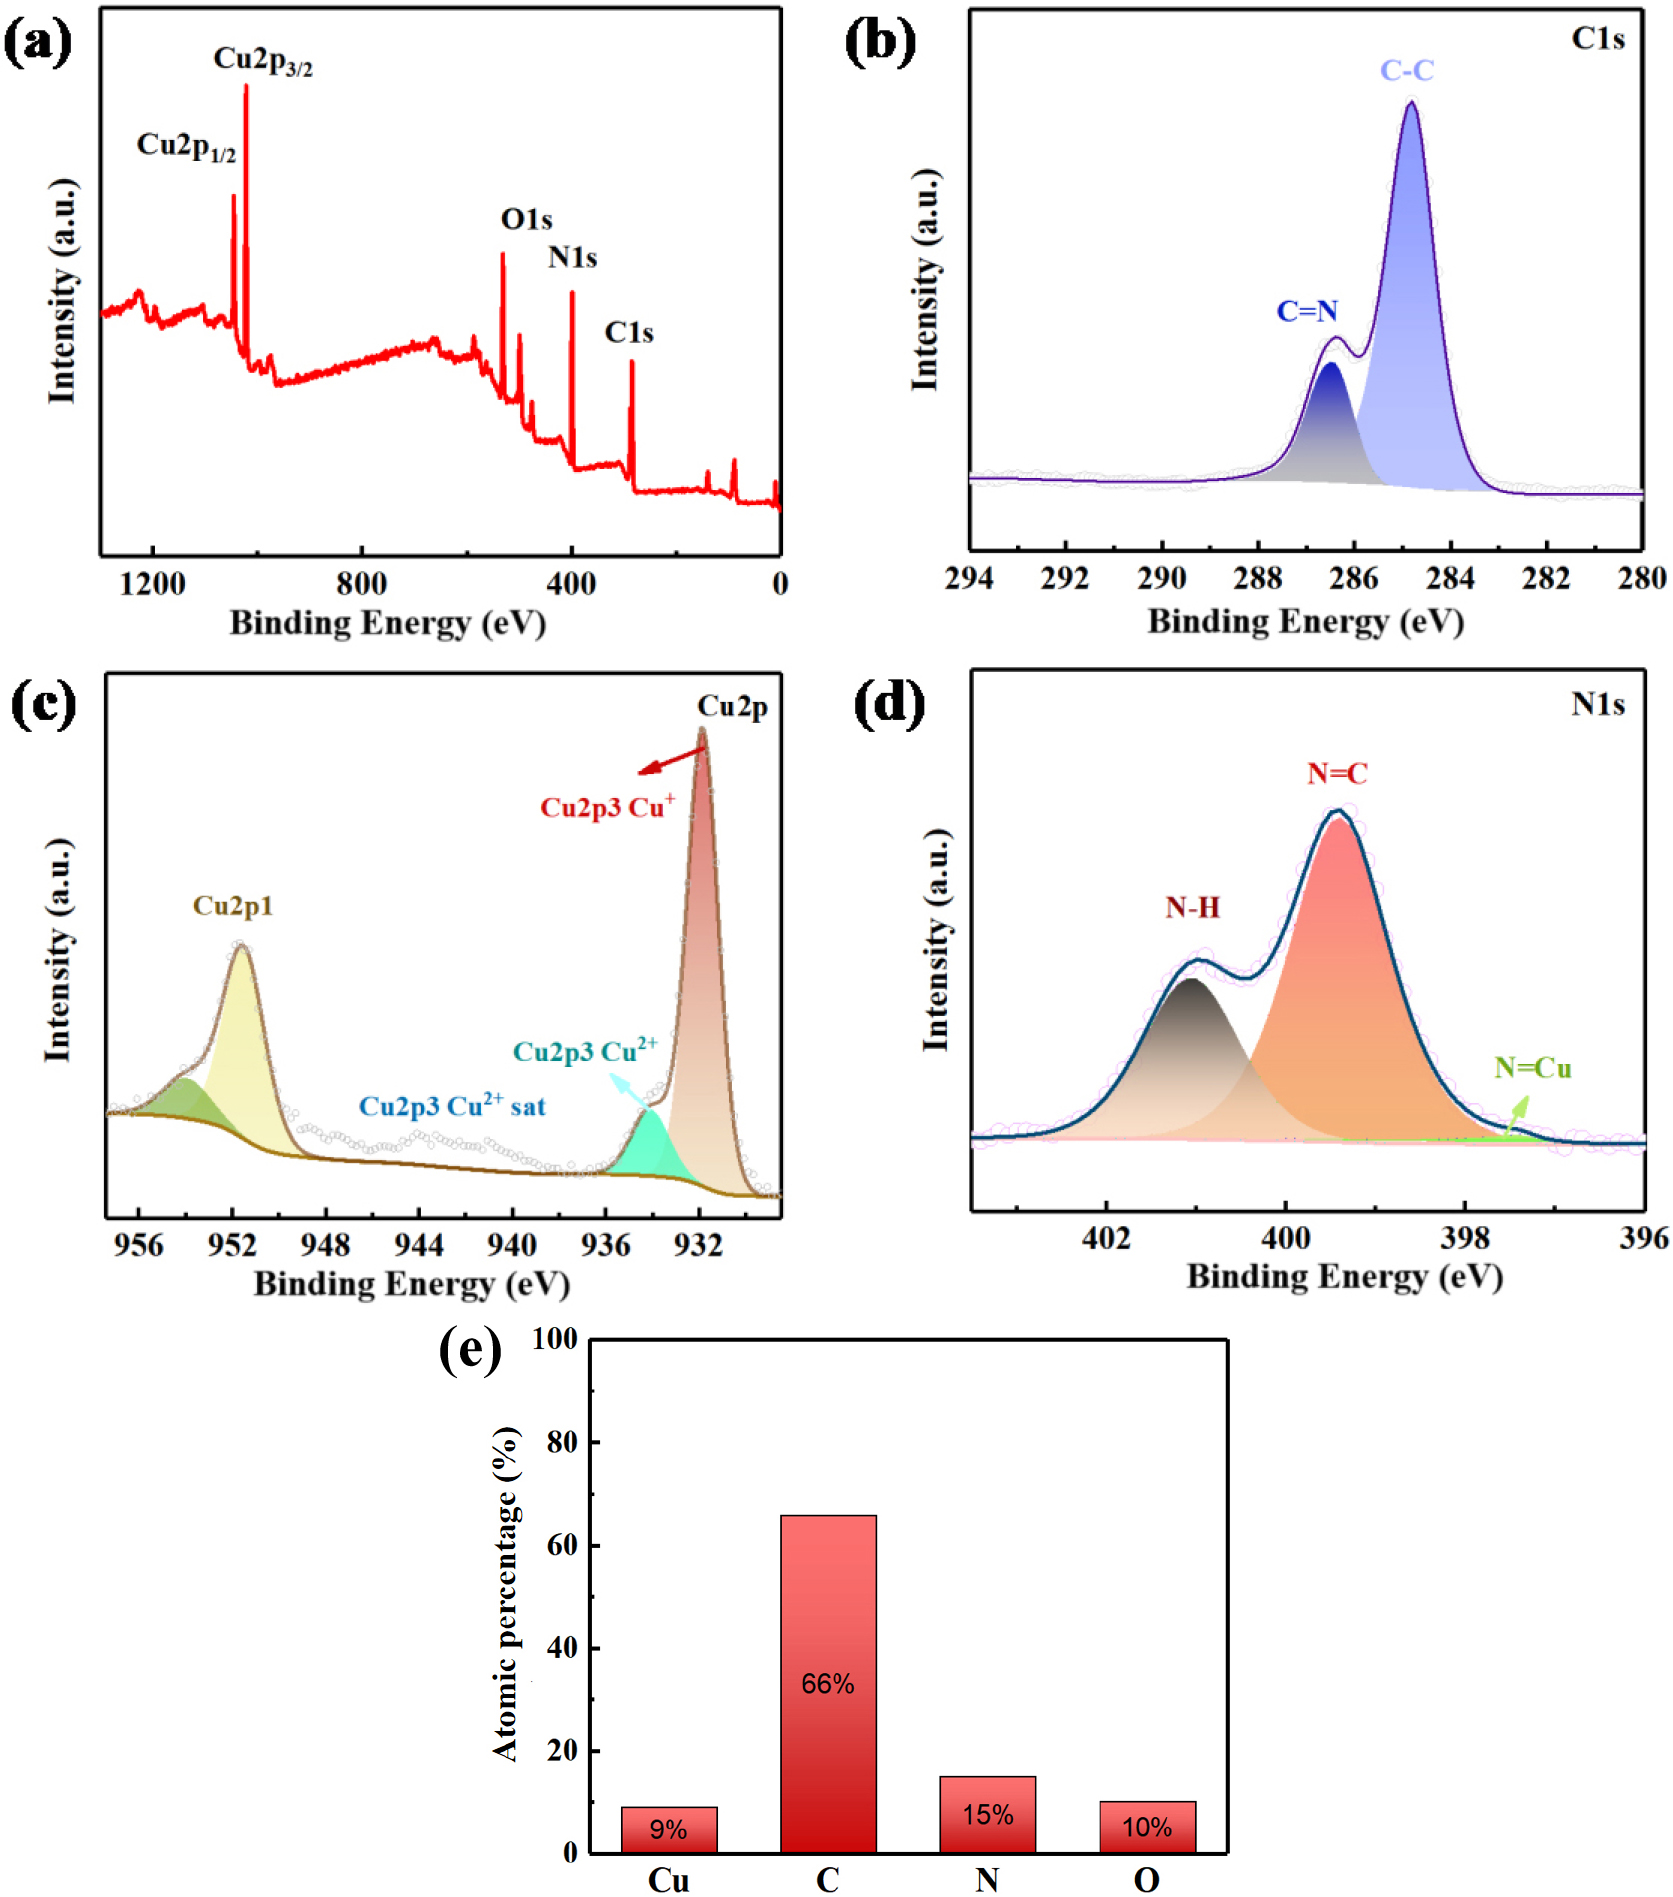
Since 1N-Cu-MOF demonstrated the most favorable morphology, structural integrity, and electrochemical performance, its elemental valence states were further investigated. XPS analysis was employed to examine the surface elemental distribution of 1N-Cu-MOF. As demonstrated in Fig. 7(b), distinct signals for N, Cu, O, and C were detected, confirming the presence of these elements in the sample. To gain deeper insight into the elemental valence states, high-resolution XPS spectra of the four main elements were analyzed, as illustrated in Fig. 7. Fig. 7(b) shows the C 1s spectrum with characteristic signals found at 284.8 and 286.3 eV, attributed to C-C and C=N bonds, respectively, verifying the successful introduction of nitrogen into the MOF structure.
Fig. 7(b) presents the XPS profile of Cu 2p, where the signals appearing at 931.84 and 951.92 eV correspond to Cu 2p3/2 and Cu 2p1/2, respectively, with a binding energy separation of around 20 eV, confirming the presence of copper in both Cu+ and Cu2+ oxidation states. The 1N-Cu-MOF sample shows additional peaks appearing at 934.01 and 953.02 eV, corresponding to the Cu 2p3/2 and Cu 2p1/2 satellite peaks, further confirming the presence of both Cu(II) and Cu(I) oxidation states. In Fig. 7(d), the XPS spectrum for N 1s displays three signals at 397.18, 399.25, and 401.06 eV, which were ascribed to the N=Cu, N=C, and N-H bonds, respectively.29) The XPS data indicated that the structure of 1N-Cu-MOF was stable, with nitrogen and copper existing in the forms of N=Cu, N=C, N-H, and C=N.
The nitrogen adsorption isotherms for the xN-Cu-MOFs are presented in Fig. 8. The Type IV isotherm observed confirms the presence of mesopores on the sample surface. This isotherm features a hysteresis loop, which indicates capillary condensation within the mesopores, along with a limiting uptake at high P/P0 values. The initial portion of the Type IV isotherm corresponds to monolayer-multilayer adsorption, following a path similar to the beginning section of a Type II isotherm typically observed for non-porous adsorbents with the same surface area. Type IV isotherms are commonly seen in mesoporous industrial adsorbents,30) and the behavior of the xN-Cu-MOFs suggests that they are primarily mesoporous, with a smaller proportion of larger pores where capillary condensation takes place. These isotherm patterns are consistent across all the samples.
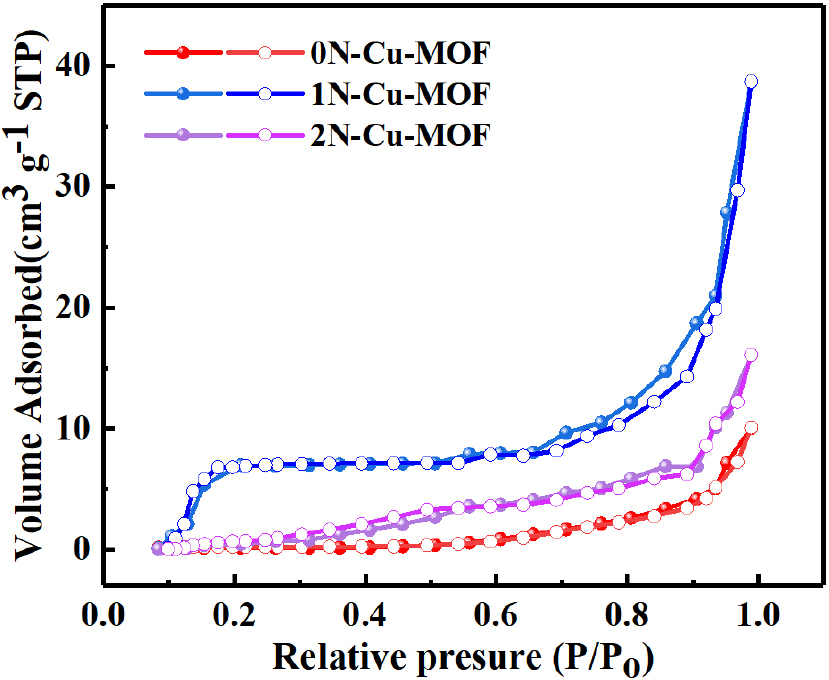
The BET surface area results for the xN-Cu-MOF samples are shown in Table 1. N-doping significantly increased the surface area, with 1N-Cu-MOF displaying the highest value, increasing its adsorption capacity. For 0N-Cu-MOF, the mean pore size, the SSA, and the pore volume were 6.04 nm, 7.1 m2・g-1, and 0.03 cm3・g-1, respectively. However, 2N-Cu-MOF exhibited values of 10.09 nm, 10.3 m2・g-1, and 0.15 cm3・g-1, respectively. The 1N-Cu-MOF showed the most pronounced enhancement, reaching 39.1 m2・g-1, 0.37 cm3・g-1, and 21.61 nm, respectively, highlighting the structural benefits introduced by nitrogen incorporation.
Table 1.
Parameters of the BET from xN-Cu-MOFs.
| Sample | SBET (m2 g-1) | Pore volume (cm3 g-1) | Mean pore diameter (nm) |
| 0N-Cu-MOF | 7.1 | 0.03 | 6.04 |
| 1N-Cu-MOF | 39.1 | 0.37 | 21.61 |
| 2N-Cu-MOF | 10.3 | 0.15 | 10.09 |
3.2. Electrochemical Efficiency
Before electrochemical measurements, each catalyst was applied onto a 1 × 1 cm piece of hydrophobic carbon paper. To assess the catalytic performance of xN-Cu-MOFs, linear sweep voltammetry (LSV) was performed in Ar-saturated 0.1 M and CO2-saturated 0.5 M KHCO3 electrolytes. As illustrated in Fig. 9, 0N-Cu-MOF displayed a significantly higher current response and a more favorable onset potential under CO2 conditions compared to the Ar atmosphere. A sharp increase in current was observed once the applied potential exceeded -0.291 V (vs. RHE), indicating the material’s activity toward CO2 reduction.31)
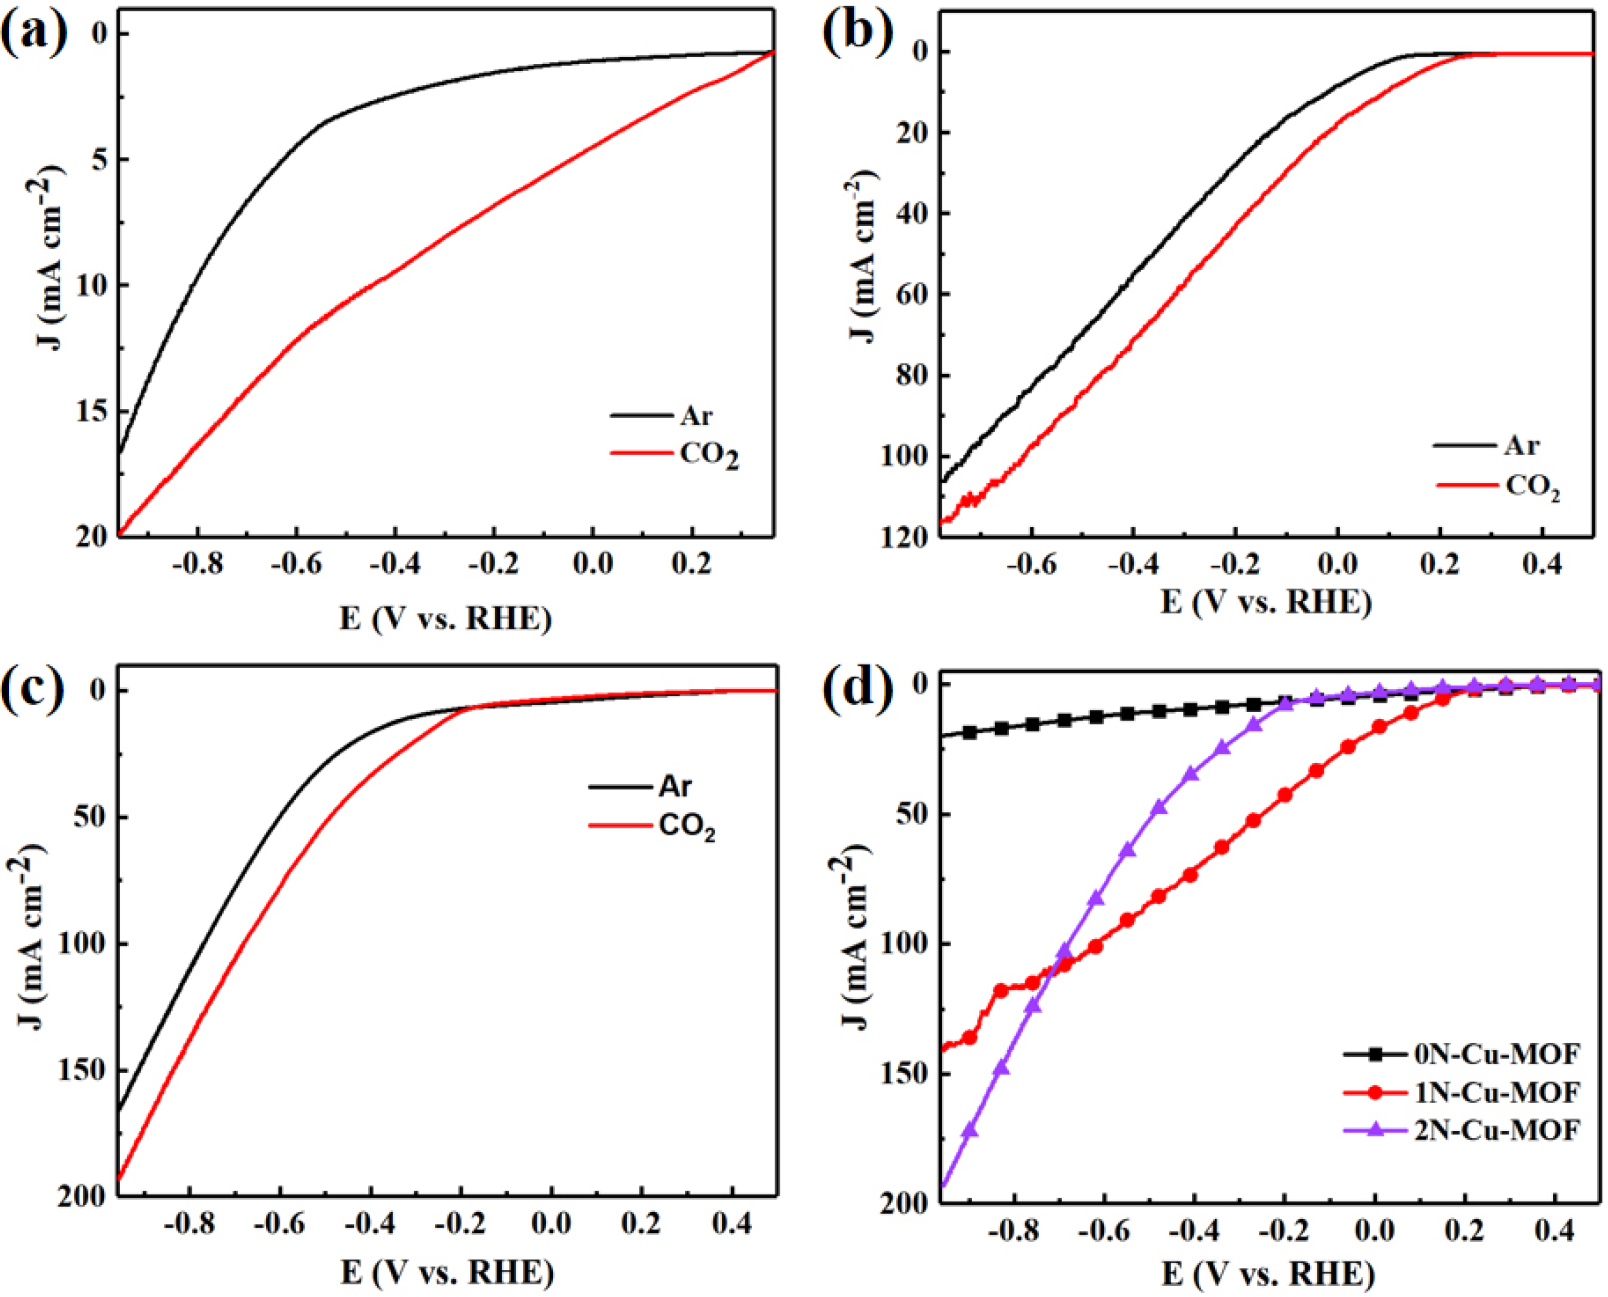
Figs. 9(b) and 9(c) show the LSV curves for 1N-Cu-MOF and 2N-Cu-MOF, respectively. In Fig. 9(b), a significant reduction current was observed when the voltage became more negative than -0.23 V. In Fig. 9(c), for 2N-Cu-MOF, the current density under the CO2-saturated atmosphere exceeded that under the Ar atmosphere once the voltage dropped below -0.2 V. These results suggest that both MOF materials exhibit CO2 reduction capability, with 1N-Cu-MOF demonstrating a lower onset potential than 2N-Cu-MOF.
When comparing 1N-Cu-MOF and 2N-Cu-MOF catalysts in a CO2-saturated atmosphere, 2N-Cu-MOF exhibited a higher reduction current (182.1 mA・cm-2). However, it also experienced more significant hydrogen evolution, requiring a more negative potential, which is unfavorable for CO2 reduction. As illustrated in Fig. 9(d), within the voltage range extending from -0.6 to -0.2 V, 1N-Cu-MOF demonstrated a higher reduction current, indicating that it possesses improved catalytic activity compared to the other samples.
In Fig. 10, the equivalent fitting circuit was obtained through fitting analysis using Z-view (3.0) software. Fig. 10(a) shows the electrochemical impedance spectroscopy (EIS) mapping of pure carbon paper, while Fig. 10(b) presents the EIS mapping and fitting circuit for the catalysts. The data were derived from multiple fittings, and the equivalent circuit consists of interface transfer resistance (Rp), solution resistance (Rs), Warburg impedance (W1), and constant phase element (CPE), which represents the mixed ion battery conductor.32) These results indicate that the CO2RR process is initially governed by charge transfer, which is subsequently followed by mass transport at the interface. Ultimately, the movement of electrolyte ions to the catalyst’s electrons drives the overall reduction reaction. The EIS pattern typically shows a semi-circular and a sloped region at high and low frequency values, respectively. The semicircle diameter corresponds to the charge transfer resistance at the electrolyte-electrode interface, with a larger diameter signifying higher resistance. The 1N-Cu-MOF sample shows the smallest diameter, indicating the smallest charge transfer resistance among the catalysts tested.
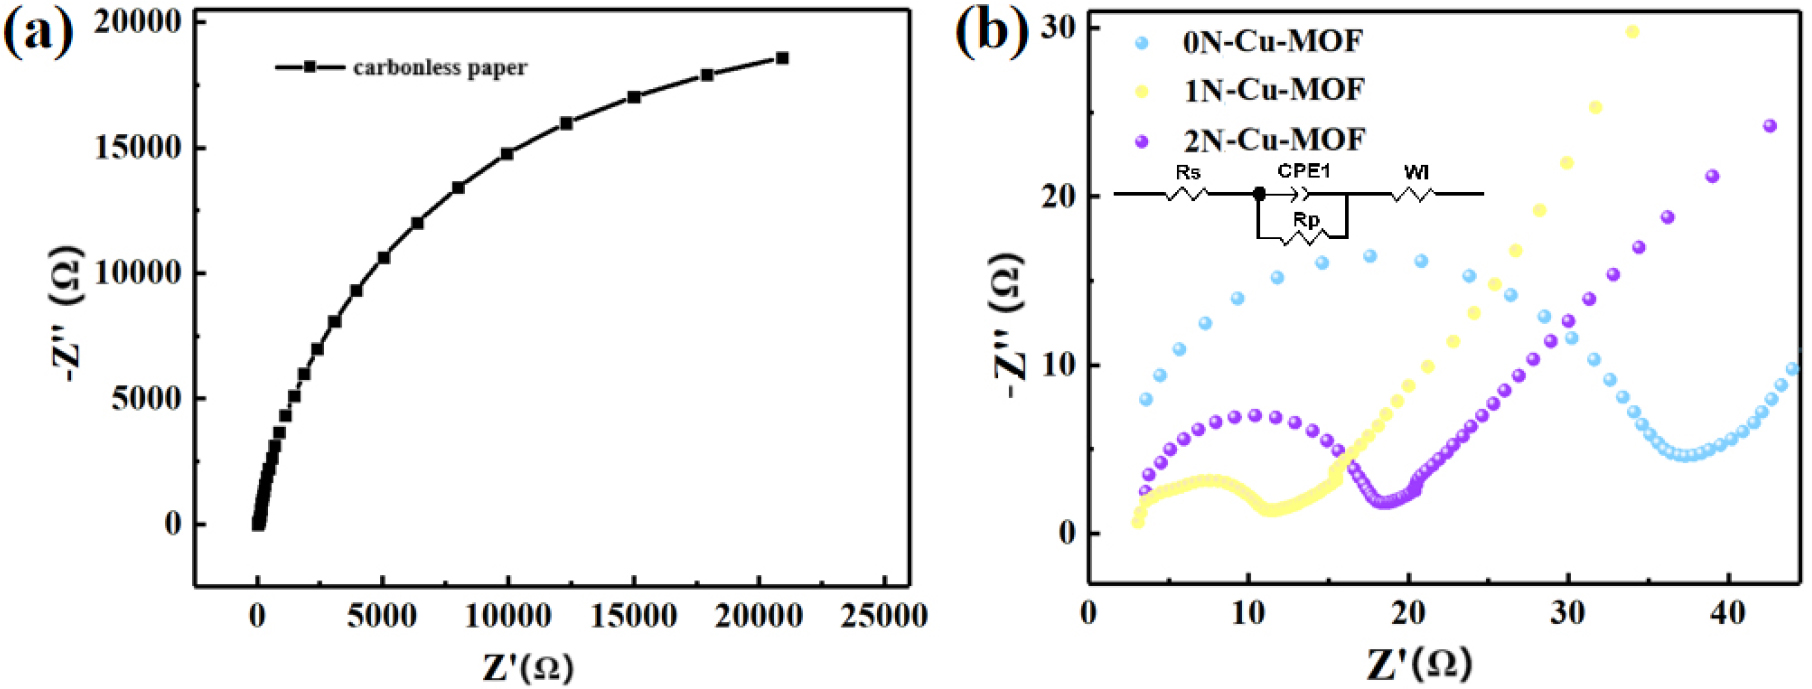
Table 2 lists the fitting circuit parameters for the xN-Cu-MOFs catalysts. The charge transfer resistance (Rp) of 1N-Cu-MOF was 8.23 Ω, which is smaller than that of carbon paper and the other samples, indicating that 1N-Cu-MOF facilitates a faster electron transfer rate within the 0.5 M KHCO3 solution. The W1-R values for 1N-Cu-MOF and 2N-Cu-MOF were also lower than those of 0N-Cu-MOF, further confirming that nitrogen modification increases the electroconductivity of Cu-MOFs. The electrochemical surface area (ECSA) was determined by comparing the double-layer capacitance (Cdl) of the catalysts to assess the electrochemical properties of the catalysts.
Table 2.
Parameters of the xN-Cu-MOFs catalyst fitting circuit.
The relationship between the current density and the scan rate was analyzed via the cyclic voltammetry (CV) test, as illustrated in Fig. 11(a-c). From the findings in Fig. 11(d) and Table 3, the 1N-Cu-MOF catalyst exhibited the highest Cdl value (3.13 mF cm-2) among all the catalysts. This data provides insights into the Cdl and allows for further evaluation of the ECSA of the xN-Cu-MOFs catalysts.33) The larger ECSA of the 1N-Cu-MOF catalyst indicates that it can provide more active sites, making it more effective for improving the electrocatalytic activity of Electrochemical CO2 Reduction Reaction (ECO2RR). As depicted in Fig. 11, the redox peaks of the xN-Cu-MOF catalysts were analyzed at different sweep rates in both CO2 and Ar-saturated solutions. The stronger reduction current (j) and larger loop area indicate that 1N-Cu-MOF has more active sites or demonstrates higher activity than both 0N-Cu-MOF and 2N-Cu-MOF, particularly in CO2-saturated solutions.
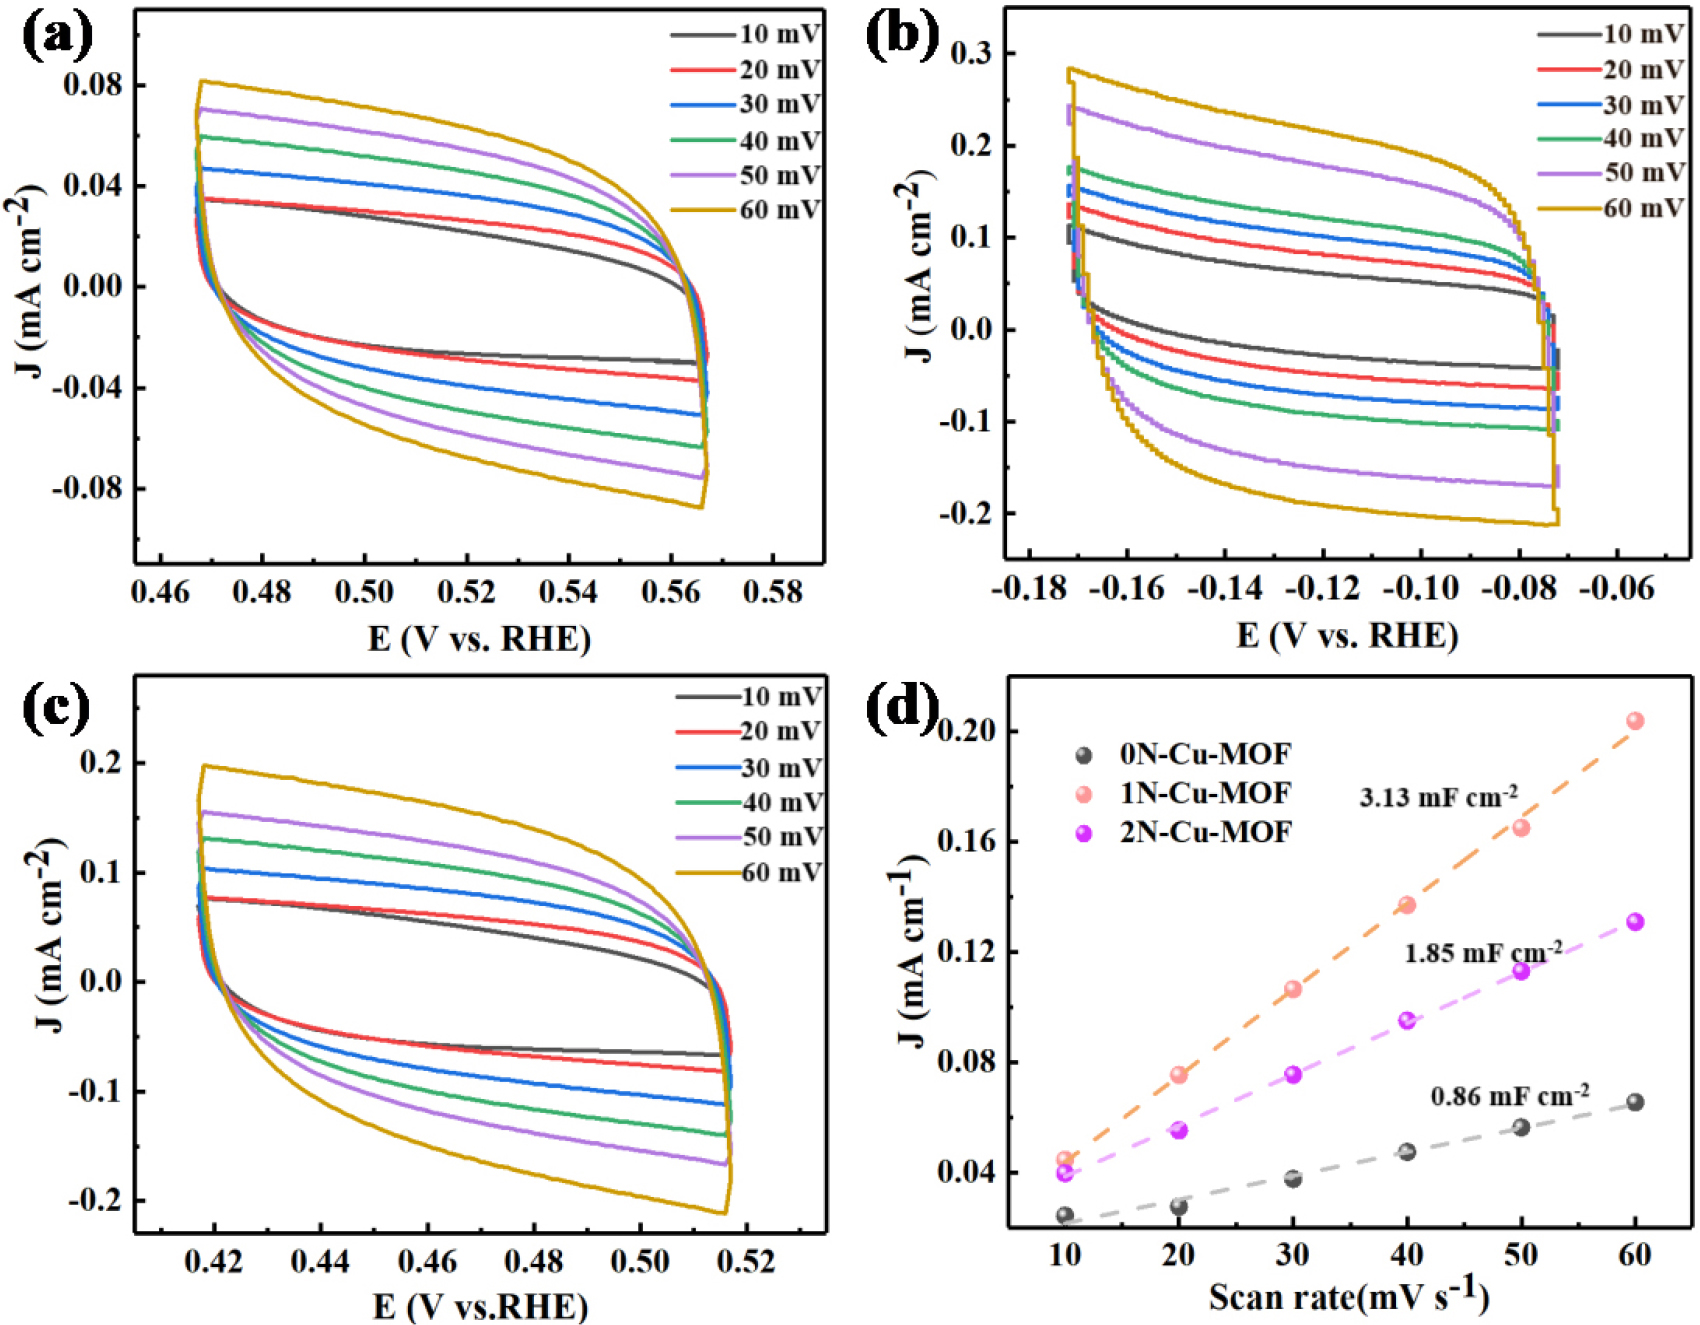
Table 3.
Fitted data of monolithic catalyst Cdl.
| Samples | Slope (mF・cm-2) | R2 |
| 0N-Cu-MOF | 0.86 | 0.97994 |
| 1N-Cu-MOF | 3.13 | 0.9928 |
| 2N-Cu-MOF | 1.85 | 0.9963 |
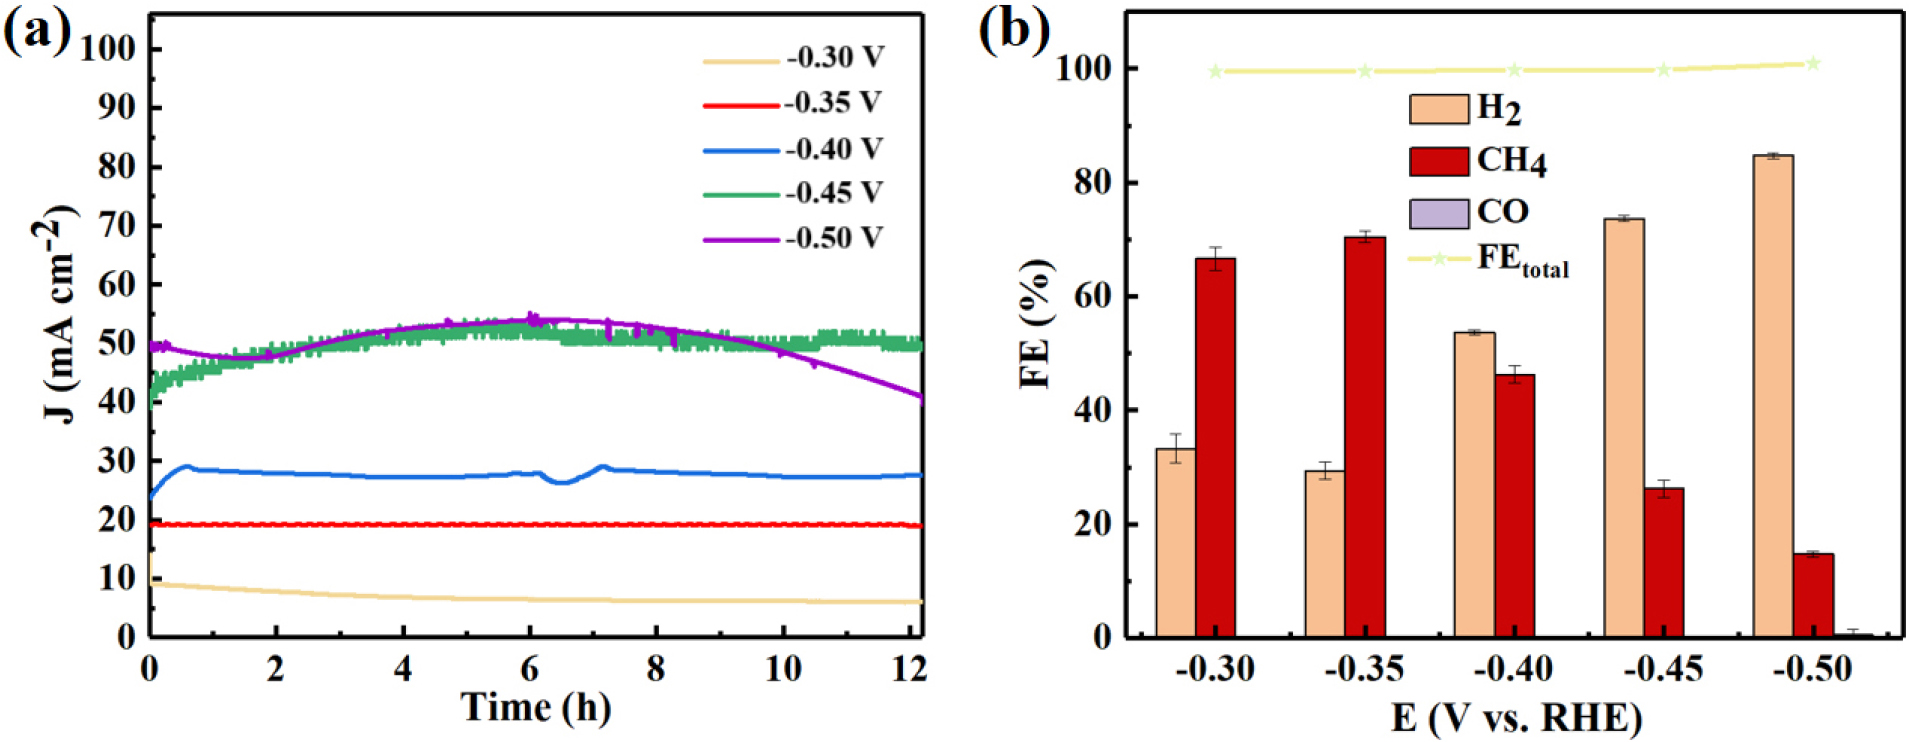
The long-term stability of an ECO2RR catalyst is crucial for its practical applications. To assess the durability of the 1N-Cu-MOF electrocatalyst, a 12-hour continuous reaction was conducted at a fixed potential (-0.6 V). As shown in Fig. 12(a), the catalyst sustained a steady 19.1 mA cm-2 current density and a CO FE equal to 70.54 %, with only a minor decline observed in both values over time, highlighting its excellent stability.
As depicted in Fig. 12, the product selectivity of CO2RR was assessed by performing electrolysis for 12 h at a constant potential. The product was passed into gas chromatography for analysis and the FE of the gas phase product was calculated with the following Eq (1) :
Meaning of the letters in the formula: FE: product Faraday efficiency, %; ppm: concentration of the product; flow rate: flow rate of CO2 into the H-type cell, mL・min-1; n: number of electrons to be transferred to produce the gaseous product (n = 8 for CH4, n = 2 for CO, n = 2 for H2); F: Faraday’s constant, 96485 C・mol-1. P0: standard atmospheric pressure (105 pa) R: gas constant, value of 8.314; T: temperature, K; Jtotal: total current density.
During the experiment, oxygen evolution occurred at the anode chamber, where numerous bubbles formed on the platinum electrode. A similar phenomenon was observed at the working electrode. The overall FE for H2 and CH4 remained nearly 100 % throughout the entire potential range, with no additional liquid or gaseous byproducts detected using fully digital nuclear magnetic resonance (NMR) spectroscopy and gas chromatography. Here, hydrogen was produced as a by-product via the HER. It is noteworthy that the electrolyte in both the anode and cathode chambers was analyzed via an all-digital nuclear magnetic resonance spectrometer (AVANCEIII 400 MHz). The findings confirmed that no liquid products were formed. The 1N-Cu-MOF exhibited typical volcanic selectivity for CH4 generation within the tested potential range. Initially, the FE for CH4 gradually increased as the potential became more negative for most of the 1N-Cu-MOF catalysts, particularly reaching its highest value at -0.35 V (vs. RHE).
As shown in Table 4, we counted the reduction properties of some Cu-based MOFs when used as catalysts in electrochemical CO2RR. Among them, the reduction products are different for different types of catalysts, and the reduction potentials are higher than those in this experiment.
Table 4.
Comparison of the CO2RR performance of Cu-based MOFs/complex electrocatalysts.
| Catalyst | Electrolyte | Product | FE (%) | E (V) | Reference |
| Cu2O@Cu-MOF | 0.1M KHCO3 | CH4 C2H4 | 63.2 16.2 | -1.71 V vs RHE | 34) |
| Cu-SIM NU-1000 | 0.1M NaClO4 | HCOOH | 28 | -0.82 V vs RHE | 26) |
| HKUST-1/CAU-17 | 0.5M KHCO3 | CH3OH | 8.6 | -0.21 V vs RHE | 27) |
| Cu-MOF/GO | 0.1M TBAB/DMF | HCOOH | 58 | -0.6 V vs. RHE | 35) |
| AuNN@PCN-222(Cu) | 0.1M KHCO3 | C2H4 | 52.5 | -1.2 V vs. RHE | 28) |
| Cu2FCuTCPP/FTO | 0.5M EMIMBF4/1MCH3CN | HCOOH | 68.40 | -1.55 V vs. Ag/AgCl | 36) |
| Cu2FCuTCPP/FTO | 0.5M EMIMBF4/1MCH3CN | CH3COOH | 38.8 | -1.4 to -1.65 V vs. Ag/AgCl | 37) |
| PCN-222(Cu)/C | 0.5M KHCO3 | HCOOH | 44.3 | - 0.87 to -1.17 V vs. RHE | |
| PCN-224(Cu)/C | 0.5M KHCO3 | HCOOH | 34.1 | - 0.87 to -1.17 V vs. RHE | 28) |
| 2Bn-Cu@UiO-67 | 1M KOH | CH4 | 81 | -1.5 V vs. RHE | |
| CuO/Cu-MOF | 0.5M KHCO3 | C2H4 | 50 | -1.1 V vs. RHE | 38) |
| Cu@Cu2O | 0.5M KHCO3 | HCOOH | 45 | -0.7Vvs. RHE | 21) |
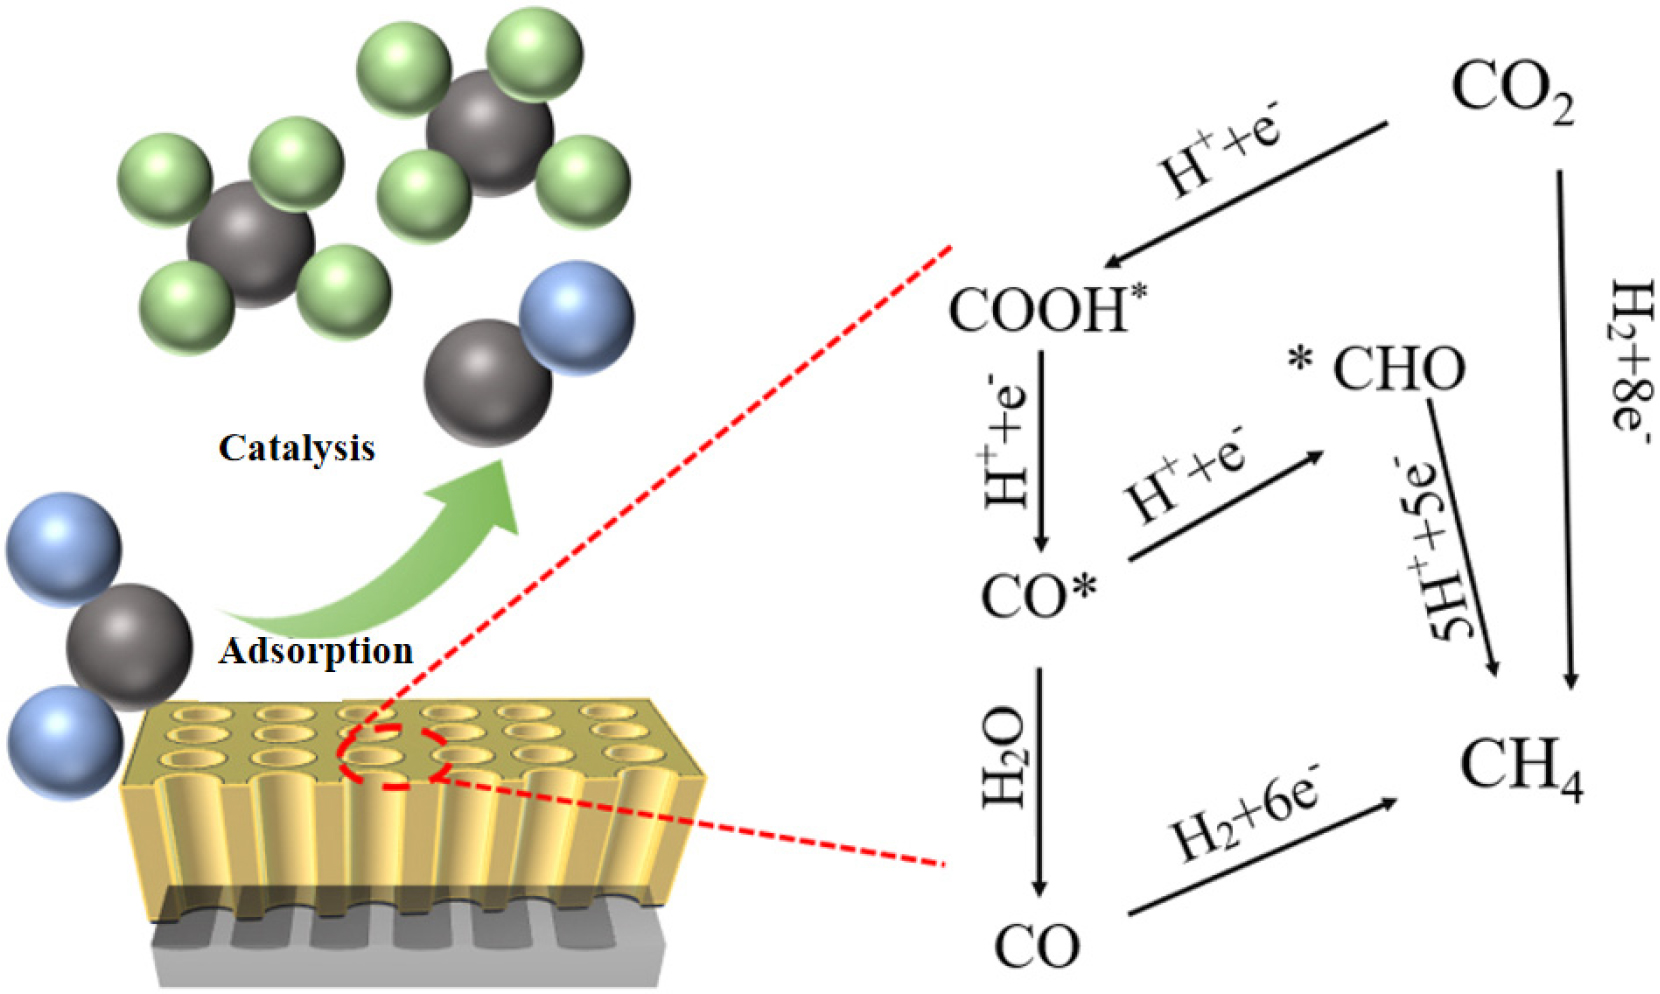
Among the products of electrochemically reduced CO2 in this system, CH4 was the primary product, while H2 served as a byproduct. CO began to form at -0.50 V, indicating that different reaction pathways were chosen depending on the applied potential. However, the catalyst selectively favored certain reaction pathways, with 1N-Cu-MOF particularly promoting CH4 formation. Therefore, the main formation mechanism was analyzed to understand how the catalyst facilitated this selective process.
In Fig. 13, three main pathways for CO2RR-CH4 are illustrated. (1) *CO serves as an intermediate, and methane is generated from the produced CO39); (2) During *CO generation, it selectively interacts with H+, activating a proton-coupled electron transfer process to generate *CHO. This step requires the addition of high-energy protons, eventually resulting in the generation of CH440); (3) The third pathway involves adsorption, where the C=O bonds of CO2 are significantly disturbed by the substrate. Electrons are transferred between CO2 and the catalyst, resulting in the *COOH intermediate formation. This intermediate then undergoes further reduction through reaction with an additional proton and electron, producing the *CO intermediate. At this point, 1N-Cu-MOF exerts its adsorption capacity, protonating the *CO intermediate to form the adsorbed *CHO. The final step of hydrogenation then results in the production of CH4.41)
4. Conclusion
The catalytic materials 0N-Cu-MOF, 1N-Cu-MOF, and 2N-Cu-MOF were successfully synthesized via a solvothermal method with different concentrations of nitrogen doping in the Cu-based metal-organic framework (xN-Cu-MOFs). Characterization using XRD, SEM, FT-IR, XPS, and BET surface area analysis revealed that 1N-Cu-MOF showed the largest SSA and pore size among the three synthesized materials. The stability and CO2RR activity of the synthesized materials were evaluated using LSV, CV, EIS, and I-T measurements. The FE was calculated through product analysis. Among the three catalytic materials, 1N-Cu-MOF revealed the best catalytic reduction performance. It attained a maximum current density equal to 50 mA・cm-2, with a charge transfer resistance equaling 8.23 Ω. The average current density was 19.9 mA・cm-2, and the FE for the reduced product methane (CH4) was 70.45 % when tested for 12 h at an overpotential equal to -0.35 V (vs. RHE).
