

1. Introduction
A typical structure of the ferroelectric has a perovskitetype, tungsten-bronze-type and the spinel-type. Perovskite type has the general formula of ABO3 such as BaTiO3 PZT (Pb(Zr,Ti)O3 et al. and typical materials of the spinel type is a LiNbO3 and tungsten-bronze-type is a NKN (NaxK1-xNbO3) et al.1). Researchers have been many studies on the perovskite type since it is well known that, among ferroelectric materials, the relatively perovskite type structure than other ferroelectric is simpler. The most widely used piezoelectric ceramic is lead zirconate titanate Pb[ZrxTi1-x]O3, or PZT.2-5) One critical disadvantage of PZT is that it contains more than 60 percent lead(Pb) by weight.5) This large lead content creates hazards during processing(lead volatilizes and is released into the atmosphere), limits applications, and is potentially environmentally toxic during disposal. Over the past few years, regulatory agencies world-wide began putting strict restrictions on the use of lead, with the exception of the electronics industry due to the lack of a suitable replacement. As a result, the study of the Pb-free piezoelectric ceramic to replace the current PZT is being accelerated.6-9)
Recently, NKN ceramics is a piezoelectric material, which receives attention in research and industry of Pbfree piezoelectric since highly phase transition temperature and electro-mechanical coupling coefficient. But it is difficult to manufacture the ceramics of high density because potassium(K) and sodium(Na) elements of constituting the NKN are a very well absorbed in the air moisture during manufacturing ceramic.10-12) In order to compensate for these disadvantages, researchers are studying ways to produce a high density of the ceramic at a low temperature such as hot pressing, spark plasma sintering methods or BaTiO3,(BT)13) SrTiO3,(STO)11) LiNbO3(LN),2) LiTaO3(LT)14) doping method.14-16) Hot pressing, spark plasma sintering method can be a problem to make a specimen of the same conditions, because the process is complicated and difficult making ceramics. So, the research focus has been to improve both the sinterability and piezoelectric properties of KNN by investigating solid solutions such as KNN-CaTiO3,17) KNN-STO,18) KNN-BaO,19) KNN-LN,20) KNN-LT,21) KNN-LT-LiSbO3,22) and KNN-LiSbO3.23) It is commonly accepted that the piezoelectric properties appear to be optimum when the amount of K+ on the A-site of the perovskite is approximately equal to 0.5 mol.2)
Recently, Guo et al studied the piezoelectric and dielectric properties for the NKN-LN (0.0 ≤ x ≤ 0.2) ceramic.2,14-15,20) They reported that A phase K3Li2Nb5O15 with tetragonal tungsten bronze structure begins to appear after the Li content reaches its solubility limit in the A sites of NKN ceramics (x = 0.08). A morphotropic phase boundary between orthorhombic and tetragonal phases is found at 0.05 ≤ x ≤ 0.07. Enhanced piezoelectric and electromechanical responses d33 = 200 − 235 pC/N, kp = 38%− 44 %, and kt = 44%− 48 % are obtained for samples with composition near the MPB(morphotropic phase boundary). And park et al proposed that the ferroelectric phase transition of NKN-LNx (x ≤ 0.1), is a second-order transition without thermal hysteresis, and NKN-LNx (x ≥ 0.2) is a weak first-order transition with small thermal hysteresis.24) Thus, their results demonstrate the possibility that the concentration of x~0.2 may be the critical concentration for a first-to-second-order-ferroelectric phase transition However, the structure of solid solution transforms from orthorhombic to tetragonal symmetry due to the large distortion caused by Li+.
Therefore, it is necessary to investigate further electrical properties of NKN-LNx ceramic because it seems that the effect of piezoelectric caused by Li+ to be important. And there has been little research of ionic conduction in NKN-LNx below critical concentration x~0.2. Thus, the purpose of this study is to investigate the electrical properties (Na0.5K0.5)NbO3 in terms of its LiNbO3 content (below critical concentration x).
2. Experimental Procedure
Pb-free (1-x)(Na0.5K0.5)NbO3-xLiNbO3, i.e., NKN-LNx (x = 0.1, 0.2), was prepared by mixing the oxides, K2CO3 (99% purity), Na2CO3 (99% purity), LiNbO3 (99% purity) and Nb2O5 (99 % purity) in a molar ratio used in the conventional solid state reaction method. Before being weighed, the K2CO3 and Na2CO3 powders were first dried in an oven at 200 °C for 10 h to minimize the effect of moisture. These powders were then milled with ZrO2 balls for 20 h using ethyl alcohol as a medium and dried. The dried powders were calcined at 850 °C for 2 h. After calcination, the powders were ball-milled again for 20 h and, dried, after which PVA(4 wt%) was added as a binder. They were then pressed into disks with diameter of under 13 mm. After burning off the PVA, the pellets were sintered at 1,070 °C for 2 h. The crystal structures were determined by X-ray power diffraction analysis using CuΚα radiation(Philips X’ Pert - MPD system). To examine their dielectric and piezoelectric properties, the ceramics were polished and painted with silver paste on both surfaces, and fired at 800 °C for 30 min. The samples were poled using 25 kV/cm in silicon oil bath at 100 °C for piezoelectric property measurements. The piezoelectric properties were measured using an LCR meter(HP4192A, HEWLETTPACKARD). The dielectric properties were measured using an Solartron1260 at temperature ranging from room temperature to 600 °C with heating rate of 0.2 °C/min in the frequency range of 10 Hz to 1 MHz.
3. Results and Discussions
Fig. 1 shows the x-ray diffraction patterns of NKNLNx ceramics. A phase K3Li2Nb5O15 (ICDD: 52-0157) with a tetragonal tungsten bronze structure appear at x = 0.1, 0.2. Although both NKN and LN have octahedral NbO6 basic structure units, they belong to different structures. NKN has the perovskite structure with space group Amm2 (). LiNbO3 however has the lithium niobate structure, which can be described as a heavily distorted perovskite or an ordered phase derived from the corundum structure with space group R3C ().20) Thus, it is believed that two effects on the structure of NKN ceramics have been observed in NKN-LN ceramics.
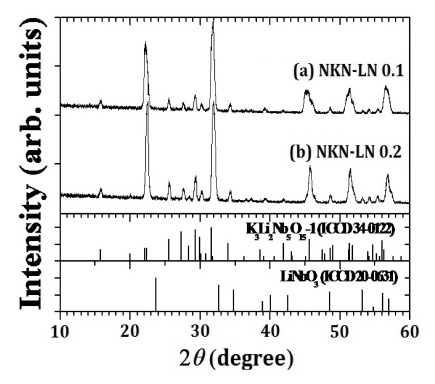
Fig. 1
X-ray diffraction patterns of (x-1)(Na0.5K0.5)NbO3-xLiNbO3, NKN-LNx specimens with x = 0.1 and 0.2.
The (a) impedance magnitude and (b) phase of a NKNLNx ceramics as a function of frequency and parameterized by the x contents are shown in Fig. 2. The change of phase which appears at measuring frequencies between 260 Hz and 270 Hz is one peak for NKN-LN0.1 ceramic, while two Resonance-Antiresonance peaks were occasionally detected for impedance. In the case of NKNC LN0.2, the change impedance and phase are observed at measuring frequencies between 270 Hz and 280 Hz. The peak frequency of phase and impedance moves to higher frequencies with increasing x, and the phase and impedance intensively increases with the x contents. The x dependence of the NKN-LNx ceramic can be obtained by determining the frequency at which the phase maximum of each curve occurs.
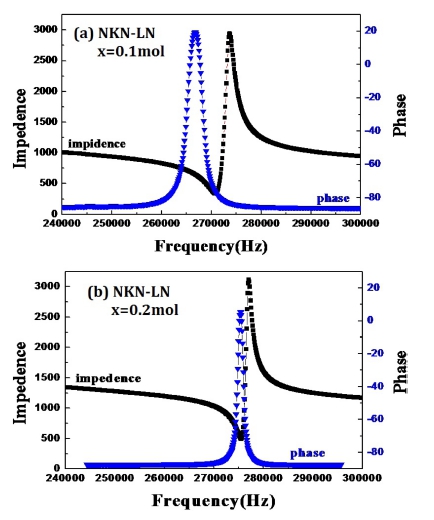
Fig. 2
Frequency dependence of (a) impedance and (b) phase of the (x-1)(Na0.5K0.5)NbO3-xLiNbO3, NKN-LNx specimens with x = 0.1 and 0.2.
Electric-mechanical bond coefficient, kp was calculated with following equation:25-26)
where, Δf = fa − fτ, fτ is resonance frequency, and fα is anti resonance frequency and The kp was obtained by the phase and impedance data to Eq. (1), which is shown in Fig. 2(a) and (b). The values of electric-mechanical bond coefficient, kp = 16 % in the NKN-LN0.1 and kp = 9.1 % in the NKN-LN0.2 ceramics were obtained from the Eq. (1). The value of kp is reduced almost by half with increasing LiNbO3 contents. This means that the piezoelectric properties of the NKN-LNx ceramic depend on the LiNbO3 content. When the resonance results compared to the results of the x- ray experiments, the possible origin of the piezoelectric property for NKN-LNx ceramic is considered to be the increasing electrical conductivity and dielectric loss because the coexistence of two or more of NKN-LNx structure.
Thus, we investigated the dielectric properties of NKNLNx ceramic because the need to recognize the electrical conductivity and dielectric loss. Fig. 3(a) and (b) show the real (ε') and imaginary (ε'') parts of the complex dielectric constant of NKN-LN0.1 ceramic, shows a weakly sharp maximum around Tc = 462 °C,. On further heating above Tc, ε' decreases slightly with increasing temperature and ε'' increase continuously and rapidly for all measuring frequencies. Fig. 4(a) and (b) show the ε' and ε'' of NKN-LN 0.2 ceramic, show a broad maximum around Tc = 500 °C. The behaviors of ε', ε'' in the case of the NKN-LN0.2 are similar to the case for NKN-LN0.1 ceramic. And the ferroelectric phase transition temperature Tc shifted to a higher value with an increase in the LN content, whereas the dielectric peak broadened. The changes of ε' of NKN-LNx ceramics are similar to results reported previously.2,14-15,20)
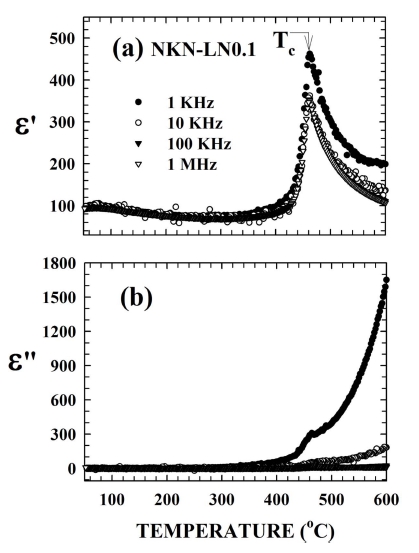
Fig. 3
Temperature dependence of (a) the real, ε' and (b) imaginary, ε'' parts of the complex dielectric constant of the (x-1)(Na0.5K0.5) NbO3-xLiNbO3, NKN-LNx specimens with x = 0.1.
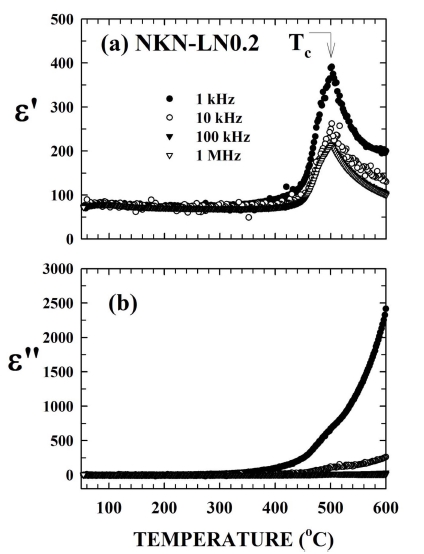
Fig. 4
Temperature dependence of (a) the real, ε' and (b) imaginary, ε'' parts of the complex dielectric constant of (x-1)(Na0.5K0.5)NbO3- xLiNbO3, NKN-LNx specimens with x = 0.2.
Park et al reported that the weakly sharp peaks around Tc for the NKN-LN0.0 and NKN-LN0.1 sample show a second-order phase transition without thermal hysteresis and a weakly first order- phase transition in the case of NKN-LNx (x ≥ 0.2), they proposed that the concentration of x~0.2 may be the critical concentration for a first- to second-order-ferroelectric phase transition.24) At lower LiNbO3 (x ≤ 0.07), Guo et al.2,14-15,20) reported that Li mainly replaces Na and K in the A sites of ABO3 perovskite structure(i.e. form a solid solution), leading to a linear shift of the Tc to higher temperature. However, the structure of solid solution transforms from orthorhombic to tetragonal symmetry due to the large distortion caused by Li+.
However, we observed that dielectric dispersion of NKN-LNx ceramics start near 400 °C and the value of ε'' increases gradually to 400 °C and then increases rapidly with further heating. It is well known that ε'' is related to the ionic conductivity, σ.27) So, ε'' increases gradually because the electrical conductivity increases above 400 °C. The corresponding increase in the values of ε'' may be due to increase in number of dipoles in the interlayer space while the corresponding decrease in the values ε'' may be due to the increase in the leakage current due to the higher doping.
In order to clarify the physical origin of the dielectric dispersion of NKN-LNx ceramics above 400 °C, we displayed ε" by KBTε" as shown Fig. 4(a) and (b).
Generally, the ionic conductivity σ was found to obey the following relation27)
where ω is the frequency of the applied field and ε0 the vacuum permittivity.
And the ionic conductivity is given by the diffusion constant through the Einstein relation27) follow as :
where, N is number of charge carrier, the diffusion coefficient, D is related to the migration of ions or ion vacancies in the ionic crystals. e is ionic charge, kB is Boltzmann constant. And formation energy, Φ of ionic vacancy in the crystal and the probability, P of the ions to jump over the potential barrier represented as follows:
where a is distance of atom in the crystal, C is factor is the change of entropy caused by ion vacancy v is the ionic frequency. Thus, By Eq. (5), D is represented as follows.
where, activation energy E = Δ + Φ/2 is dc conductivity caused by bulk at high temperature region, which corresponding to intrinsic properties and It is well known that activation energy, E = Δ is related to the ionic hopping of mobile ion. Thus one can obtain the relation as:
This implies that when ln(KBTε'') is plotted against 1/T, it should fall on a straight line with the slope of E□/KB: Indeed, the present data show reasonable agreement with Eq. (7) as is seen from Fig. 5(a) and (b). KBTε" increase slightly with increasing temperature and then it sharply rises around Tc = 462 °C for the NKN-LN0.1 and drops discontinuously around Tc = 500 °C for the NKN-LN0.2. The total activation energies are thus obtained as EI = 1.76 eV(above Tc) and EII = 0.78(below Tc) for the ionic hopping of mobile ions in NKN-LN0.1 and EI = 1.55 eV(above Tc) and EII = 0.81(below Tc) for ionic hopping of mobile ions in NKN-LN0.2. The interval between curves 100 Hz, 1 kHz, 10 kHz, 100 kHz, 1MHz are almost equal. These results are well described by Eq. (7) associated with the ionic hopping conduction.
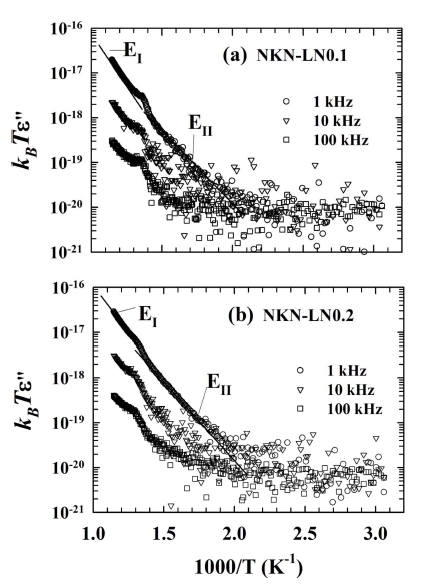
Fig. 5
The relationship between ln(kBTε'') and 1/T for (a) NKNLN0.1 (b) NKN-LN0.2 ceramics. Solid lines fitted by Eq. (7). The slope of the straight lines corresponds to the activation energies.
4. Conclusion
Potassium sodium niobate (Na0.5K0.5NbO3 ; NKN) ceramics with the addition of LiNbO3, (1-x)(Na0.5K0.5)NbO3 - x(LiNbO3), NKN-LNx (x = 0.1, 0.2), NKN-LNx ceramics have been synthesized by solid-state reaction method. Crystal structures are confirmed by the X-ray diffraction. The temperature and frequency dependence of dielectric, piezoelectric properties were investigated by complex dielectric constant, electromechanical coupling factor, respectively. The piezoelectric properties, electrical conductivity, phase transition temperature of the NKN-LNx ceramic depend on the LiNbO3 content. The electrical conductivity and activation energies change at the Tc, suggesting that both mechanisms are correlated with ion migration. The activation energies associated with hopping conduction are EI = 1.76 eV(NKN-LN0.1) and EI = 1.55 eV (NKN-LN0.2), above Tc and EII = 0.78(NKN-LN0.1) and EII = 0.81 (NKN-LN0.2) below Tc
