

1. Introduction
Zirconium is mainly used as cladding tubes and structural materials in the nuclear power industry due to its low neutron absorption cross section and good mechanical properties1). Zirconium is commercially produced by the Kroll process, in which zirconium oxide undergoes chlorination to produce ZrCl4, whose subsequent reduction with liquid Mg yields Zr metal along with MgCl22). However, with increasing interest in environmentally friendly processes, Zr production through processes that obviate the need for chlorination reaction has gained attention3-8). In particular, electrolytic processes such as the FFC(Fray-Farthing-Chen) process involving direct reduction of oxide in molten salts3), and the OS(Ono-Suzuki) and EMR(electronically mediated reaction) processes involving indirect reduction of metal oxide after electrolytic reduction of Ca are effective methods4,5). In the LCE(liquid cathode electrode) process, a liquid metal cathode is used to recover the reduced high melting point metal as a liquid phase at moderate operation temperatures. The LCE process is a method of indirect reduction of metal after the electrolytic reduction of Ca8-9). The advantage of this process is that the metal reduced on the cathode surface is subsequently dissolved in the liquid metal cathode, preventing post oxidation by decreasing the surface area.
To produce Hf-free electrolytes, a pickling solution generated during the Zr cladding tube production process was used. During the manufacturing of fuel cladding, several pilgering and intermediate heat treatments are performed10-11). In order to remove impurities generated during the high-temperature and high-pressure pilgering process and the oxide film produced in the intermediate heat treatment process, pickling is essentially carried out with a solution containing a mixture of nitric acid and hydrofluoric acid11). The reaction of the nuclear fuel cladding tube and the pickling solution is given by Eq. (1).
As the process proceeds, the efficiency of the pickling solution decreases, and thus, it is necessarily periodically replaced. However, the waste pickling solution contains reactor-grade Zr since Zr used in cladding production uses Hf-free materials due to its low neutron absorption cross-section, as per ASTM B349 specifications. Previous studies have reported the recovery Zr from the waste acid solution by the addition of BaF2 forming Ba2ZrF8 in soluble precipitates, as given by Eq. (2)12). The prepared Ba2ZrF8 is considered suitable as an electrorefining electrolyte since the starting material was Hf-free.
In this purpose, the recovery of nuclear grade Zr was evaluated by using Hf-free salt Ba2ZrF. Firstly, Ba2ZrF8 was added to LiF salt to lower the melting point. Thereafter, additional experiments were carried out on three different compositions to determine the lowest melting temperature. The oxidation/reduction potential of Zr in the electrolyte was analyzed by cyclic voltammetry(CV), and the polarization behavior was analyzed by chronopotentiometry( CP). Finally, the electrorefining process was performed.
2. Experimental
2.1. Materials and equipment
Ba2ZrF8 was synthesized from Alfa Aesar(USA), BaF2 (purity > 90 %) and KNF(Korea Nuclear Fuel) by acidic waste solution (H2O:HF:HNO3:Zr = 84:1.2:14.8:1.3 wt%). The electrolyte was prepared by adding Ba2ZrF8 to LiF (purity > 99.9 %; Alfa Aesar).The composition of CuZr used as the cathode is shown in Table 2. The CuZr alloy feedstock by electroreduction of ZrO2 using a liquid Cu cathode with CaCl2-CaO electrolyte instead of commercial material. The detailed manufacturing process is reported in patent9). The tungsten rod and Ag/AgCl used for the electrodes were 99.9% pure and supplied by Sigma Aldrich (USA) and Shin Sung Carbon(Korea), respectively. All the experiments were conducted in a glove box filled with Ar gas. The concentration of oxygen and water was controlled at less than 2 ppm. In addition, the Ar pressure in the glove box was kept above the atmospheric pressure, and the inflow of material into the glove box was prevented by using an anti-chamber where 10−2 Torr was maintained.Table 1
2.2. Determination of salt melting points
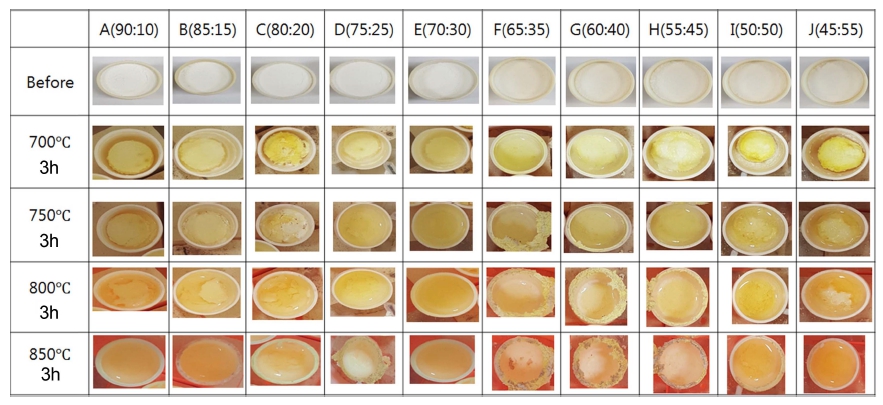
The compositions used in this experiment are shown in Table 1. As shown, 5 wt% of Ba2ZrF8 was added and the heating rate was 5 °C/min in air atmosphere. The holding time was 3 h at 700, 750, 800, and 850 °C, respectively.
2.3. Cyclic voltammetry test
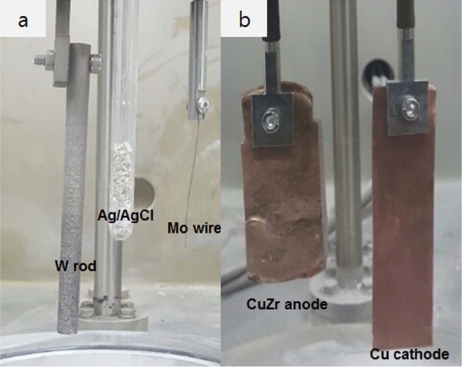
The reduction potential of Zr was determined from the CV experiment using the Ba2ZrF8-LiF(65:35 mol%) binary electrolyte. Further, a Mo wire, W rod, and an Ag/AgCl electrode were used as the working electrode, counter electrode, and reference electrode, respectively, as shown in Fig. 1(a). The process temperature was selected as 780 °C, and its setting will be described in the results and discussion section.
2.4. Polarization behavior and electrorefining experiment
Fig. 1(b) shows the experimental setup for chronopotentiometry consisting of a CuZr anode and a pure Cu cathode. The CuZr anode, produced by the LCE-assisted electroreduction method in our laboratory, had dimensions of 40 mm × 60 mm × 10 mm and contained 14.9 wt% Zr and 5.4 wt% residual Ca. The behavior of the polarization curves was analyzed by applying current densities of 1, 5, 10, 20, 30, and 50 mA/cm2. Electrorefining was carried out by applying a certain current density based on the polarization curve. The process time was 10 h. After electrorefining, vacuum distillation was performed at 1300 °C for 24 h followed by arc melting to produce a pure Zr ingot. The resulting materials were analyzed with a fieldemission scanning electron microscope(FE-SEM, JEOL JSM-6700F) equipped with an energy dispersive X-ray (EDX) spectroscope. The amount of residual oxygen in the Zr ingot alloy was analyzed by an Eltra ONH-2000 analyzer(Germany), and Cu was analyzed by inductively coupled plasma atomic emission spectroscopy(ICP-AES, scientific iCAP 700).
3. Results and Discussion
3.1. Salt melting points
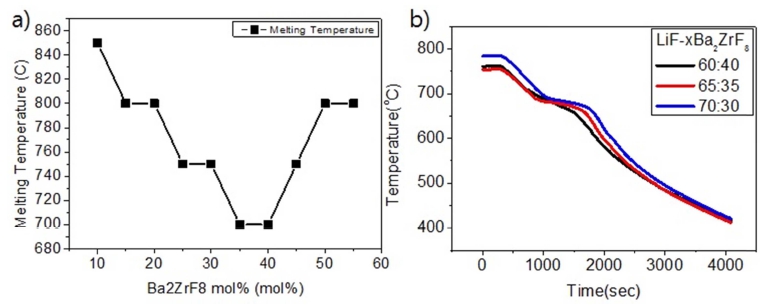
Unfortunately, there are no reports on the phase diagram of LiF- Ba2ZrF8 system. In order to determine the approximate eutectic salt composition with lowest melting point, the melting point was determined whether the liquid phase was formed or not. Fig. 2 shows the in situ observation results of the melting experiments of LiFBa2ZrF8 system after holding it for 3h at each melting temperature. This allowed us to observe the conditions of molten samples not only at the melting point but also at stability for each temperature. As can be seen in Fig. 3(a), liquid phases are observed in E (65:35) and G (60:40) at 700 °C. The change in liquid phase at higher temperatures can be seen in Fig. 2(a). The melting point decreased until the amount of Ba2ZrF8 increased to 40 mol%. Thereafter, a decrease in eutectic temperature can be seen for Ba2ZrF8 at 35~40 mol%. Additional experiments were conducted for the all compositions at elevated temperatures. It was found that the salt samples(F, G, and H) partially evaporated at 750 °C and completely disappeared from the crucibles at 850 °C. Further experiments were performed to determine the solidus and liquidus lines, as shown in Fig. 3(b). After raising the temperature up to 800 °C at a rate of 5 °C/min, a thermocouple was placed into the liquid salt after 3 h of holding time and the change in temperature was measured using a data logger. In Fig. 3(b), a plateau can be seen where the constant temperature is maintained; this region of constant temperature is due to the phase change from liquid to solid. The first inflection point where the temperature is constant is the liquidus line, and the point where the temperature decreases again is the solidus line. As can be seen, the liquidus and solidus temperatures are the lowest at LiF:Ba2ZrF8 = 65:35.
3.2. Electrochemical properties of the electrolyte
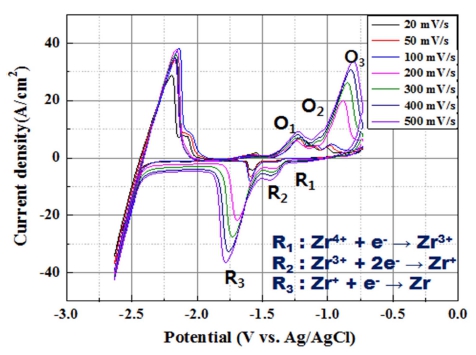
For Zr electrorefining, the redox behavior of Zr in the as-prepared electrolyte was analyzed by CV and is shown in Fig. 4. The potentials of the working and counter electrodes were monitored using the Ag/AgCl reference electrode. Fig. 4 reveals that Zr reduction occurs below −1.6 V (vs. Ag/AgCl). The number of reactive electrons according to each reduction potential was confirmed by Eq. (3)13), where Ep/2 is the half peak potential, Ep is the peak potential, R is the gas constant (8.314 J/mol·K), T is the temperature (1053 K), n is the number of electron, and F is Faraday constant (96485 C/mol).
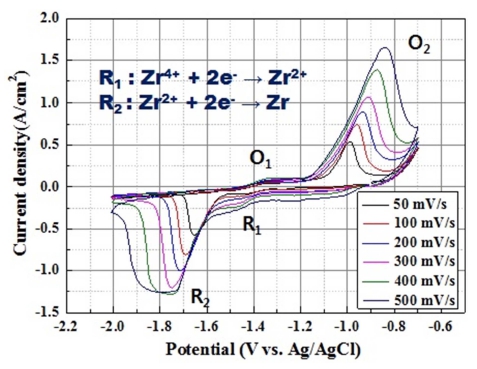
The reduction in Eq. (4) occurred at the potential of −1.4 V (vs. Ag/AgCl) and that in Eq. (5) occurred at −1.51 V (vs. Ag/AgCl). The results showed that Zr reduction involved two steps.
Zr reduction in KCl-LiCl-ZrCl4, which is a chloridebased salt, was reported at reduction potentials of −1.0 V and −1.2 V in two steps, whereas in a fluoride system, Zr reduction occurred in one step14-15). Another study revealed that Zr reduction in LiF-KF-Zr4, a fluoride-based salt, occurred in three steps at −1.15, −1.50 and −1.62 V (vs. Pt)16,17).
In this study, the difference between the two reduction potentials in the CV measurements was about 0.1 V. Moreover, the reduction potentials are different from those previously reported. This was attributed to the influence of the hydrides present in the Ba2ZrF8 electrolyte, which were synthesized in aqueous condition. To solve this problem, the salt cleaning process was carried out for the electrolyte to remove residual hydride, and the CV measurement was performed again under the same conditions( Fig. 5). Comparing Fig. 4 and Fig. 5, it can be seen that an additional reduction peak occurs at −0.9 V (vs. Ag/AgCl). From the re-measured CV graph, the number of reactive electrons was estimated using Eq. (3). The reduction reaction at −0.9 V (vs Ag / AgCl) is shown in Eq. (6), whereas that at −1.41 V (vs Ag / AgCl) is given in Eq. (7). In addition, Zr reduction occurred at −1.51 V (vs Ag / AgCl), which is given by Eq. (8). The measured potential difference of the reduction peaks was similar to that of LiF-KF-Zr (1 wt%). The reduction potential of Zr is −1.54 vs. SHE, and the potential difference between Ba, Li, and F is large. This implies that electrodeposition does not occur at −1.5 V.
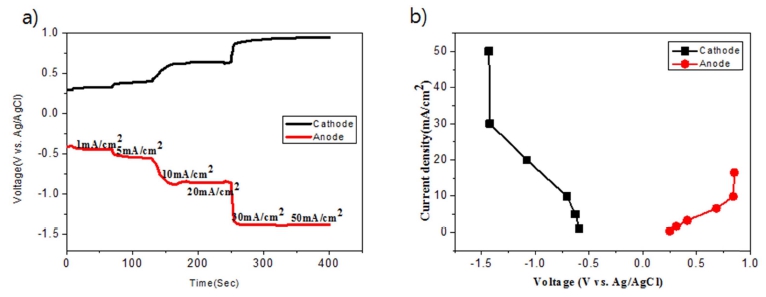
Chronopotentiometry was performed, as shown in Fig. 6, to evaluate the polarization characteristics in the Zr electrorefining process. The applied current density was sequentially increased from −1 ~ −50 mA/cm2 in 1 min and the potentials of the positive and negative electrodes were measured according to the applied current density. Although the applied current density was increased to −30 mA/cm2, the current density remained constant at −1.50 V (vs. Ag/AgCl). At a current density of −30 mA/cm2, a potential capable of reducing Zr to metal was formed. Further, the applied current density was increased to −50 mA/cm2 to prevent the inflow of oxygen by adjusting the deposited particle size by the formation of overvoltage.
3.3. Recovery of Zr
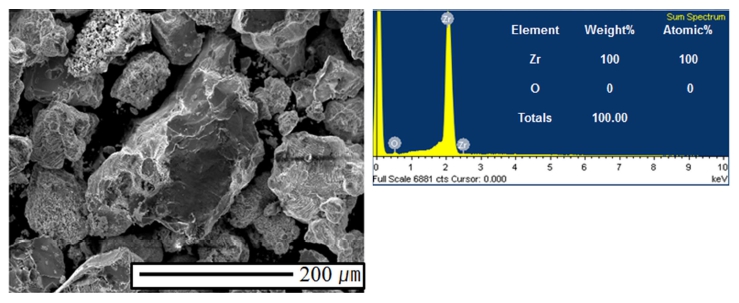
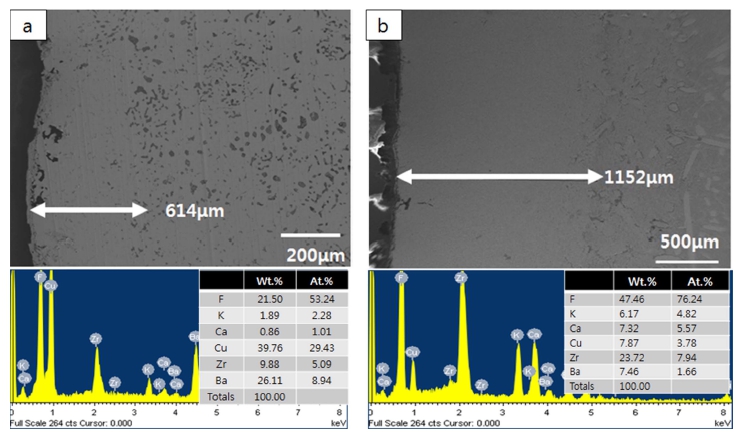
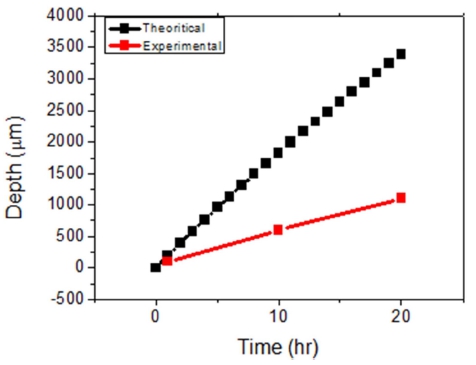
Electrolytic refining of Zr was carried out for 10 h by applying a current density of −50 mA/cm2, as shown in Fig. 7. The potential of the idle cell was measured in the range of about 0.7 to 1.0 V. In the case of anode, the potential was maintained constant at the initial stage of the process; however, the potential started fluctuating with time. In the initial stage, Zr was easily dissolved into the electrolyte on the surface; however, the active Zr surface area reduced as the reaction progressed. Hence, Zr inside the CuZr alloy anode dissolved into the electrolyte through the Zr depletion zone, which generated a resistance and led to potential fluctuation. In order to decrease the anodic dissolution resistance, the thickness of the anode and the Zr concentration should be optimized. After 10 h of electrorefining, distillation was performed to remove the salt from the surface of the electrodeposited reductant. The reduced product, shown in Fig. 8(a), was ground in globe box Ar gas atmosphere, as shown in Fig. 8(b). After charging into a stainless crucible(Fig. 8(c)), salt distillation was carried out for 24 h at 1300 °C in vacuum at 10−2 Torr(Fig. 8(d)). The metal powders were recovered and arc melting was carried out in vacuum at 10−5 Torr, followed by oxygen analysis. Table 3. shows the impurities in the Zr ingot. From oxygen analysis and ICP-AES analysis, about 2000 ppm of oxygen and 3 ppm of copper were detected. Fig. 9 shows the SEM and EDX results of the metal powders and CuZr Alloy. In the case of metal powders, no residual salts were detected in EDX analysis. The dissolved depth of CuZr alloy with time is shown in Fig. 10. The comparison of theoretical Zr dissolved depth and experimental Zr dissolved depths is shown in Fig. 11. It can be seen that with increase in time, the dissolved depth decreases. Thus, it was inferred that the Zr dissolved on the surface decreased and the resistance was generated when the Zr from the bulk dissolved into the electrolyte. It was found that the recovered Ba2ZrF8 from the waste pickling acid could be utilized for manufacturing nuclear-grade Zr to replace the current Kroll process. However, further study is required to optimize the process.
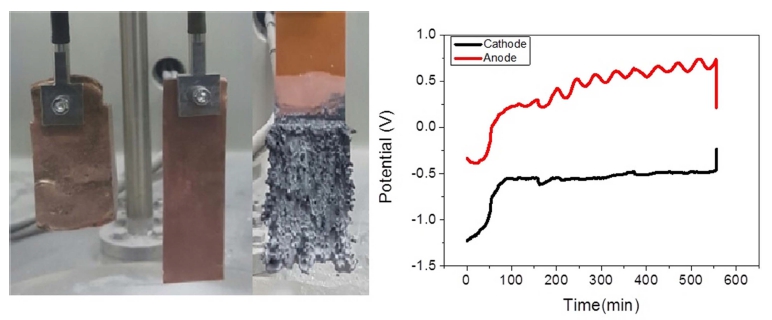
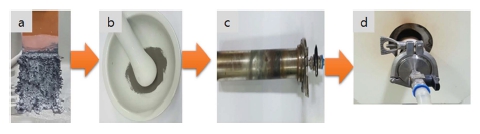
Fig. 8
Recovery of pure Zr deposit using vacuum salt distillation method. a) as-harvested Zr, b) Grinding, c) Stainless crucible, d) vacuum salt distillation.
Table 3
Composition of Zr ingot prepared by electrorefining.
| Composition | Zr | Al | Cu | Hf | O |
|---|---|---|---|---|---|
| ppm | Bal. | 140 | 3.5 | 13.2 | 2000 |
4. Conclusions
1) The eutectic composition of the Ba2ZrF8-LiF binary electrolyte is 35:65, with a melting point of 686.46 °C. This composition is suitable for electrolytic refining.
2) Pretreatment of Ba2ZrF8 is required for its electrochemical improvement for the electrolytic refining process.
3) Zr ion is reduced to Zr metal through a three-step electrochemical reaction in the Ba2ZrF8-LiF binary electrolyte.
4) Zr in CuZr anode dissolves electrochemically, and the electrolyte components were detected inside the anode after the dissolution of Zr.
5) The dissolved Zr ions are electrodeposited on the cathode, and the copper and oxygen concentration were found to be 3 ppm and 2000 ppm, respectively.
