

1. Introduction
Curtain walls emerged as a universal envelope form for office buildings since 1952, when Lever House was built with curtain walls in New York. Curtain walls perform all the functions of an envelope in a light structure, but they are vulnerable in terms of their thermal performance.1) This study intended to interpret the thermal performance of a curtain wall system which makes up the envelope of an office building with U-factors. A curtain wall system is mainly made of aluminum-based metal frames and double glass units, along with high molecule insulation materials. It has important impacts on the annual energy consumption of a building for heating and cooling based on the forms of its metal materials and the thermal characteristics of its double glass units. To ensure its structural stability and thermal performance, a curtain wall system is made of complex sectional shapes. Extensive studies are needed to elucidate their thermal performance. In South Korea, insulation regulations for buildings have continued to be reinforced. According to the energy saving design criteria for buildings, the heat transmission coefficient for different building sections by area was 1.800 W/m2·K or less in 2009 and 1.400 W/m2·K or less in 2011.2-4) The revised criteria of 2018 for Central Area 1 reinforced the K-value for windows making direct contact with the air to 1.300 W/m2·K or less. A curtain wall envelope system is one of the major factors that affects the annual energy consumption of an office building, which means that there should be U-factor analysis of a completed office building to set a direction for improving its annual energy need. The present study aimed to provide strategic data for the target office building to design a plan for improving its annual energy consumption through the U-factor analysis of its curtain wall system.
Previous studies on curtain wall systems and their related criteria have focused on the improvement and development of the metal frames that make up a curtain wall and the insulation materials for greater insulation performance.10-13) For metal frames used in a curtain wall, the current trend is to use high density polyurethane insulation bars and polyamide of high heat conductivity to improve insulation performance. Insulation bars are made by inserting high molecular materials with low heat conductivity in metal frames to improve the thermal performance of a frame.14-17) Polyamide is a type of engineering plastic and crystalline plastic with high shock resistance. Polyamide in a solid state containing glass fiber is inserted in a metal insulation bar that is to be compressed. Polyurethane materials are made by filling a metal with high density polyurethane in a liquid state and hardening it. In 2016, the thermal performance requirement for curtain wall systems was increased to 1.3 W/m2·K, which resulted in the application of polyamide thermal barriers and polyurethane materials in thermal break materials.5-9) Frames are classified into cap, 2-side, and 4-side hidden types with the application of fix, fix-vent, and vent types. In response to the reinforcement of insulation regulations, high molecular materials have been applied to curtain wall systems in recent years. In this study, we suggest that the molecular structure of the polymer material is closely related to thermal conductivity. To improve Ufactor and thermoelectric conductivity, polymer materials and metal frames used are important factors.
2. Experimental and Methodology
2.1. Materials
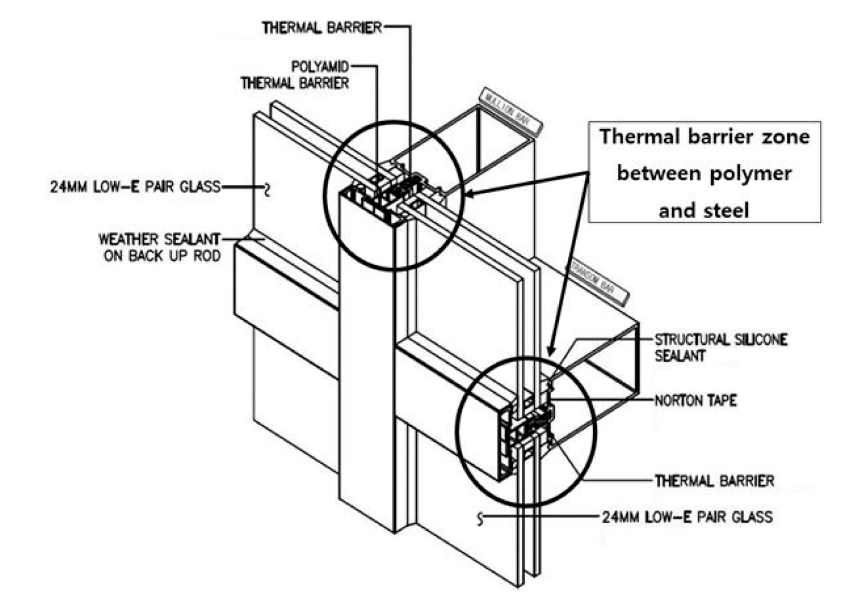
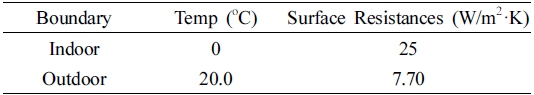
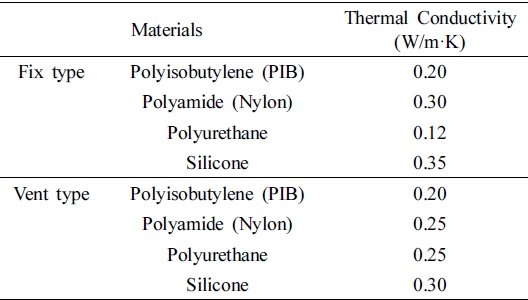
The target curtain wall system consists of fix and vent types. The vent-type frames were applied to entrances and project windows. From S 1 and S2, the elevations and dimensions show the frame composition of the target curtain wall system along with the main target point of interpretation. The fix-type windows had an area of 12.80 and 16.85 m2 each. The area of the frames was 3.90 and 6.06 m2 each. The area of glass was 8.90 and 10.78 m2 each. The sections to be interpreted were marked in heads, jambs, transoms, mullions, and sills, and in the fix and vent types. Fig. 1 shows the 3D sectional details of the fix part which includes mullions, which are vertical members comprising the curtain wall system, and cross transoms, which are horizontal members. Double glass of 24 mm in thickness—consisting of common plate glass of 6 mm, argon gas-filled glass of 12 mm, and coated glass of 6 mm Low E—was applied to the curtain wall system. Warm edge spacers and warm-light spacers were applied to the insulation space of double glass. Table 1 presents the heat conductivity of insulation materials applied to the curtain wall system in the fix and vent types. In the fix type, the major insulation materials were polyamide, polyisobutylene, and polyurethane. In the vent type, polyurethane and polyvinylchloride, which is flexible, and a 40 % softener were applied for insulation and thermal break. Fig. 2 shows the Schematic chemical formula: (a) Polyisobutylene, (b) Polyamide, and (c) Polyurethane.
2.2. Method for geometry data
Geometry data was collected for interpretation modeling including the structural characteristics and dimensions of fix and vent parts in a curtain wall system by the section; the sectional shapes of heads, mullions, transoms, sills, and jambs; and the area of frames and edges. The physical property values of frames, glass, and insulation materials were collected as part of the input data needed in U-factor interpretations; thirdly, the curtain wall system was divided into fix and vent sections with 20 points designated for interpretation in major sections including heads, mullions, transoms, sills, and jambs. U-factor and U-value interpretations followed based on the setting of boundary conditions and the modeling of interpretation sectional shapes; finally, interpretation results were analyzed to obtain the final conclusions.
2.3. Methodology and Simulation
For the curtain walls, U-factor analysis was conducted based on two-dimensional steady-state heat transfer analysis. For analysis, the ISO 12631 method currently used in place of ISO 15099,7) ISO 10077,5,6) and EN 13947 was applied. The ISO 10077 and 15099 analysis methods are mainly distinguished according to the way that a linear thermal bridge is reflected on the insertion of glass. With ISO 15099, the area of a certain distance from the insertion of glass was identified as an edge in Eq. (1), and U-factors were calculated by reflecting the heat transmittance coefficient and the area weight of the edge in the table. For the greater insulation performance of frames containing the edge, the curtain walls had sealed air layers, thermal break materials, and sealing materials inside them to keep the airtight state. In the frames, thin high molecular materials were combined in the direction of frame length, and they maintained a certain sectional shape. In the case of ISO 10077, linear heat transmittance coefficients were applied in the calculation of curtain walls' heat transmission coefficients along with linear heat transmittance coefficients reflecting linear length, as seen in Eq. (2).
Heat flows were assessed in the glass, frame, and edge parts of the curtain walls. According to LBNL THERM 6.3/WINDOW 6.3 NFRC (Simulation Manual 2011), an edge part in a curtain wall is defined as the part 63.5mm away from a frame. According to NFRC 1002 of NFRC, a U-factor is defined as a measure capturing the heat loss rate through windows on the evaluation list of windows' thermal performance. The total heat transmission coefficients of the curtain walls were thus calculated based on the heat transmission coefficients of spacers, which kept the distance between glass units at a certain interval, and edges, which were contact points between frames and glass.
Thermal performance analysis was conducted with the modeling of sections in heads, jambs, transoms, mullions, and sills that made up a curtain wall system according to the fix and vent parts. Double glass of 24 mm—consisting of float glass of 6mm, argon gas-filled glass of 12 mm, and low-E glass of 6 mm—was applied to the curtain walls. Uw represents the heat transmittance coefficient of windows (W/m2·K); Agv is the area of glass (m2); Af is the area of a frame (m2); At is the area of a window (m2); Ugv is the heat transmittance coefficient of glazing (W/m2·K); Uf is the heat transmittance coefficient of a frame (W/m2·K); lψ is the length of glass edge(m); and ψg is a linear heat transmittance coefficient (W/m2·K) used in response to the complex impacts of glass, spacers, and frames. ISO 15099 proposes a method of calculating linear heat transmittance coefficients via two-dimensional thermal analysis.
2.4 Boundary Conditions
In setting the environmental conditions for U-factor analysis, the study first set indoor and outdoor boundary conditions based on the “methods of measuring insulation performance in windows and doors” in KS F 2278. The indoor and outdoor environmental conditions include indoor and outdoor temperatures of 20 and 0 °C, respectively, according to ISO 10077-2:2017 Table 1 (standard indoor and outdoor temperature table to be applied in calculations), as well as indoor and outdoor surface heat transfer resistance of 0.13 and 0.04 m2·K/W, respectively, according to ISO 10077-2:2017 Table 1 (standard indoor and outdoor surface heat transfer resistance table to be applied in calculations), and 0.2 m2·K/W for the indoor vertical sides and influential parts. The heat transmittance coefficients of curtain wall frames containing screw effects and those containing no screw effects were 4.241 and 3.603 W/ m2·K, respectively.
3. Results and Discussion
3.1. Materials analysis
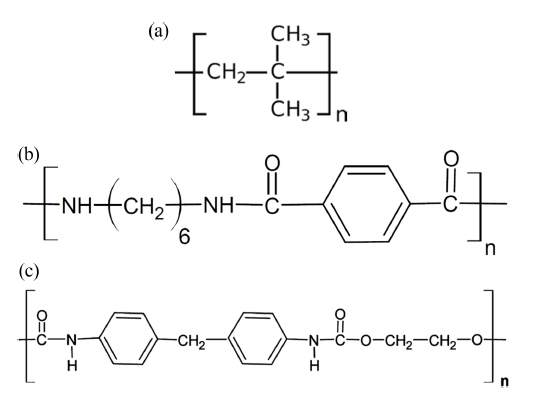
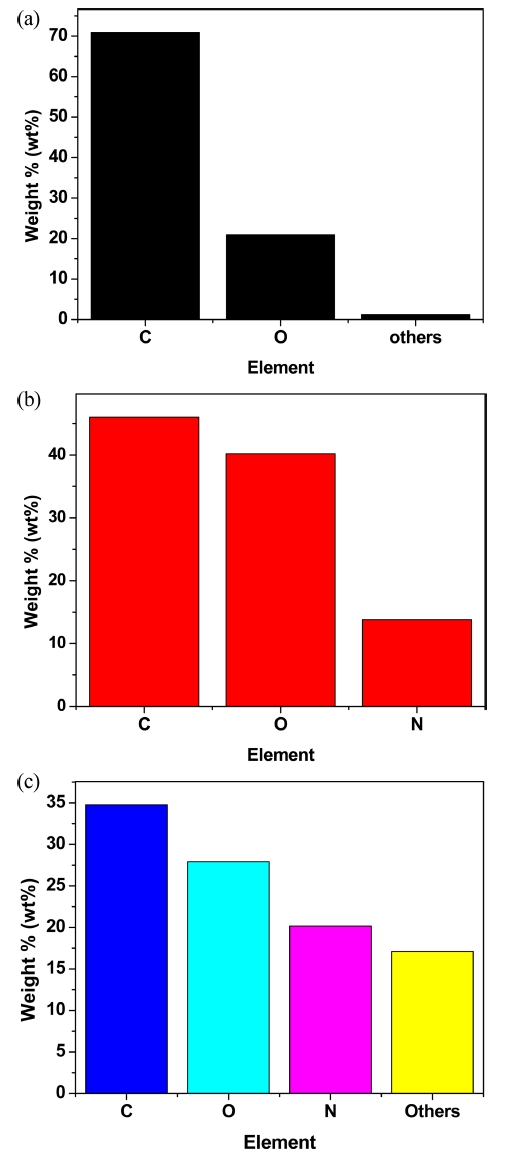
Fig. 3(a) shows the general morphology of all used samples acquired via SEM, where all aggregates were distributed onto the exterior of the large agglomerate. However, it is difficult to distinguish the sizes and shapes. The agglomerates are shown as a particle-like structure that snaps off in dissimilar orders, with a particle-like shape with fragmentary agglomerates; this particle-like structure demonstrates the form of the functionalized groups of polymer. Fig. 3[(b) and (c)] clearly ratify the variance of tightly cooperated polymers. From (b) and (c), it can be seen that all of the surfaces are evenly spread onto the smooth sheet-like structured polymer. The quantitative evaluation of elemental micro-analysis used a sample, and Fig. 4 presents the results of all polymers, which detects the chief elements of C, O, and N. And, these are the main elements of the polymer. It assumed that the others are H and impurities derived from the metal frame material.
3.2. Thermal Conductivity and Properties of Curtain Wall Frame Materials
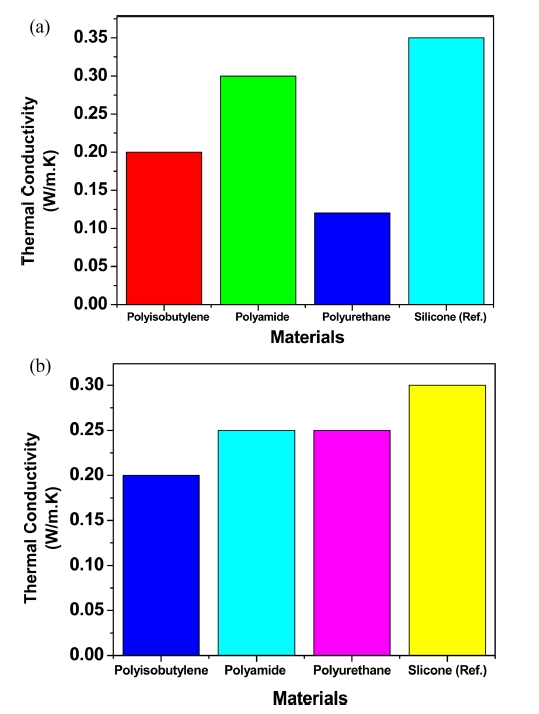
Fig. 5 shows the distribution of thermal conductivity for the frame materials as a function of the (a) Fix type and (b) Vent type. The anisotropy of the thermal conductivity of polymer can be clearly observed in this figure. The thermal conductivities of the polymers remain similar to each other. The origin of this property lies in the molecular configuration and atomic structural arrangement of the used polymer materials. According to the suggested polymer molecular structure (Fig. 2), polymers cannot make a regular crystal structure along z that substantially differs from the more similar structures of x and y. There is very clear bonding in the xy-plane, but not between the layers along z. The difference in bonding along x appears to inhibit thermal transport, thus decreasing the thermal conductivity. This may be due to the increased phonon scattering along the path of the chemical bonding. This observed lower thermal conductivity may also account for monomer structure and chain length. Alongside these data, the average (arithmetic mean) of the thermal conductivity of each polymer is listed in Table 2. These are the values most comparable to the experiment, where the units of polymer and monomer are randomly oriented. The overall trend in the thermal conductivity depends on the temperature condition, as is the case for most materials.7) As presented in Table 1, the lower thermal conductivity along high lighting or temperature affects the magnitude of its influence. There have been a number of studies examining the thermal conductivity of polymer. The data show considerable variation depending on the density of the material and the particular chemical composition chosen for study. One might anticipate that the non-stoichiometric material would have a lower thermal conductivity due to the introduction of point defects which act as phonon scattering centers. However, Hoshino et al. found the thermal conductivity to be higher than that for the stoichiometric found by Saito et al..8,9) Another feature that can be seen in the experimental data from Saito et al. and Davis and Haasz is a small increase in the thermal conductivity at high temperature. Although the phonon contribution to the thermal conductivity would be expected to be decreased with temperature, the photon conductivity can exhibit a slight increase.10) This change can be significant, but it depends on the particular composition of the sample. It is possible that the data of Saito et al. and Davis and Haasz indicate that there is increased photon conductivity at high temperature. The values for thermal conductivity found in this work are consistently higher than that shown in silicone as reference. Overall, the trend of the thermal conductivity follows the experimental data, with the exception of experiments wherein the thermal conductivity was found to initially decrease before rising again with increased temperature, which could originate from impurities in the crystal structure that were not captured in the present simulations. This could suggest that this distinct behavior is not inherent to the pure polymer structure, and it would be expected to be observed in this work.
3.3. Modeling and Results of Curtain Wall Structural Parts
With the goal of analyzing the curtain wall system of an office building in terms of thermal performance with U-factors, the study proceeded as follows. The first, a literature review was conducted that covered previous studies on the thermal analysis of curtain wall system, related standards including ISO 10077, ISO 15099, EN ISO 10077-2, NFRC 100-2010, and KS L 2525, and trends in the criteria of energy saving building design in the nation. The secondly, an office building was selected, which was located in S City in the central region and completed with a curtain wall system.11-14) The present study conducted U-factor analysis for the curtain wall system of an office building. In the U-factor analysis, frames were divided into steel and entrance frames that made up the curtain wall structure in Case 1 of Table 3 and Case 2 of Table 4. U-factor analysis results were obtained for 20 sections in the fix and vent parts. In the U-factor analysis results, the temperature distribution of the head, jamb, sill, transom, and mullion sections was calculated along with the U-factors of frames and edges in the fix and vent parts. Tables 4 and 5 present temperature distribution in the indoor and outdoor boundaries and surfaces of frame sections, as well as the frames and glass along the indoor and outdoor boundary conditions. The analysis results show that the total heat flux of the fix type windows was 17.542 and 41.254 W each. The total U-factor was 2.232 and 2.356 W/m2·K each. The area of frames and edges was 1.54 m2, and the area of glass was 2.42 m2. Since the heat transmission coefficient of 24 mm double low-E glazing (6LE+12Ar+6CL) was approximately 1.46 W/m2·K, the heat transmittance coefficients of frames and edges in the CASE 1 and CASE 2 aluminum curtain walls were found to be 2.85 and 3.18 W/m2·K each based on the area weighted method.
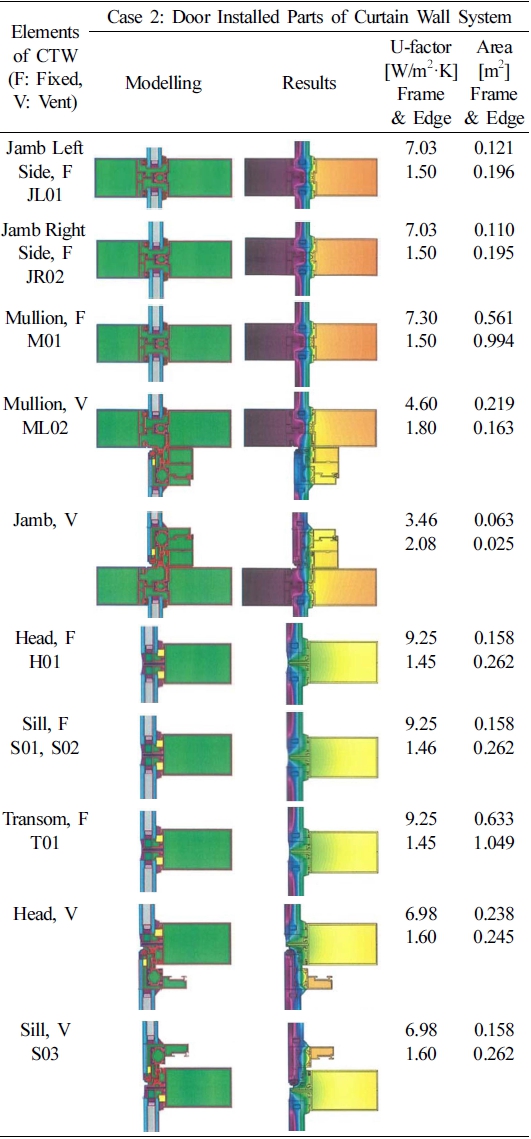
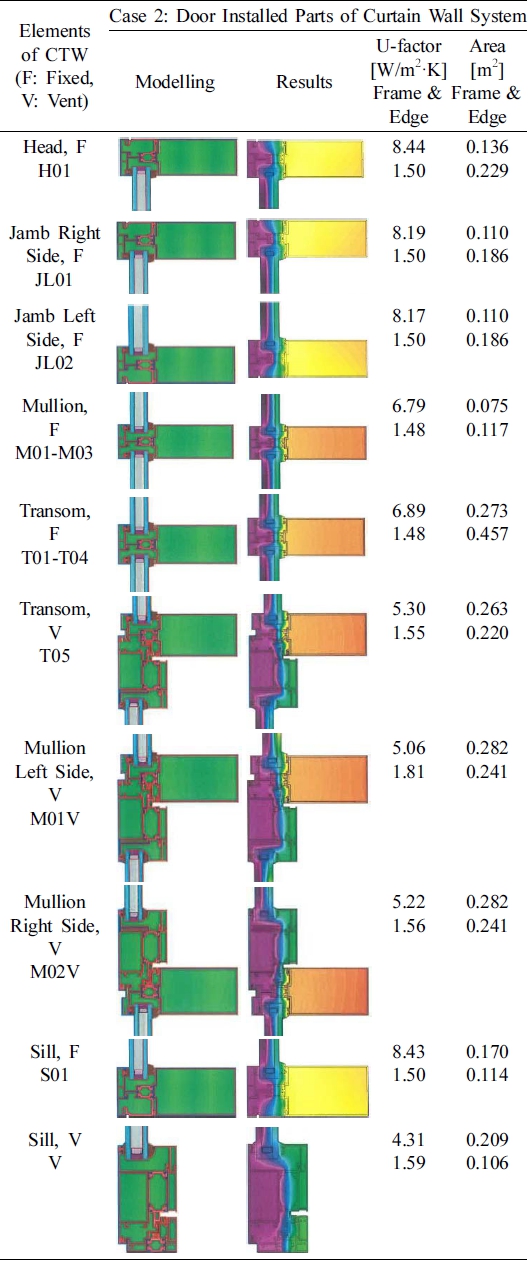
There were clear differences in U-factors between the fix and vent parts. In the fix type, the U-factor of heads, sills, and transoms was 9.25 W/m2·K, while that of jambs and mullions was 7.03 W/m2·K. In the vent type, it was in the range of 3.46 ~ 4.6 W/m2·K. This phenomenon is attributed to the weak thermal performance of frames. It is necessary to block heat transfer within frames by applying polyamide, a thermal break material, to meet the heat transmittance coefficient criteria for curtain wall frames. It is also necessary to minimize heat transfer in the parts that make direct contact with outdoor air by combining aluminum alloy and polyamide in the parts supporting glass at the bottom of the vents. When this form was applied to the fix parts, the heat transmission coefficient of the curtain wall frames in the vent type was improved. In curtain walls, the fix type recorded higher heat transmission coefficients than the vent type. When the area of frames with higher heat transmission coefficients was smaller, the average heat transmission coefficients of the entire curtain wall system decreased. Improving the insulation performance inside frames is an effective method for blocking conductive and convective heat, but it is predicted to have limitations in blocking radiant heat, which makes up 75 % of heat transfer.
4. Conclusions
This study presents thermal conductivity and conducted U-factor analysis corresponding to polymer materials for the curtain wall system of an office building. In U-factor analysis, frames were divided into Case 1 in the curtain wall structure and Case 2 in the entrance. U-factor analysis results were obtained from 20 points in the fix and vent parts. Case 1 had windows from 4.67 ~ 3.61 m, frames in a combination of fix and vent types, and 24 mm double glazing comprised of common glass of 6 mm, argon gas-filled glazing of 12 mm, and low-E glass of 6 mm. The U-factor was 1.45 W/m2·K, and the U-value was 2.232 W/m2·K according to the analysis results. Case 2 had windows of 4.00 ~ 3.20 m, frames in a combination of fix and vent types, and 24 mm double glazing comprised of common glass of 6mm, argon gas-filled glass of 12 mm, and low-E glass of 6 mm. The U-factor was 1.45 W/m2·K, and the U-value was 2.356 W/m2·K according to the analysis results. To meet the standard heat transmission coefficient of 3.0 W/m2·K for frames comprised of a curtain wall system, the study used polyamide as a thermal break material and combined aluminum alloy and polyamide for the bottom of the vent windows. According to the thermal performance analysis results, the fix and vent type respectively recorded values of 1.410 ~ 1.472 and 1.438 ~ 1.482 W/m2·K, thus meeting the legal criteria.
