

1. Introduction
Currently, the use of medium-to-large batteries, such as portable electronic devices, electric vehicles (EVs), and energy storage systems (ESS), has become ubiquitous. This further drives the demand for lithium-ion batteries (LIBs), which feature a high density, long lifespan, and high output.1,2) Commonly used LIBs contain flammable liquid organic electrolytes,3,4) which raises safety issues due to liquid electrolyte leakage and heightened risk of fire hazards. Such problems have also limited the application of new technologies, including EVs and smart grids. Therefore, various alternative materials are being researched to ensure improved safety. Among them, a wide variety of studies are being conducted on inorganic solid-state electrolytes such as Perovskite-type, NASICON-type, Garnet-type, LISICON-type, and Sulfide-type inorganic solid electrolytes, due to their excellent electrochemical and thermal stability at room temperature.5,6,7)
Among these inorganic solid-state electrolytes, NASICON-type solid-state electrolytes hold promise, as they are environmentally friendly, stable in air, cost-efficient, and have high ionic conductivity.8) The NASICON-type inorganic solid-state electrolyte with the chemical formula Na1+XZr2SiXP3-XO12 (0 ≤ X ≤ 3) was first reported by Hong and Goodenough.9) In general, NASICON-type solid-state electrolytes have AMe2(PO4)3 (A: Li+, Na+, K+, etc., Me: Ge4+, Ti4+, Zr4+, etc.) systems, with a rhombohedral crystal structure in the Rc space group.10) This structure forms a 3D framework in which tetrahedral PO4 and octahedral MeO6 corner-share oxygen atoms, making it an ionic conductive material with better structural stability and migration of lithium ions. LiTi2(PO4)3 is one of the most investigated NASICON-type solid-state electrolytes, and the grains demonstrate high ionic conductivity (10-4 S/cm) but a low total ionic conductivity (10-8~10-6 S/cm) due to high grain boundary resistance.11) The conductivity of LiTi2(PO4)3 is not significantly high. Therefore, its conductivity can be significantly improved through doping. To address these issues, the Li1+XMXTi2-X(PO4)3 (M: trivalent cation) system, in which the partial substitutes Ti4+ in LiTi2(PO4)3, has been actively investigated to enhance the ionic conductivity by compensating the charge balance and accommodating more lithium in the crystal structure.12,13) Most Li1+XMXTi2-X(PO4)3 solid-state electrolytes are prepared by melt-quenching and solid-phase synthesis. These methods require high heat treatment temperatures (≥1,200 °C) and long retention times (≥24 h), resulting in high energy, impurity formation, wide particle size distribution, and Li+ loss.14,15) On the other hand, the sol-gel process has been shown to be favorable for synthesizing multicomponent oxides, and does not require uniform particle size, low heat treatment temperature, or long retention time, making it a suitable technique for synthesizing lithium-based solid-state electrolytes.16,17,18)
The Li1+XAlXTi2-X(PO4)3 solid-state electrolytes represented by partially replacing Ti4+ with Al3+ have been favored by researchers for their excellent performance in promoting the diffusion of Li ions in the crystal. Considering that Ga3+ and Al3+ belong to the same main group and their properties are relatively similar, it would be necessary to conduct relevant research on the effects of Ga ion doping and different Ga content on the performance of Li1+XGaXTi2-X(PO4)3. In this study, Li-based solid-state electrolytes were prepared by the sol-gel method, a low-temperature synthesis technique, to produce a Li1+XGaXTi2-X(PO4)3 system with excellent single-phase and ionic conductivity due to Ga doping in place of Ti. The crystal structure, grain size, and shape were also investigated according to the Ga doping content, and complex impedance was measured and analyzed to investigate the effects on the ionic conductivity properties.
2. Experimental Procedure
Li1+XMXTi2-X(PO4)3 (M = Ga, x = 0.1, 0.3, 0.4) solid-state electrolytes were synthesized by the sol-gel process. First, 0.03 mol of TiO(C5H7O2)2 (95 %, TCI) was dissolved in 50 mL of distilled water after diluting 6 mL of HNO3 (60 %, Matsunoen) as a catalyst. Acetylacetone (99 %, Samchun) was added as a chelating agent while stirring to make an aqueous Ti solution, and the molar ratio of TiO(C5H7O2)2 to Acetylacetone was 1:2. Based on the aqueous Ti solution, the remaining starting materials, LiNO3 (98 %, Kanto), Ga(NO3)3 ‧ xH2O (99.9 %, Kojundo), and NH4H2PO4 (99.0 %, Junsei) were each dissolved in 50 mL of distilled water according to their stoichiometric ratios to make an aqueous solution. These solutions were then introduced sequentially into the above aqueous Ti solution and stirred. After stirring for 1 h to prepare a homogeneous sol, the mixture was aged at about 75 °C until it became a gel. After cooling, it was dried in a dry oven at 110 °C for 12 h and then ground with an agate mortar to obtain the precursor. The obtained precursor was placed in an alumina crucible and heat treated at 450 °C for 3 h to obtain the final powder. This powder was then uniaxially pressurized at 350 MPa to produce disc shapes with a 13 mm diameter and sintered from 800 to 1,000 °C at a heating rate of 2 °C/min for 6 h at each temperature to densify the shapes. The Li1+XGaXTi2-X(PO4)3 sintered bodies prepared according to different Ga doping contents were measured by their apparent density. Fig. 1 shows how to synthesize Li1+XGaXTi2-X(PO4)3 by the sol-gel method.

The thermal behavior of the prepared precursors was investigated by measuring weight loss and thermal decomposition changes in atmospheric conditions using thermogravimetric and differential thermal analysis (TG-DTA, MAC 2000) at a 10 °C/min heating rate from room temperature to 1,000 °C. The optimum temperature for calcination was determined based on the results. Then, the calcined powders were subjected to X-ray diffraction (XRD, X’Pert Pro, Panalytical, Cu-Kα, 40 KV, 30 mA, 4°/min, 2θ = 10~80°) to determine the presence or absence of crystalline and secondary phases of Li1+XGaXTi2-X(PO4)3 solid-state electrolytes with different x content obtained by heat treatment at different temperatures (800 °C, 900 °C, and 1,000 °C) for 6 h. XPS (MultiLab, ESCA 2000, Monochromator Al-Kα) measurement was performed to examine the presence and valence of elements in the synthesized Li1+XGaXTi2-X(PO4)3 solid-state electrolyte. Its microstructure was examined by FE-SEM (S-4800, Hitachi, Japan) to investigate the morphology and densification of the fracture surface of the sintered bodies. The correlation between the sintered density and ionic conductivity was also examined. The specimens selected for ionic conductivity measurements were coated with Au paste on both sides of the sintered body and then were heat treated at 750 °C for 30 minutes to form the electrodes. The ionic conductivity characteristics of the solid-state electrolytes were analyzed by measuring the complex impedance from room temperature to 300 °C by utilizing the alternating current two-terminal method using a HIOKI 3532-50 LCR meter. As for the measurement conditions, the impedance of the solid-state electrolyte prepared at various sintering temperatures was obtained by applying a frequency ranging from 5 Hz to 5 MHz at 1 V to calculate the ionic conductivity and activation energy.
3. Results and Discussion
Fig. 2 shows the results of analyzing the thermal behavior of Li1+XGaXTi2-X(PO4)3 (x = 0.1, 0.3, 0.4) precursors prepared by the sol-gel method. All precursors for each Ga doping content demonstrated similar thermal behavior. As the temperature increased, the thermal change peak of DTA appeared with a weight loss of about 45 % through evaporation and combustion in two stages up to about 400 °C, but there was no noticeable change in weight beyond 400 °C. The weight loss and subsequent endothermic peak observed at around 100 °C due to the evaporation of adherent water and the exothermic peak accompanied by significant weight loss at around 300 °C are considered to be caused by the decomposition and combustion of organic matter in the precursors.19,20,21) Additionally, although there was no noticeable change in weight, the small exothermic peak seen around 650 °C was attributed to the formation of a crystalline phase in the amorphous state of the manufactured precursor, and crystallization occurs past 650 °C.19,22) Therefore, the optimum temperature for calcination was determined to be 450 °C to ensure sufficient decomposition of organic matter in the precursors.

Fig. 3 shows the XRD patterns of the Li1+XGaXTi2-X(PO4)3 (x = 0.1, 0.3, 0.4) solid-state electrolyte powders obtained after calcining precursors with different Ga doping contents prepared by the sol-gel process and heat treating them for 6 h at 100 °C intervals in the sintering temperature range of 800~1,000 °C. All the diffraction patterns demonstrated that the NASICON-based LiTi2(PO4)3 (JCPDS 35-0754) had a rhombohedral crystal structure with an Rc space group. The peaks of the XRD pattern sharpened, and its intensity increased as the heat treatment temperature increased, suggesting that a Li-based solid-state electrolyte with excellent crystallinity was obtained. Overall, the Li1+XGaXTi2-X(PO4)3 heat-treated at each sintering temperature became a solid-state electrolyte with excellent crystallinity and no secondary phase due to the partial substitution of Ga3+ (0.62Å) with a similar ionic radius for Ti4+ with an ionic radius of 0.61 Å. However, at a Ga content of x = 0.4, a weak secondary phase corresponding to GaPO4, began to appear at 2θ = 22.0° and 26.5°. The GaPO4-like secondary phase appeared due to the solid solution limit at this Ga doping content. GaPO4 is a non-conductive crystalline phase that increases resistance, which affects ionic conductivity.23,24) The peak of the secondary phase in Fig. 3(c) is also known to be a secondary phase formed by the volatilization of Li in solid-state electrolyte samples heat-treated at 1,000 °C.12,14,19)

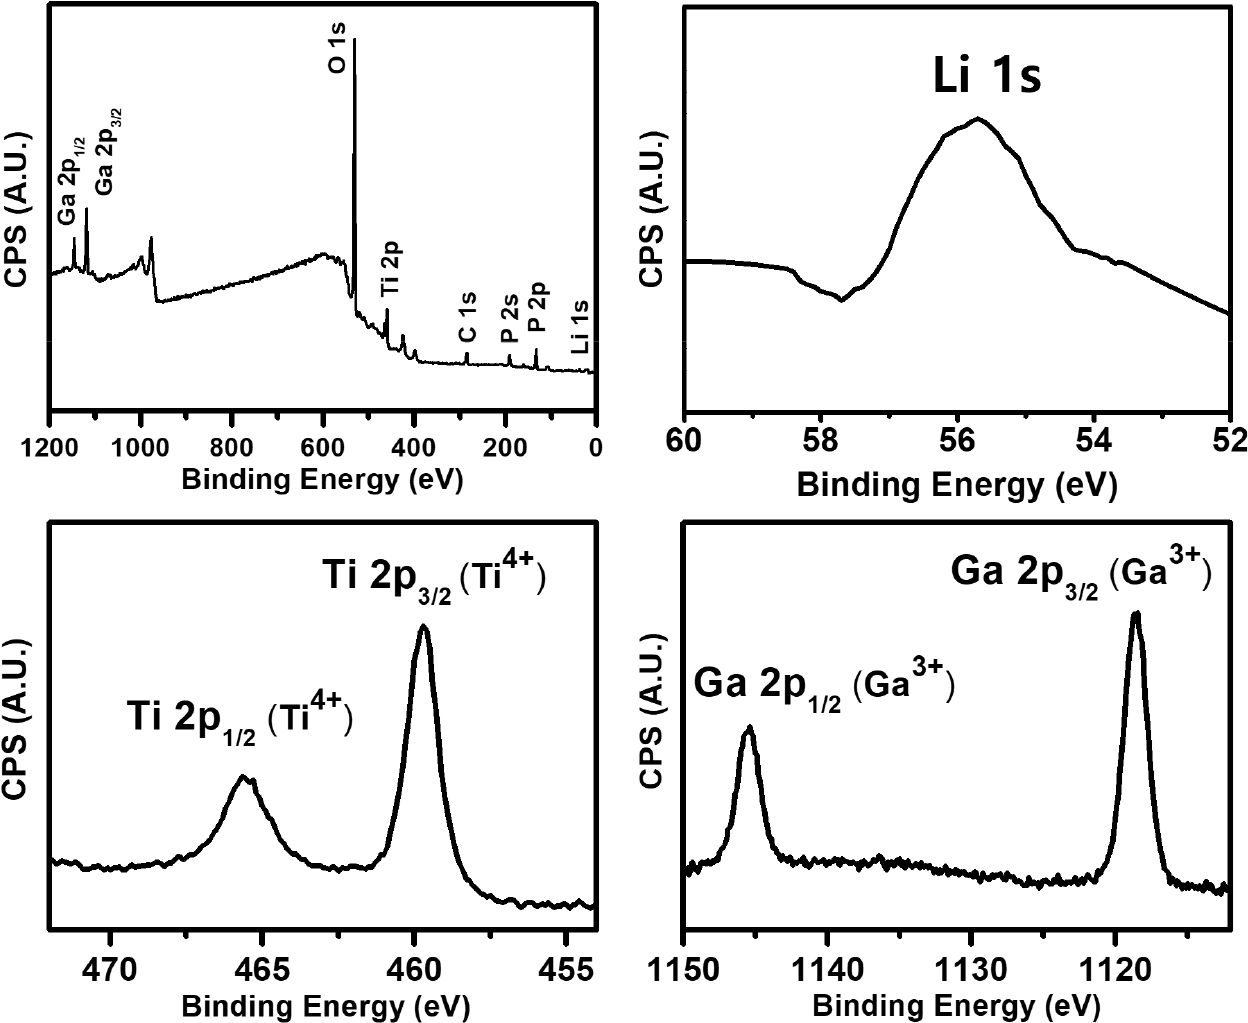
Fig. 4 shows the binding energy of the internal ion occupancy positions and oxygen coordination for Li1.3Ga0.3Ti1.7(PO4)3 solid-state electrolyte sintered at 900 °C for 6 h, as evidenced by XPS analysis. The results were first corrected using C 1s (BE = 284.8 eV) as an external source of carbon contamination. They showed characteristic binding energies corresponding to Li 1s, P 2s, P 2p, Ti 2p, O 1s, and Ga 2p over the entire binding energy range, confirming the presence of all elements in the prepared solid-state electrolyte. Fig. 4 also shows high-resolution spectral scans of each elemental track (Li 1s, Ti 2p, Ga 2p). The XPS spectrum of Li 1s had a very low intensity with a low signal-to-noise ratio due to the low scattering factor of Li, but the center peak had a binding energy of about 55.8 eV. Notably, the binding energies in each element of Ti and Ga were separated by a spin-orbit doublet. The binding energies of Ti 2p3/2 and Ti 2p1/2 were 459.7 eV and 465.5 eV, respectively, indicating that they exist in an oxidation state corresponding to Ti4+. Ga 2p3/2 and Ga 2p1/2 exhibited characteristic binding energy of Ga3+, corresponding to 1,119 eV and 1,146 eV, respectively. Therefore, it was confirmed that the valence number does not change when Ga is doped at the Ti site but exists as Ti4+ and Ga3+.
Evaluating solid-state electrolytes of dense sintered bodies with excellent crystallinity is a significant factor in demonstrating improved ionic conductivity. Fig. 5 shows the Li1+XGaXTi2-X(PO4)3 (x = 0.1, 0.3, 0.4) sintered bodies by sintering for 6 h at 100 °C intervals from 800 to 1,000 °C using powders with different Ga doping contents prepared by the sol-gel method. The size, morphology, and densification of grains in the fracture surface of these solid-state electrolyte-sintered bodies were observed using FE-SEM.
First, Fig. 5(a) shows an image of the fracture surface of Li1+XGaXTi2-X(PO4)3 (x = 0.1, 0.3, 0.4) solid-state electrolyte sintered at 800 °C. In the Li1.1Ga0.1Ti1.9(PO4)3 solid-state electrolyte with low Ga content, many grain boundaries can be observed, as if the small sub-µm-sized grains were filled in poorly, and little to no sintering occurred with many pores. As the Ga content increased, the grain size started to grow. Additionally, the grains became denser, though small pores existed between them. The shape of the grains also changed from a quasi-spherical shape to a cube-like shape. Fig. 5(b) shows an image of the fracture surface of the solid-state electrolyte sintered at 900 °C. The fracture surface of the solid-state electrolyte with a Ga content of x = 0.1 is filled with uniform grains that were slightly more spherical than those sintered at 800 °C but still display low density. The fracture surface of the solid electrolyte with a Ga content of 0.3 showed considerable densification of non-uniform cube-like grains that grew to 0.5~3 µm. In the fracture surface of the solid electrolyte sintered body with Ga content of 0.4, we can observe grains with a relatively uniform size (2~3 µm) were densely sintered by mutual grain diffusion to form a neck, and the shape seems to represent an intergranular fracture. The high sintering density of the solid-state electrolyte sintered body acts as an advantage for the diffusion of Li ions, resulting in high ionic conductivity. Increasing the Ga content without a sintering aid densified the Li1+XGaXTi2-X(PO4)3 solid-state electrolyte sintered body.12,13) However, this did not further improve the sintering properties, due to some closed pores in the grains. Fig. 5(c) shows an image of the fracture surface of Li1+XGaXTi2-X(PO4)3 solid-state electrolyte sintered at 1,000 °C. In the fracture surface of the solid electrolyte with a Ga content of 0.1, the nearly spherical uniform grains grown to a size of 0.5~1 µm formed necks with each other and were filled with a significant number of pores, and the fracture surface still displayed a low density. When the Ga content of the solid electrolyte sintered at 1,000 °C was x = 0.3 and 0.4, coarsening of rapidly grown grains between the size of 5~10 µm occurred. Also, the fracture surface of the solid electrolyte sintered body demonstrates a transgranular fracture rather than an intergranular fracture, suggesting further densification. However, such rapid coarsening of grains may generate pores at the grain boundary and adversely affect densification.25) Solid-state electrolytes with low Ga content demonstrate relatively lower densities than other solid-state electrolytes with high Ga content. This is because, although the density increases as the sintering temperature increases, this results in insufficient grain growth due to slow diffusion reactions between grains and low sintering characteristics due to the presence of multiple pores. Also, the sintering density at 1,000 °C worsens the sintering characteristics as grain growth occurs rapidly and pores are generated due to uneven contact between grains, resulting in a slight decrease in density or no further increase.

Ionic conductivity was evaluated by measuring the AC impedance of solid-state electrolytes prepared at different sintering temperatures. Fig. 6 shows Cole-Cole plots of the impedance measured at room temperature for Li1+XGaXTi2-X(PO4)3 (x = 0.1~0.4) sintered bodies. The impedance measurements of all solid-state electrolytes demonstrated a complex impedance pattern in semicircles representing the total impedance of the grains and grain boundaries in the high-frequency range, as well as straight lines in the low-frequency range due to the blocking of Li ions from the electrode. As shown in the fracture surface images and sintering characteristics of each solid electrolyte in Fig. 5, the impedance changes according to the sintering temperature and Ga content.26) Specifically, the structural modifications of the LiTi2(PO4)3 crystal by heteroatom doping with trivalent cations can yield the highly dense sintered bodies. This feature may enumerate several possibilities for the σ enhancement as follows: (1) Li ion insertion into the Li site, (2) enlargement of the space for the Li+ diffusion through the substitution for the larger trivalent ions, (3) increase of the mobile Li+, (4) increase in the density of sintered bodies.13) Thus, Ti4+ substitution effects in LiTi2(PO4)3 with trivalent cations for the conductivity improvement were related to the densification of the pellet sample. For example, the dopant of Al3+ in LiTi2(PO4)3 can not only increase the strength of the Ti-O bond, but also reduce the Li-O bond in the microstructure, leading to an improved ionic conductivity.27)Fig. 6(a) shows the impedance results of Li1+XGaXTi2-X(PO4)3 (x = 0.1, 0.3, 0.4) solid-state electrolyte sintered at 800 °C. The Li1.1Ga0.1Ti1.9(PO4)3 solid-state electrolyte with low Ga content exhibits a very high impedance due to poor sintering characteristics, and as the Ga content increases, the impedance gradually decreases due to the denser sintering characteristics. Fig. 6(b) shows the impedance characteristics of the solid-state electrolyte sintered at 900 °C. The solid-state electrolyte with a Ga content of x = 0.1 has a much smaller impedance value than the one sintered at 800 °C, but it still exhibits a large impedance due to poor sintering characteristics. The solid-state electrolyte with Ga contents of 0.3 and 0.4 showed significantly smaller impedance values due to the densification of the grown grains and high sintering density. Fig. 6(c) shows the impedance characteristics of Li1+XGaXTi2-X(PO4)3 solid-state electrolyte sintered at 1,000 °C. Compared to the impedance of the solid-state electrolyte sintered at 900 °C, it starts to increase slightly again, which is attributed to an increase in the impedance component of the grain boundary formed by the rapidly coarsening grains at the higher sintering temperature.26,28) Also, despite having similar sintering densities, the impedance characteristics of the solid-state electrolyte increased because the volatilization of Li and the formed secondary phase GaPO4 acted as a factor that hindered the migration of Li ions and the lack of Li, thereby affecting the impedance.

In general, ionic conductivity is the total ionic conductivity (σtot), including grains and grain boundaries. It was calculated as follows by determining the contact point where the straight line formed by the electrode and the semicircle meets as the resistance,
where, σtot is the total ionic conductivity, l is the sample’s thickness, S is the electrode area, and Rtot is the measured resistance. Table 1 shows the calculated apparent density and total ionic conductivity of the sintered bodies at different sintering temperatures and Ga content. The Li1.3Ga0.3Ti1.7(PO4)3 solid-state electrolyte sintered at 900 °C had a high sintered density and a relatively low impedance, resulting in a high total ionic conductivity of 7.66 × 10⁻⁵ S/cm.
Table 1.
Apparent density, total ion conductivity and activation energy of Li1+XGaXTi2-X(PO4)3 (x = 0.1~0.4) sintered bodies at various temperatures for 6 h.
Fig. 7 shows the Arrhenius plots of the correlation between ionic conductivity and temperature for Li1+XGaXTi2-X(PO4)3 (x = 0.1, 0.3, 0.4) solid-state electrolytes sintered at different temperatures. The activation energy (Ea) was calculated from the slope of the straight line. The Arrhenius equation is,
where, σ0 is the exponential factor, Ea is the activation energy, k is the Boltzmann constant, and T is the absolute temperature. As shown in Table 1, the lower the activation energy, the higher the Li-ion conductivity. These results are likely because lower activation energies allow Li ions to move more freely within the grain boundaries and lattice, resulting in higher ionic conductivity.29) Although the Li1.3Ga0.3Ti1.7(PO4)3 solid-state electrolyte sintered at 1,000 °C has a low activation energy of 0.33 eV, the total ionic conductivity was relatively low due to the uneven growth of coarsened grains. The low activation energy of Li1.3Ga0.3Ti1.7(PO4)3 solid-state electrolyte sintered at 900 °C was 0.36 eV.

4. Conclusion
This study synthesized Li1+XGaXTi2-X(PO4)3 (x = 0.1, 0.3, 0.4) solid-state electrolytes using the sol-gel method and investigated the influence of Ga content on sintering properties and ionic conductivity using complex impedance. A single-phase rhombohedral crystal structure of NASICON type Li1+XGaXTi2-X(PO4)3, in which a trivalent cation Ga3+ (0.62 Å) partially substitutes Ti4+ (0.61Å), was obtained. When the Ga content was low (x = 0.1), it exhibited very low ionic conductivity due to poor sintering properties. The sinterability improved by adding Ga, but a secondary phase of Li-deficient GaPO4 began to appear due to Li volatilization in solid-state electrolytes with higher Ga content and at higher temperatures above 1,000 °C. Also, irregular grain coarsening occurred in all solid-state electrolytes sintered at 1,000 °C, resulting in low ionic conductivity due to high resistance caused by grain boundaries. The Li1.3Ga0.3Ti1.7(PO4)3 solid-state electrolyte sintered at 900 °C had a relatively high sintered density and a high ionic conductivity of 7.66 × 10⁻⁵ S/cm, and the activation energy was 0.36 eV. On the other hand, the activation energy of the Li1.4Ga0.4Ti1.7(PO4)3 system increased at high sintering temperatures, which was attributed to the presence of closed pores in the grains and increased resistance of the grain boundaries due to grain growth, which hindered the migration of Li ions.
