

1. Introduction
2. Experimental Procedure
2.1. Materials
2.2. Chitin isolation from shrimp shells waste
2.3. Experimental design for optimizing chitin deacetylation with response surface methodology
2.4. Degree of deacetylation (DD) determination using FTIR
3. Result and Discussion
3.1. Yield, appearance, and chemical characteristics of isolated chitin from shrimp shell waste
3.2. Optimization of chitosan’s degree of deacetylation using the response surface method
4. Conclusion
1. Introduction
Shrimp is one of Indonesia’s principal export commodities, and annually, shrimp exports generate 40~65 % shrimp head (carapace) and shell (peeled) wastes that are typically discarded in landfills or sea and underutilized.1,2) However, shrimp shells contain abundant natural chitin biopolymer, a multifunctional chemical that could be isolated through deproteinization, demineralization, and decolorization.3,4,5) Chitin is a polysaccharide of β-(1→4)-N-acetyl-D-glucosamine with a crystal structure, has a white color, a hard and stiff texture, and is biodegradable, biocompatible and non-toxic.3,6,7) Owing to its unique properties, chitin has high economic value in the food, pharmaceutical, cosmetic, textile, and agricultural industries, as well as environmental remediation (as an adsorbent).3,8) Even so, chitin has poor solubility in water, mildly acidic or basic solutions, and most organic solvents, which must be modified into chitosan for broader applications.9)
Chitin may be converted into chitosan through a deacetylation process (partial or total removal of N-acetyl groups) using an alkaline treatment, where the resulting chitosan has amorphous biopolymer properties that are yellowish-white and soluble in organic acids.4) Most literature reported deacetylation of chitin with concentrated NaOH solution.10,11) The degree of deacetylation (DD), which represents the number of amino groups in the polymer chain, is used to express the ratio of D-glucosamine (GlcN) to N-acetyl-D-glucosamine (GlcNAc) content. To be called chitosan, the DD value needs to have at least 55~60 % GlcN units.4,12,13) Indeed, chitosan quality is strongly correlated to DD, as it is influenced by chitin source, alkali concentration, temperature, and time of deacetylation process.10) According to quality requirements, chitosan with more than 70 % DD is commonly used in the food industry and environmental areas (as adsorbent), whereas the cosmetic and biomedical industries require a DD of at least 80~90 %.13,14)
Hahn et al.15) deacetylated krill chitin utilizing a mixture of 50 % (w/v) NaOH and NaBH4 at 120 °C for 3 h under reflux while Agarwal et al.6) deacetylated crustacean chitin with 50 % NaOH solution in 1:50 w/v ratio at 15 psi pressure at 120 °C for 30 min using an autoclave and achieved chitosan with 88 % and 80 % of deacetylation degrees (DD), respectively. Since the chitin deacetylation process requires quite a long time and considerable energy when using conventional thermal heating (reflux or autoclave), another ecologically friendly and cost-effective deacetylation technology is required.
Microwave heating proved to be a more efficient method of deacetylating chitin than conventional heating, as it could yield high DD in a matter of minutes with lower NaOH concentration. Microwave radiation (650 W) on shrimp chitin for 12 mins with 40 % and 50 % of NaOH, resulting in chitosan DD of 82.8 % and 84 %, respectively.16) Sahu et al.17) found that a 40 % (w/v) NaOH concentration generated a DD of 76.2 % after 4 min of radiation, and a DD of 85.3 % was achieved after commercial chitin irradiation at 900 W of power with 45 % NaOH for 5.5 min. As a result, to achieve optimal DD, the parameters of base concentration, radiation power, and reaction time used for the microwave-assisted deacetylation process must be determined. These multiple factors made it challenging to comprehend and thereby control the DD of chitosan. Hence, optimizing the deacetylation process by a statistical approach for laboratory experimentation efficiency is necessary.
Response Surface Methodology (RSM) is frequently used to study the relationship between one or more response variables and several independent variables of complex chemical reactions because it requires only a specific amount of data to perform evaluation, analysis, and optimization, thus eliminating the trial and error that can occur in research with high accuracy (has a percentage error of less than ±5.0 %).18,19) Hwang et al.18) successfully used the RSM method to optimize chitin deacetylation but used conventional heating (autoclave) with three independent variables vis NaOH concentration, temperature, and reaction time on molecular weight (MW) and degree of deacetylation (DD) of chitosan as the response variable. Olafadehan et al.20) also reported the highest predicted DD (84.20 %) of chitosan yielded from utilizing 50 % w/w NaOH solution, 84.46 °C deacetylation temperature, and 187 min reaction time. This result is by their experimental DD value of chitosan obtained in the laboratory of 84.50 %.
Therefore, this study presents detailed information on the optimum conditions for producing chitosan from chitin isolated from local Indonesian shrimp shell waste at a certain deacetylation level using microwave radiation as the heat source. Response surface methodology optimization using central composite design (RSM-CCD) was carried out on three variables, namely NaOH concentration, radiation power, and reaction time, to comprehensively determine the best combination of variable conditions for microwave-assisted deacetylation of shrimp shell chitin.
2. Experimental Procedure
2.1. Materials
Shrimp shell waste obtained locally from Kranggan and Demangan markets (Yogyakarta, Indonesia) was used as raw material for chitin deacetylation. Chemicals used in this study included NaOH pellets (analytical grades), HCl solution (38 %, analytical grade), NaOCl (2 %, analytical grade), which were purchased from Merck, Germany, and deionized water.
2.2. Chitin isolation from shrimp shells waste
The shrimp shell waste was initially washed with water, dried under atmospheric conditions, and ground into powder. Subsequently, a sequence of deproteinization, demineralization, and decolorization steps were performed. In the deproteinization step, 70 g of shrimp shell powder reacted with a 1 mol L-1 NaOH solution at a ratio of 1:10 (sample weight to NaOH volume) and was stirred at 60~70 °C for 1 h. The mixture was then filtered, solid yield washed with distilled water, and dried in an oven at 60~70 °C for 24 h. A quantity of 58 g of deproteinated powder was subjected to demineralization using 1 mol L-1 HCl solution at a 1:10 sample weight to HCl volume ratio. The reaction proceeded at room temperature with stirring for 2 h, after which the solid was collected by filtration, washed with distilled water, and dried at 60~70 °C for 24 h in an oven. Then, 23 g of dry demineralization powder is taken and dissolved in a 0.315 % NaOCl solution with a sample-to-NaOCl ratio of 1:10 (g sample mL-1 NaOCl) for decolorization. Next, the mixture is stirred for 1.5 h at 40 °C. The mixture is then separated by filtration, washed with water, and dried in an oven at 60~70 °C for 24 h. Chitin powder is ground and filtered with a 60-mesh size for Fourier Transform Infrared (FTIR, Nicolet Avatar 360 IR) and X-ray diffraction (XRD, Shimadzu 600) analysis.
2.3. Experimental design for optimizing chitin deacetylation with response surface methodology
The experiments for optimizing chitin deacetylate were with three independent variables in the response surface methodology (RSM) approach and were designed based on the optimum values of NaOH concentration, radiation power, and reaction time obtained from the orientation. Based on the chitosan’s degree of deacetylation (DD) at the orientation, it was determined that the optimum areas for NaOH concentration, radiation power, and reaction time were 50~60 %, 120~200 W, and 2~3 min, respectively. The independent variables in the study were NaOH concentration (%w/v), radiation power (W), and reaction time (min), whereas the response variable was the degree of decomposition (DD).
The resulting DD was optimized using the RSM through one of the experimental model approaches. The statistical experimental model used was a second-order model with the central composite design (CCD) for three variables, with a total of 20 sample points consisting of 8 factorial points, 6 central points, and 6 axial points. The minimum, middle, and maximum points for each variable were determined, as shown in Table 1.
Table 1.
The results of the second-order model CCD codes for the three variables RSM.
Based on the results of the CCD codes with the three variables, the total research points were 20 points, with designs as shown in Table 2. The deacetylation process was carried out sequentially according to the designs in Table 2. The designs were generated from the Minitab 16 program. After knowing the CCD used, as in Table 2, the deacetylation process for each sample was carried out using 0.4 g of chitin. Chitin was dissolved in NaOH at each concentration using a sample-to-solution ratio of 1:10 (g sample/mL NaOH). The mixture was heated in a microwave oven [Sharp R-22Y (S)/(W)] at each power level and time, filtered, washed with distilled water and HCl solution (0.38 %) until reaching a neutral pH, and dried in an oven at 60 °C. Furthermore, 20 chitosan samples were produced from chitin deacetylation and then analyzed by FTIR to determine DD using the baseline method. With the three variables as independent variables and DD from chitosan as the response variable, optimization was carried out with the Minitab 16 program.
Table 2.
Second-order CCD’s design of experiment.
2.4. Degree of deacetylation (DD) determination using FTIR
The degree of deacetylation (DD) of chitosan can be measured through infrared spectroscopy by combining chitosan with KBr in the form of a KBr disc at an equal mass ratio in each sample measurement.21,22) Absorbance measurements for each sample were conducted within the frequency range of 4,000~400 cm-1, with DD calculations performed using two different baselines, baselines [a, Eq. (1)] and [b, Eq. (2)], previously applied by Khan et al.21) From the two baselines, the values A1655 and A3450 were required so that they were obtained from Eq. (3) and Eq. (4), where DF1 was for baseline (a) and DF2 was for baseline (b).
Notes:
A1655 : absorbance value at 1,655 cm-1 (amide I band as a measure of N-acetyl group content)
A3450 : absorbance value at 3,450 cm-1 (hydroxyl band as an internal standard to correct for differences in concentration of chitosan powder form in KBr disc)
1.33 : ratio of A1655 / A3450 at 100 % N-deacetylation
Notes:
DF1, DF2, and AC : the distance between the baseline and the tangent line
DE and AB : the distance between the baseline and the lowest valley
3. Result and Discussion
3.1. Yield, appearance, and chemical characteristics of isolated chitin from shrimp shell waste
To obtain chitin, the stages of chemical extraction taken were deproteinization, demineralization, and decolorization, based on the Hong method.3,4,23) Deproteinization is a process of removing protein from shrimp shells that consist of mixed chitin (20~30 %), proteins (30~40 %), minerals (30~50 %), and a small portion of pigments because the introduction of NaOH solution can disrupt the covalent bonds between chitin and proteins (glycoproteins).3,4,5) In this process, the protein is dissolved with dilute NaOH, and the N-acetyl backbone of the polymer is randomly hydrolyzed.13) After deproteinization, demineralization was conducted with the commonly used demineralizing agent, HCl solution, to eliminate a considerable amount of minerals (mainly CaCO3) in shrimp shells, leaving chitin and pigment.4,5) The resulting chitin is still whitish yellow. Therefore, a decolorization process was carried out to remove pigments from the chitin.
In this study, the total yield of white chitin succeeded in being isolated from shrimp shells was 27 % of the weight of dry shrimp shell waste used, a result that is consistent with previous reports stating that crustacean shells contain as much as 15~40 % chitin.1) To confirm the effective isolation of chitin through the sequential process of deproteinization, demineralization, and decolorization, followed by the rapid transformation into chitosan through microwave-assisted deacetylation, FTIR was performed on chitin and chitosan produced from both processes. The functional and structural groups present in both materials can be assessed based on FTIR spectra in Fig. 1. Characteristic absorption bands of chitin occurred at 3,446 cm-1 corresponding to the stretching vibrations of the O-H group and 3,267 cm-1 referring to the N-H stretching vibrations of the acetyl group (NHCOCH3). It is reinforced by several peaks at 2,962 cm-1, 1,660 cm-1, 1,620 cm-1, 1,560 cm-1, and 1,317 cm-1, which are respectively associated with asymmetric C-H stretching vibrations of CH3, C=O stretching vibrations of amide I on secondary amines, C-N stretching vibrations with superimposed C=O groups, N-H bending vibrations on amide II, and C-N stretching vibrations on amide III. When compared to FTIR spectra of chitin, the chitosan absorption bands at 2,962 cm-1 and 1,317 cm-1 decreased sharply, indicating that the acetyl group on chitin has been completely deacetylated leaving the amine group on chitosan. The adsorption band at 3,267 cm-1 nearly disappeared, implying that the deacetylation reaction successfully disrupted the hydrogen bond of N-H. It was strengthened by the absorption band at a wavenumber of 1,560 cm-1 (bending vibration of the N-H group of NH2) that appeared with a sharp absorption with a weak peak at 1,641 cm-1, which was the N-H group of the amide I group.

In chitin, both absorption bands were relatively the same or deacetylation had not occurred. The absorption bands of the O-H group also experienced a shift to a smaller and wider wavenumber (3,433 cm-1). Furthermore, the wavenumber 2,931 cm-1 and 2,929 cm-1 showed C-H stretching vibration (CH2). In addition, there were relatively similar peaks of chitosan and chitin at the wavenumbers of 1,416 cm-1 and 1,421 cm-1 for the asymmetric stretching vibration of the C-H (CH2) group, at 1,342 cm-1 and 1,379 cm-1 for the symmetric stretching vibration of the C-H (CH2) group, at 1,155 cm-1 and 1,157 cm-1 for the stretching vibration of the C-N group, at 1,022 and 1,026 cm-1 for the symmetric stretching vibration of the C-O (C-O-C) group, and at numbers 1,074 cm-1 and 1,072 cm-1 from the asymmetric stretching vibration of the C-O (C-O-C) group. These peaks are assigned to the skeletal stretching vibrations of the polysaccharide structure of chitin and chitosan.3,4,6,16,23)
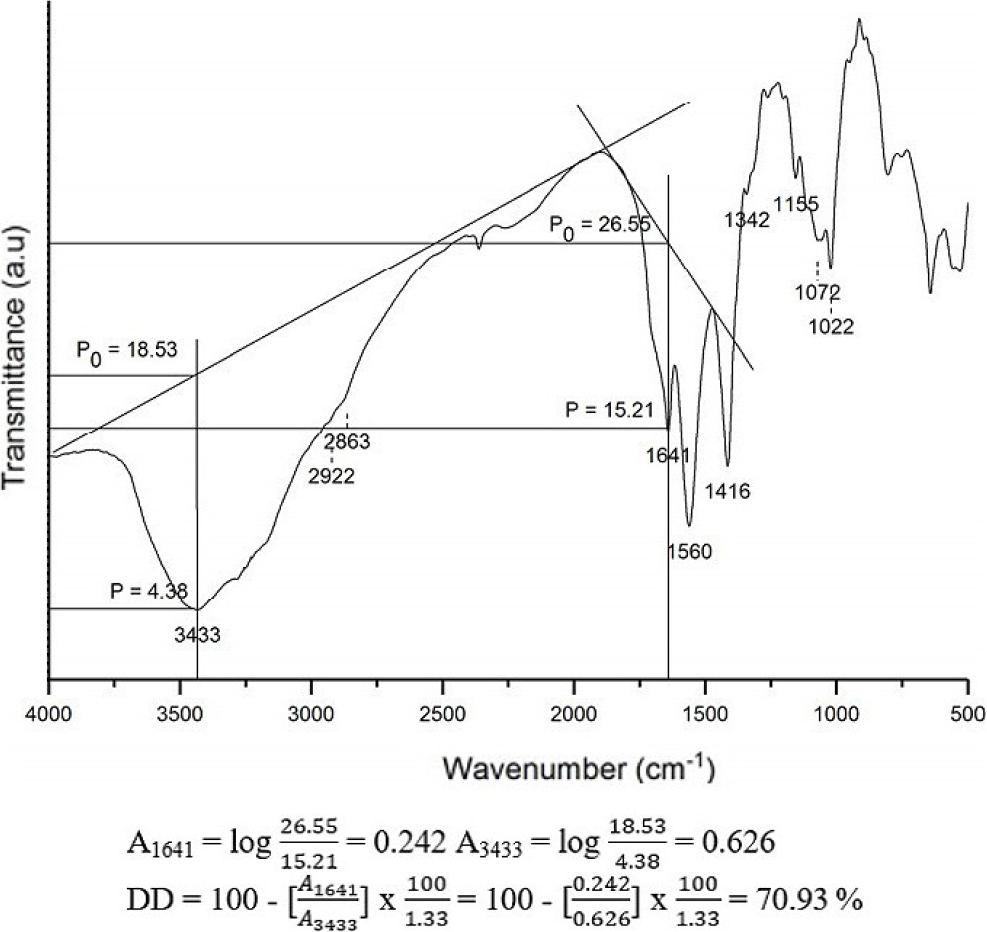
The deacetylation process of chitin can be calculated quantitatively through the degree of deacetylation (%) using the baseline method on the FTIR spectra.21) The degree of deacetylation (DD) is a quality parameter of chitosan that indicates that the acetyl group is deacetylated to become an amide group. DD can increase due to the influence of base concentration (NaOH), reaction time, and the microwave radiation used. Using the absorbance of chitin and chitosan at the wavenumbers of the primary amine group (A3450) and the amide group -NH (A1655), the degree of deacetylation was determined.24) The ratio of a fully acetylated compound’s two absorbances is represented by the value of 1.33 in the equation. The DD value of chitosan from Fig. 2 is 70.93 % obtained using 30 % NaOH concentration and 200 W radiation power within 3 min. Therefore, the orientation needs to be done first before optimizing with RSM to know the optimum area of the three variables that increase the degree of deacetylation in chitosan.
3.2. Optimization of chitosan’s degree of deacetylation using the response surface method
Based on the orientation, the optimum DD area can be identified so that the chitin microwave-assisted deacetylation process can be carried out with the working order and treatment of NaOH concentration, radiation power, and reaction time based on the RSM-CCD design for three variables. Each chitosan underwent FTIR testing to determine DD based on the baseline method. Table 3 shows that the DD was in the range of 53~75 %.
Table 3.
Chitosan’s degree of deacetylation using the second-order model.
Based on the data of the three variables and DD, as in Table 3, the data were processed with Minitab to test the significance, lack of fit, correlation, and residual as well as determine the model equations and the optimum point of the three independent variables shown by surface plots and contour plots. The significance test was carried out using ANOVA to find out which experimental variables were statistically significant. To evaluate the significance and adequacy of a statistical model, the analysis of variance (ANOVA) is needed.18,20) For the significance test with ANOVA, the hypothesis and the significance limit were determined. The significance limit used was 0.050 (95 % confidence level). Hypothesis (H0) said that the independent variables do not affect the response variable, while Hypothesis (H1) said that the independent variables do. The results of the ANOVA are shown in Table 4.
Table 4.
Results of the ANOVA test using the second-order method.
The results of the significance test in Table 4. show that the NaOH concentration, radiation power, and reaction time had a p-value less than the established significance limit (0.050) or a 95 % confidence level, thus rejecting H0 since the three variables had a significant effect on the degree of deacetylation. The three variables also significantly contributed to the second-order model based on the regression p-value (0.000), which was less than the significance limit (0.050). In addition to each significant variable, there were significant quadratic interactions between the variables and others, namely concentration and reaction time (X1.X3), radiation power and reaction time (X2.X3), and both radiation power interactions (X22).
Apart from being based on the p-value, the significance test can also be seen from the Fcount in Table 4. The significance test was carried out by testing Fcount based on the hypothesis with a significance limit of 0.050 or a 95 % confidence level. Hypothesis 0 (H0) said that the variable has a significant effect on the response, while Hypothesis 1 (H1) said that it does not. Based on Table 4. Fcount was 25.532, with Ftable for df1 (df1 : 3-1) and df2 (df2 : 20-3) was 3.59. So, Fcount was greater than Ftable, with H0 accepted since the variable used was significant to the response.
The appropriate model for use in this study was the second-order model based on the lack of fit test. The test was also based on the p-value of lack of fit so that hypotheses (H0) and (H1) were made with a significance of 0.050 or a 95 % confidence level. Hypothesis 0 (H0) would be accepted if the p-value is less than 0.050, indicating no model mismatch.20) The p-value was 0.074, thus accepting H0, indicating no discrepancy in the second-order model; the second-order model was said to be appropriate. The coefficient of determination (R2) value of 95.83 % could strengthen the accuracy of the model used, indicating that the model had a strong correlation when representing data. The R2 value also indicated that the variables NaOH concentration, irradiation power, and reaction time affected the deacetylation degree of 95.83 %, while the remaining 4.17 % was influenced by other variables outside the regression equation or variables not examined.
The model produced in Table 4 was a regression model with the relationship between the three independent variables and the response variable shown in Eq. (5).
With the response surface method, the relationship between the three variables with the degree of deacetylation can also be seen based on the correlation test (r). The correlation coefficient value is generated in the values -1 to +1 which indicates the correlation of the independent variable (X) with the response variable (Y) is getting stronger if the value is close to -1 or +1 and getting weaker if the value is close to 0. The results of the correlation test are shown in Table 5. NaOH concentration, irradiation power, and reaction time had correlation coefficients of 0.257, 0.680, and 0.390, respectively. Radiation power had a strong correlation (0.600~0.800) compared to the two low variables (0.200~0.400) because the process used was the absorption of microwave radiation that required or absorbed energy that allowed the reaction to occur.
Table 5.
The correlation between the three independent variables to the response variable.
| Independent variables (X) | Correlation coefficient (r) |
| NaOH concentration (%w/v) | 0.257 |
| Radiation power (W) | 0.680 |
| Reaction time (min) | 0.390 |
With the RSM, the DD could be predicted to approach the ideal value by minimizing error with the variables (X) used in this study in the form of an estimation regression model. The results of the DD for 20 samples are shown in Table 6. Based on Table 6, a linear regression equation was made, as shown in Fig. 3. According to the linear regression model in Fig. 3, the R2 value is 0.9339, indicating that 93.39 % of the response variable (Yprediction) could be explained by the independent variables (Yobservation), while the remaining 6.61 % could not be explained by those other than the independent variables (Yobservation) or error components.
Table 6.
The predicted value of the degree of deacetylation from the model equation.

The regression equation for the second-order model was further tested by testing the residual assumptions. The residuals were assumed to be identical and normally distributed. The identity test was carried out to ensure that the residual variances of the model obtained were equally distributed (homoscedasticity). In the second-order model, the surface of the response in the form of the contour and the surface plots of the response (degree of deacetylation) that is affected by NaOH concentration, radiation power, and reaction time can be identified. RSM plots are shown in Fig. 4 and Fig. 5.

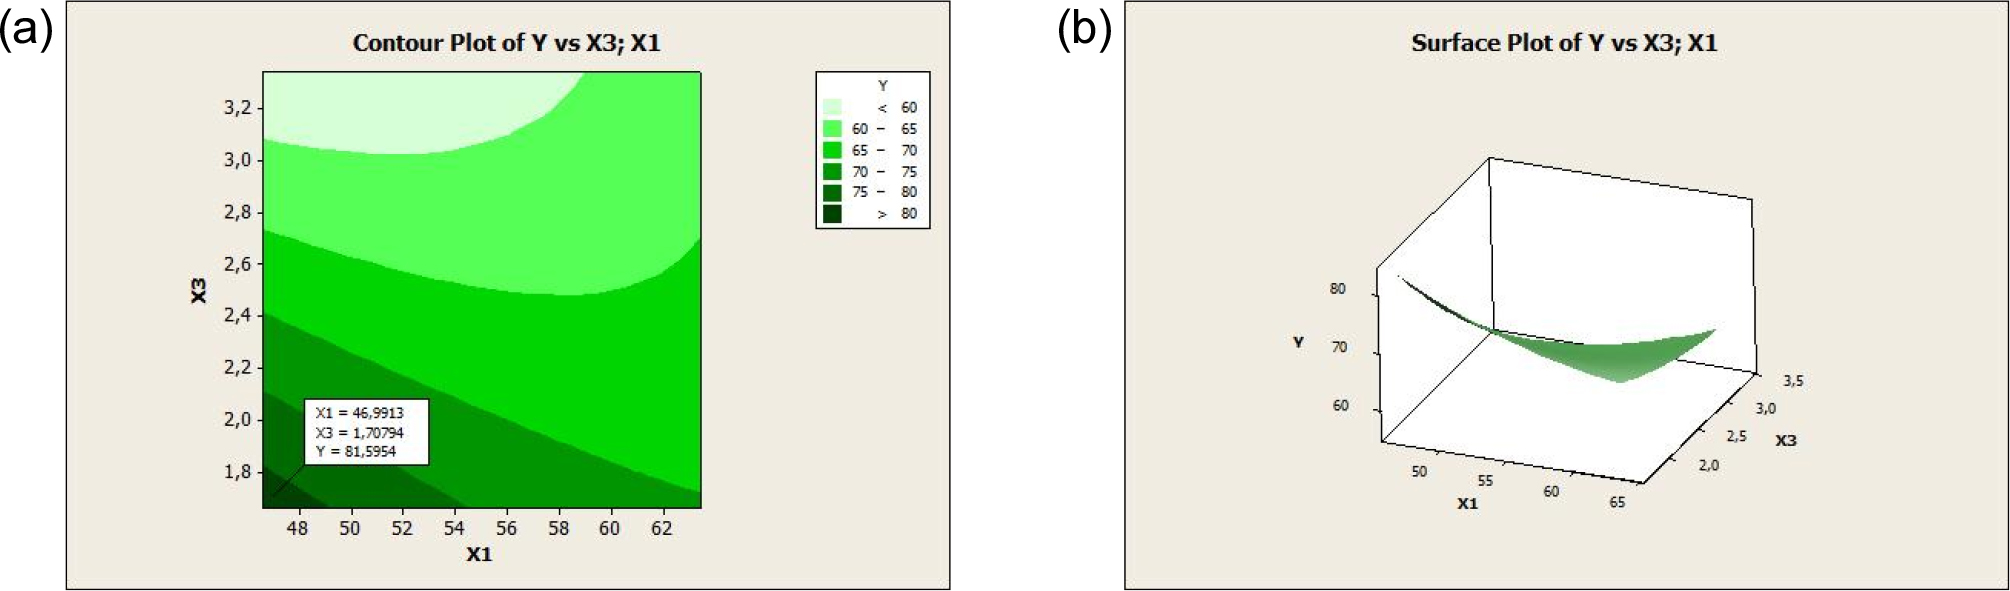
Based on Fig. 4 and Fig. 5, the contour plot was produced in color combinations, where the optimum area range is shown in dark green, indicating a DD value of more than 75 %. The optimum value is shown in the surface plot, which is a three-dimensional curve. From the two figures, the optimum DD occurred at a NaOH concentration of 62.88 (%w/v) and a radiation power of 223.61 W. Based on these two figures, the optimum DD was at a NaOH concentration of 46.99 % (w/v) and a reaction time of 1.7 min.
The results of the contour plot are in three dimensions, so it is necessary to determine one of the variables as a benchmark based on the p-value. From the results of second-order modeling, the p-value of NaOH concentration (0.025) is greater than the radiation power and reaction time so based on Fig. 4 and Fig. 5 the optimum degree of deacetylation was at a NaOH concentration of 62.88 % (w/v), a radiation power of 223.61 W, and a reaction time of 3.32 mins. The response optimization was carried out as shown in Fig. 6. The optimum point of the DD was 96.45 % at a NaOH concentration of 63.41 % (w/v), a power radiation of 227.28 W, and a reaction time of 3.34 mins with a desirability value of 1, which indicated that the optimization objective was fulfilled.25) The optimal conditions of the three variables could produce DD by chitosan quality standards, namely DD ≥ 70 %. When compared with previous studies that used conventional heating in the deacetylation process of chitin from crab shell waste, the results of RSM analysis showed that the optimum deacetylation degree value was 84.20 % with the optimum conditions of 50 % w/w NaOH solution, 84.46 °C deacetylation temperature, and 187 min deacetylation time.18) These results show that microwave heating can significantly increase the DD value of chitosan successfully obtained from chitin deacetylation and provide advantages from green chemistry.

4. Conclusion
The degree of deacetylation (DD) of chitosan from microwave-assisted deacetylation of chitin derived from shrimp shell waste was investigated through central composite design using response surface methodology (RSM-CCD), whose predictions were compared with experimental data and validated. The results showed that the deacetylation process of chitin using microwave radiation with a radiation power of 120~200 W can produce a DD of 53~75 % in just 2~3 min. RSM-CCD optimization resulted in deacetylation that reached 96.45 % of DD at 63.41 % (w/v) NaOH concentration, 227.28 W radiation power, and 3.34 min reaction time.
